|
|
市場調査レポート
商品コード
1456832
免疫沈降法の世界市場 2024-2028Global Immunoprecipitation Market 2024-2028 |
||||||
|
|||||||
カスタマイズ可能
|
|||||||

| 免疫沈降法の世界市場 2024-2028 |
|
出版日: 2024年03月11日
発行: TechNavio
ページ情報: 英文 161 Pages
納期: 即納可能
|

全表示
- 概要
- 図表
- 目次
免疫沈降法市場は2023-2028年に2億7,010万米ドル、予測期間中のCAGRは6.01%で成長すると予測されます。
当レポートでは、免疫沈降法市場の全体的な分析、市場規模・予測、動向、成長促進要因、課題、約25のベンダーを網羅したベンダー分析などを掲載しています。
現在の市場シナリオ、最新動向と促進要因、市場環境全体に関する最新分析を提供しています。市場は、バイオ医薬品の研究開発の増加、治療用抗体の需要の高まり、新生児スクリーニング検査への注目の高まりによって牽引されています。
| 市場範囲 | |
|---|---|
| 基準年 | 2024 |
| 終了年 | 2028 |
| 予測期間 | 2024-2028 |
| 成長モメンタム | 加速 |
| 前年比2024年 | 5.39% |
| CAGR | 6.01% |
| 増分額 | 2億7,010万米ドル |
本調査では、ゲノムプロジェクトの増加が、今後数年間の免疫沈降法市場成長を牽引する主な要因の1つであるとしています。また、臨床試験の増加、製造受託機関や受託調査機関の拡大が市場の大きな需要につながります。
目次
第1章 エグゼクティブサマリー
- 市場概要
第2章 市場情勢
- 市場エコシステム
第3章 市場規模の評価
- 市場の定義
- 市場セグメント分析
- 市場規模 2023
- 市場の見通し 2023-2028
第4章 市場規模実績
- 免疫沈降法の世界市場 2018-2022
- エンドユーザー別セグメント分析 2018-2022
- タイプ別セグメント分析 2018-2022
- 地域別セグメント分析 2018-2022
- 国別セグメント分析 2018-2022
第5章 ファイブフォース分析
- ファイブフォースの要約
- 買い手の交渉力
- 供給企業の交渉力
- 新規参入業者の脅威
- 代替品の脅威
- 競争の脅威
- 市況
第6章 市場セグメンテーション:エンドユーザー別
- 市場セグメント
- 比較:エンドユーザー別
- 学術研究機関:市場規模と予測 2023-2028
- 受託調査機関:市場規模と予測 2023-2028
- 製薬会社およびバイオテクノロジー会社:市場規模と予測 2023-2028
- 市場機会:エンドユーザー別
第7章 市場セグメンテーション:タイプ別
- 市場セグメント
- 比較:タイプ別
- クロマチン免疫沈降法:市場規模と予測 2023-2028
- 個々のタンパク質免疫沈降法:市場規模と予測 2023-2028
- 免疫共沈降法:市場規模と予測 2023-2028
- RNA免疫沈降法:市場規模と予測 2023-2028
- 市場機会:タイプ別
第8章 顧客情勢
- 顧客情勢の概要
第9章 地域別情勢
- 地域別セグメンテーション
- 地域別比較
- 北米:市場規模と予測 2023-2028
- 欧州:市場規模と予測 2023-2028
- アジア:市場規模と予測 2023-2028
- 世界のその他の地域:市場規模と予測 2023-2028
- 米国:市場規模と予測 2023-2028
- 英国:市場規模と予測 2023-2028
- 中国:市場規模と予測 2023-2028
- ドイツ:市場規模と予測 2023-2028
- カナダ:市場規模と予測 2023-2028
- 市場機会:地域情勢別
第10章 促進要因、課題、および動向
- 市場促進要因
- 市場の課題
- 促進要因と課題の影響
- 市場動向
第11章 ベンダー情勢
- 概要
- ベンダー情勢
- 混乱の状況
- 業界のリスク
第12章 ベンダー分析
- 対象ベンダー
- ベンダーの市場ポジショニング
- Active Motif Inc.
- Agilent Technologies Inc.
- Becton Dickinson and Company
- Bio Rad Laboratories Inc.
- Cell Signaling Technology Inc.
- Danaher Corp.
- GenScript Biotech Corp.
- JSR Micro Inc.
- Merck KGaA
- OriGene Technologies Inc.
- PerkinElmer Inc
- Proteintech Group Inc.
- Rockland Immunochemicals Inc.
- Santa Cruz Biotechnology Inc.
- Thermo Fisher Scientific Inc.
第13章 付録
Exhibits:
- Exhibits1: Executive Summary - Chart on Market Overview
- Exhibits2: Executive Summary - Data Table on Market Overview
- Exhibits3: Executive Summary - Chart on Global Market Characteristics
- Exhibits4: Executive Summary - Chart on Market By Geographical Landscape
- Exhibits5: Executive Summary - Chart on Market Segmentation by End-user
- Exhibits6: Executive Summary - Chart on Market Segmentation by Type
- Exhibits7: Executive Summary - Chart on Incremental Growth
- Exhibits8: Executive Summary - Data Table on Incremental Growth
- Exhibits9: Executive Summary - Chart on Vendor Market Positioning
- Exhibits10: Parent market
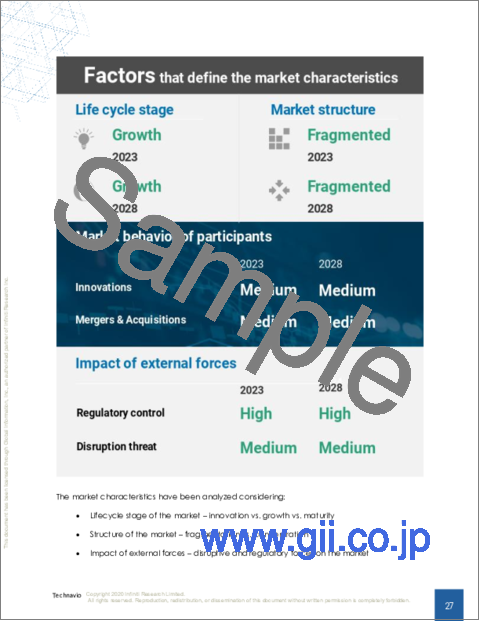
- Exhibits11: Market Characteristics
- Exhibits12: Offerings of vendors included in the market definition
- Exhibits13: Market segments
- Exhibits14: Chart on Global - Market size and forecast 2023-2028 ($ million)
- Exhibits15: Data Table on Global - Market size and forecast 2023-2028 ($ million)
- Exhibits16: Chart on Global Market: Year-over-year growth 2023-2028 (%)
- Exhibits17: Data Table on Global Market: Year-over-year growth 2023-2028 (%)
- Exhibits18: Historic Market Size - Data Table on global immunoprecipitation market 2018 - 2022 ($ million)
- Exhibits19: Historic Market Size - End-User Segment 2018 - 2022 ($ million)
- Exhibits20: Historic Market Size - Type Segment 2018 - 2022 ($ million)
- Exhibits21: Historic Market Size - Geography Segment 2018 - 2022 ($ million)
- Exhibits22: Historic Market Size - Country Segment 2018 - 2022 ($ million)
- Exhibits23: Five forces analysis - Comparison between 2023 and 2028
- Exhibits24: Chart on Bargaining power of buyers - Impact of key factors 2023 and 2028
- Exhibits25: Bargaining power of suppliers - Impact of key factors in 2023 and 2028
- Exhibits26: Threat of new entrants - Impact of key factors in 2023 and 2028
- Exhibits27: Threat of substitutes - Impact of key factors in 2023 and 2028
- Exhibits28: Threat of rivalry - Impact of key factors in 2023 and 2028
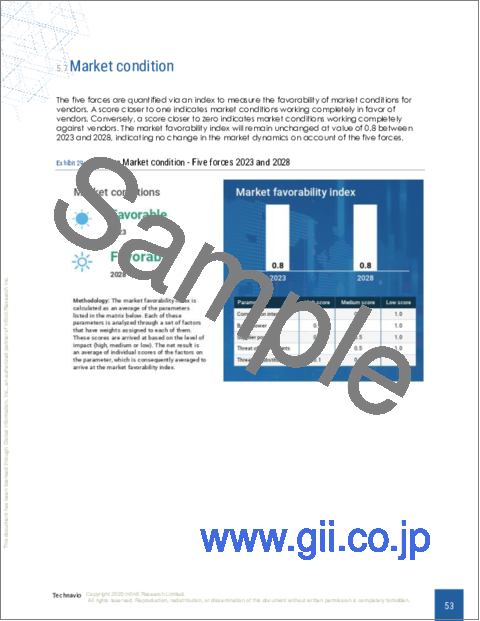
- Exhibits29: Chart on Market condition - Five forces 2023 and 2028
- Exhibits30: Chart on End-user - Market share 2023-2028 (%)
- Exhibits31: Data Table on End-user - Market share 2023-2028 (%)
- Exhibits32: Chart on Comparison by End-user
- Exhibits33: Data Table on Comparison by End-user
- Exhibits34: Chart on Academic and research institutes - Market size and forecast 2023-2028 ($ million)
- Exhibits35: Data Table on Academic and research institutes - Market size and forecast 2023-2028 ($ million)
- Exhibits36: Chart on Academic and research institutes - Year-over-year growth 2023-2028 (%)
- Exhibits37: Data Table on Academic and research institutes - Year-over-year growth 2023-2028 (%)
- Exhibits38: Chart on Contract research organizations - Market size and forecast 2023-2028 ($ million)
- Exhibits39: Data Table on Contract research organizations - Market size and forecast 2023-2028 ($ million)
- Exhibits40: Chart on Contract research organizations - Year-over-year growth 2023-2028 (%)
- Exhibits41: Data Table on Contract research organizations - Year-over-year growth 2023-2028 (%)
- Exhibits42: Chart on Pharmaceutical and biotechnology companies - Market size and forecast 2023-2028 ($ million)
- Exhibits43: Data Table on Pharmaceutical and biotechnology companies - Market size and forecast 2023-2028 ($ million)
- Exhibits44: Chart on Pharmaceutical and biotechnology companies - Year-over-year growth 2023-2028 (%)
- Exhibits45: Data Table on Pharmaceutical and biotechnology companies - Year-over-year growth 2023-2028 (%)
- Exhibits46: Market opportunity by End-user ($ million)
- Exhibits47: Data Table on Market opportunity by End-user ($ million)
- Exhibits48: Chart on Type - Market share 2023-2028 (%)
- Exhibits49: Data Table on Type - Market share 2023-2028 (%)
- Exhibits50: Chart on Comparison by Type
- Exhibits51: Data Table on Comparison by Type
- Exhibits52: Chart on Chromatin immunoprecipitation - Market size and forecast 2023-2028 ($ million)
- Exhibits53: Data Table on Chromatin immunoprecipitation - Market size and forecast 2023-2028 ($ million)
- Exhibits54: Chart on Chromatin immunoprecipitation - Year-over-year growth 2023-2028 (%)
- Exhibits55: Data Table on Chromatin immunoprecipitation - Year-over-year growth 2023-2028 (%)
- Exhibits56: Chart on Individual protein immunoprecipitation - Market size and forecast 2023-2028 ($ million)
- Exhibits57: Data Table on Individual protein immunoprecipitation - Market size and forecast 2023-2028 ($ million)
- Exhibits58: Chart on Individual protein immunoprecipitation - Year-over-year growth 2023-2028 (%)
- Exhibits59: Data Table on Individual protein immunoprecipitation - Year-over-year growth 2023-2028 (%)
- Exhibits60: Chart on Co-immunoprecipitation - Market size and forecast 2023-2028 ($ million)
- Exhibits61: Data Table on Co-immunoprecipitation - Market size and forecast 2023-2028 ($ million)
- Exhibits62: Chart on Co-immunoprecipitation - Year-over-year growth 2023-2028 (%)
- Exhibits63: Data Table on Co-immunoprecipitation - Year-over-year growth 2023-2028 (%)
- Exhibits64: Chart on RNA immunoprecipitation - Market size and forecast 2023-2028 ($ million)
- Exhibits65: Data Table on RNA immunoprecipitation - Market size and forecast 2023-2028 ($ million)
- Exhibits66: Chart on RNA immunoprecipitation - Year-over-year growth 2023-2028 (%)
- Exhibits67: Data Table on RNA immunoprecipitation - Year-over-year growth 2023-2028 (%)
- Exhibits68: Market opportunity by Type ($ million)
- Exhibits69: Data Table on Market opportunity by Type ($ million)
- Exhibits70: Analysis of price sensitivity, lifecycle, customer purchase basket, adoption rates, and purchase criteria
- Exhibits71: Chart on Market share By Geographical Landscape 2023-2028 (%)
- Exhibits72: Data Table on Market share By Geographical Landscape 2023-2028 (%)
- Exhibits73: Chart on Geographic comparison
- Exhibits74: Data Table on Geographic comparison
- Exhibits75: Chart on North America - Market size and forecast 2023-2028 ($ million)
- Exhibits76: Data Table on North America - Market size and forecast 2023-2028 ($ million)
- Exhibits77: Chart on North America - Year-over-year growth 2023-2028 (%)
- Exhibits78: Data Table on North America - Year-over-year growth 2023-2028 (%)
- Exhibits79: Chart on Europe - Market size and forecast 2023-2028 ($ million)
- Exhibits80: Data Table on Europe - Market size and forecast 2023-2028 ($ million)
- Exhibits81: Chart on Europe - Year-over-year growth 2023-2028 (%)
- Exhibits82: Data Table on Europe - Year-over-year growth 2023-2028 (%)
- Exhibits83: Chart on Asia - Market size and forecast 2023-2028 ($ million)
- Exhibits84: Data Table on Asia - Market size and forecast 2023-2028 ($ million)
- Exhibits85: Chart on Asia - Year-over-year growth 2023-2028 (%)
- Exhibits86: Data Table on Asia - Year-over-year growth 2023-2028 (%)
- Exhibits87: Chart on Rest of World (ROW) - Market size and forecast 2023-2028 ($ million)
- Exhibits88: Data Table on Rest of World (ROW) - Market size and forecast 2023-2028 ($ million)
- Exhibits89: Chart on Rest of World (ROW) - Year-over-year growth 2023-2028 (%)
- Exhibits90: Data Table on Rest of World (ROW) - Year-over-year growth 2023-2028 (%)
- Exhibits91: Chart on US - Market size and forecast 2023-2028 ($ million)
- Exhibits92: Data Table on US - Market size and forecast 2023-2028 ($ million)
- Exhibits93: Chart on US - Year-over-year growth 2023-2028 (%)
- Exhibits94: Data Table on US - Year-over-year growth 2023-2028 (%)
- Exhibits95: Chart on UK - Market size and forecast 2023-2028 ($ million)
- Exhibits96: Data Table on UK - Market size and forecast 2023-2028 ($ million)
- Exhibits97: Chart on UK - Year-over-year growth 2023-2028 (%)
- Exhibits98: Data Table on UK - Year-over-year growth 2023-2028 (%)
- Exhibits99: Chart on China - Market size and forecast 2023-2028 ($ million)
- Exhibits100: Data Table on China - Market size and forecast 2023-2028 ($ million)
- Exhibits101: Chart on China - Year-over-year growth 2023-2028 (%)
- Exhibits102: Data Table on China - Year-over-year growth 2023-2028 (%)
- Exhibits103: Chart on Germany - Market size and forecast 2023-2028 ($ million)
- Exhibits104: Data Table on Germany - Market size and forecast 2023-2028 ($ million)
- Exhibits105: Chart on Germany - Year-over-year growth 2023-2028 (%)
- Exhibits106: Data Table on Germany - Year-over-year growth 2023-2028 (%)
- Exhibits107: Chart on Canada - Market size and forecast 2023-2028 ($ million)
- Exhibits108: Data Table on Canada - Market size and forecast 2023-2028 ($ million)
- Exhibits109: Chart on Canada - Year-over-year growth 2023-2028 (%)
- Exhibits110: Data Table on Canada - Year-over-year growth 2023-2028 (%)
- Exhibits111: Market opportunity By Geographical Landscape ($ million)
- Exhibits112: Data Tables on Market opportunity By Geographical Landscape ($ million)
- Exhibits113: Impact of drivers and challenges in 2023 and 2028
- Exhibits114: Overview on Criticality of inputs and Factors of differentiation
- Exhibits115: Overview on factors of disruption
- Exhibits116: Impact of key risks on business
- Exhibits117: Vendors covered
- Exhibits118: Matrix on vendor position and classification
- Exhibits119: Active Motif Inc. - Overview
- Exhibits120: Active Motif Inc. - Product / Service
- Exhibits121: Active Motif Inc. - Key offerings
- Exhibits122: Agilent Technologies Inc. - Overview
- Exhibits123: Agilent Technologies Inc. - Business segments
- Exhibits124: Agilent Technologies Inc. - Key news
- Exhibits125: Agilent Technologies Inc. - Key offerings
- Exhibits126: Agilent Technologies Inc. - Segment focus
- Exhibits127: Becton Dickinson and Company - Overview
- Exhibits128: Becton Dickinson and Company - Business segments
- Exhibits129: Becton Dickinson and Company - Key news
- Exhibits130: Becton Dickinson and Company - Key offerings
- Exhibits131: Becton Dickinson and Company - Segment focus
- Exhibits132: Bio Rad Laboratories Inc. - Overview
- Exhibits133: Bio Rad Laboratories Inc. - Business segments
- Exhibits134: Bio Rad Laboratories Inc. - Key news
- Exhibits135: Bio Rad Laboratories Inc. - Key offerings
- Exhibits136: Bio Rad Laboratories Inc. - Segment focus
- Exhibits137: Cell Signaling Technology Inc. - Overview
- Exhibits138: Cell Signaling Technology Inc. - Product / Service
- Exhibits139: Cell Signaling Technology Inc. - Key offerings
- Exhibits140: Danaher Corp. - Overview
- Exhibits141: Danaher Corp. - Business segments
- Exhibits142: Danaher Corp. - Key news
- Exhibits143: Danaher Corp. - Key offerings
- Exhibits144: Danaher Corp. - Segment focus
- Exhibits145: GenScript Biotech Corp. - Overview
- Exhibits146: GenScript Biotech Corp. - Business segments
- Exhibits147: GenScript Biotech Corp. - Key news
- Exhibits148: GenScript Biotech Corp. - Key offerings
- Exhibits149: GenScript Biotech Corp. - Segment focus
- Exhibits150: JSR Micro Inc. - Overview
- Exhibits151: JSR Micro Inc. - Product / Service
- Exhibits152: JSR Micro Inc. - Key offerings
- Exhibits153: Merck KGaA - Overview
- Exhibits154: Merck KGaA - Business segments
- Exhibits155: Merck KGaA - Key news
- Exhibits156: Merck KGaA - Key offerings
- Exhibits157: Merck KGaA - Segment focus
- Exhibits158: OriGene Technologies Inc. - Overview
- Exhibits159: OriGene Technologies Inc. - Product / Service
- Exhibits160: OriGene Technologies Inc. - Key offerings
- Exhibits161: PerkinElmer Inc - Overview
- Exhibits162: PerkinElmer Inc - Business segments
- Exhibits163: PerkinElmer Inc - Key news
- Exhibits164: PerkinElmer Inc - Key offerings
- Exhibits165: PerkinElmer Inc - Segment focus
- Exhibits166: Proteintech Group Inc. - Overview
- Exhibits167: Proteintech Group Inc. - Product / Service
- Exhibits168: Proteintech Group Inc. - Key offerings
- Exhibits169: Rockland Immunochemicals Inc. - Overview
- Exhibits170: Rockland Immunochemicals Inc. - Product / Service
- Exhibits171: Rockland Immunochemicals Inc. - Key offerings
- Exhibits172: Santa Cruz Biotechnology Inc. - Overview
- Exhibits173: Santa Cruz Biotechnology Inc. - Product / Service
- Exhibits174: Santa Cruz Biotechnology Inc. - Key offerings
- Exhibits175: Thermo Fisher Scientific Inc. - Overview
- Exhibits176: Thermo Fisher Scientific Inc. - Business segments
- Exhibits177: Thermo Fisher Scientific Inc. - Key news
- Exhibits178: Thermo Fisher Scientific Inc. - Key offerings
- Exhibits179: Thermo Fisher Scientific Inc. - Segment focus
- Exhibits180: Inclusions checklist
- Exhibits181: Exclusions checklist
- Exhibits182: Currency conversion rates for US$
- Exhibits183: Research methodology
- Exhibits184: Validation techniques employed for market sizing
- Exhibits185: Information sources
- Exhibits186: List of abbreviations
The immunoprecipitation market is forecasted to grow by USD 270.1 mn during 2023-2028, accelerating at a CAGR of 6.01% during the forecast period. The report on the immunoprecipitation market provides a holistic analysis, market size and forecast, trends, growth drivers, and challenges, as well as vendor analysis covering around 25 vendors.
The report offers an up-to-date analysis regarding the current market scenario, the latest trends and drivers, and the overall market environment. The market is driven by increasing r and d in biopharmaceuticals, rising demand for therapeutic antibodies, and growing focus on newborn screening tests.
Technavio's immunoprecipitation market is segmented as below:
| Market Scope | |
|---|---|
| Base Year | 2024 |
| End Year | 2028 |
| Series Year | 2024-2028 |
| Growth Momentum | Accelerate |
| YOY 2024 | 5.39% |
| CAGR | 6.01% |
| Incremental Value | $270.1mn |
By End-user
- Academic and research institutes
- Contract research organizations
- Pharmaceutical and biotechnology companies
By Type
- Chromatin immunoprecipitation
- Individual protein immunoprecipitation
- Co-immunoprecipitation
- RNA immunoprecipitation
By Geographical Landscape
- North America
- Europe
- Asia
- Rest of World (ROW)
This study identifies the rising number of genome projects as one of the prime reasons driving the immunoprecipitation market growth during the next few years. Also, increasing clinical trials and growing expansion of contract manufacturing organizations and cros will lead to sizable demand in the market.
The report on the immunoprecipitation market covers the following areas:
- Immunoprecipitation market sizing
- Immunoprecipitation market forecast
- Immunoprecipitation market industry analysis
The robust vendor analysis is designed to help clients improve their market position, and in line with this, this report provides a detailed analysis of several leading immunoprecipitation market vendors that include Active Motif Inc., Agilent Technologies Inc., Becton Dickinson and Company, Bio Rad Laboratories Inc., Cell Signaling Technology Inc., Chargen Life Sciences LLP, CLOUD CLONE CORP., Creative Biolabs, Danaher Corp., GenScript Biotech Corp., JSR Micro Inc., Merck KGaA, OriGene Technologies Inc., PerkinElmer Inc, Proteintech Group Inc., Rockland Immunochemicals Inc., Santa Cruz Biotechnology Inc., Sino Biological Inc., and Thermo Fisher Scientific Inc.. Also, the immunoprecipitation market analysis report includes information on upcoming trends and challenges that will influence market growth. This is to help companies strategize and leverage all forthcoming growth opportunities.
The study was conducted using an objective combination of primary and secondary information including inputs from key participants in the industry. The report contains a comprehensive market and vendor landscape in addition to an analysis of the key vendors.
The publisher presents a detailed picture of the market by the way of study, synthesis, and summation of data from multiple sources by an analysis of key parameters such as profit, pricing, competition, and promotions. It presents various market facets by identifying the key industry influencers. The data presented is comprehensive, reliable, and a result of extensive research - both primary and secondary. The market research reports provide a complete competitive landscape and an in-depth vendor selection methodology and analysis using qualitative and quantitative research to forecast the accurate market growth.
Table of Contents
1 Executive Summary
- 1.1 Market overview
2 Market Landscape
- 2.1 Market ecosystem
3 Market Sizing
- 3.1 Market definition
- 3.2 Market segment analysis
- 3.3 Market size 2023
- 3.4 Market outlook: Forecast for 2023-2028
4 Historic Market Size
- 4.1 Global immunoprecipitation market 2018 - 2022
- 4.2 End-User Segment Analysis 2018 - 2022
- 4.3 Type Segment Analysis 2018 - 2022
- 4.4 Geography Segment Analysis 2018 - 2022
- 4.5 Country Segment Analysis 2018 - 2022
5 Five Forces Analysis
- 5.1 Five forces summary
- 5.2 Bargaining power of buyers
- 5.3 Bargaining power of suppliers
- 5.4 Threat of new entrants
- 5.5 Threat of substitutes
- 5.6 Threat of rivalry
- 5.7 Market condition
6 Market Segmentation by End-user
- 6.1 Market segments
- 6.2 Comparison by End-user
- 6.3 Academic and research institutes - Market size and forecast 2023-2028
- 6.4 Contract research organizations - Market size and forecast 2023-2028
- 6.5 Pharmaceutical and biotechnology companies - Market size and forecast 2023-2028
- 6.6 Market opportunity by End-user
7 Market Segmentation by Type
- 7.1 Market segments
- 7.2 Comparison by Type
- 7.3 Chromatin immunoprecipitation - Market size and forecast 2023-2028
- 7.4 Individual protein immunoprecipitation - Market size and forecast 2023-2028
- 7.5 Co-immunoprecipitation - Market size and forecast 2023-2028
- 7.6 RNA immunoprecipitation - Market size and forecast 2023-2028
- 7.7 Market opportunity by Type
8 Customer Landscape
- 8.1 Customer landscape overview
9 Geographic Landscape
- 9.1 Geographic segmentation
- 9.2 Geographic comparison
- 9.3 North America - Market size and forecast 2023-2028
- 9.4 Europe - Market size and forecast 2023-2028
- 9.5 Asia - Market size and forecast 2023-2028
- 9.6 Rest of World (ROW) - Market size and forecast 2023-2028
- 9.7 US - Market size and forecast 2023-2028
- 9.8 UK - Market size and forecast 2023-2028
- 9.9 China - Market size and forecast 2023-2028
- 9.10 Germany - Market size and forecast 2023-2028
- 9.11 Canada - Market size and forecast 2023-2028
- 9.12 Market opportunity By Geographical Landscape
10 Drivers, Challenges, and Trends
- 10.1 Market drivers
- 10.2 Market challenges
- 10.3 Impact of drivers and challenges
- 10.4 Market trends
11 Vendor Landscape
- 11.1 Overview
- 11.2 Vendor landscape
- 11.3 Landscape disruption
- 11.4 Industry risks
12 Vendor Analysis
- 12.1 Vendors covered
- 12.2 Market positioning of vendors
- 12.3 Active Motif Inc.
- 12.4 Agilent Technologies Inc.
- 12.5 Becton Dickinson and Company
- 12.6 Bio Rad Laboratories Inc.
- 12.7 Cell Signaling Technology Inc.
- 12.8 Danaher Corp.
- 12.9 GenScript Biotech Corp.
- 12.10 JSR Micro Inc.
- 12.11 Merck KGaA
- 12.12 OriGene Technologies Inc.
- 12.13 PerkinElmer Inc
- 12.14 Proteintech Group Inc.
- 12.15 Rockland Immunochemicals Inc.
- 12.16 Santa Cruz Biotechnology Inc.
- 12.17 Thermo Fisher Scientific Inc.
13 Appendix
- 13.1 Scope of the report
- 13.2 Inclusions and exclusions checklist
- 13.3 Currency conversion rates for US$
- 13.4 Research methodology
- 13.5 List of abbreviations

