|
|
市場調査レポート
商品コード
1456822
浮体式生産貯蔵積出設備の世界市場 2024-2028Global Floating Production Storage and Offloading Market 2024-2028 |
||||||

|
|||||||
カスタマイズ可能
|
|||||||


| 浮体式生産貯蔵積出設備の世界市場 2024-2028 |
|
出版日: 2024年02月27日
発行: TechNavio
ページ情報: 英文 156 Pages
納期: 即納可能
|

全表示
- 概要
- 図表
- 目次
浮体式生産貯蔵積出設備市場は2023-2028年に85億8,000万米ドル、予測期間中のCAGRは6.34%で成長すると予測されます。
当レポートでは、浮体式生産貯蔵積出市場の全体的な分析、市場規模・予測、動向、成長促進要因・課題、約25のベンダーを網羅したベンダー分析などを掲載しています。
現在の市場シナリオ、最新動向と促進要因、市場環境全体に関する最新分析を提供しています。オフショア上流活動への投資の増加、エネルギー需要の高まり、牽引式浮体式生産貯蔵積出設備の需要拡大が市場を牽引しています。
| 市場範囲 | |
|---|---|
| 基準年 | 2024 |
| 終了年 | 2028 |
| 予測期間 | 2024-2028 |
| 成長モメンタム | 加速 |
| 前年比2024年 | 5.56% |
| CAGR | 6.34% |
| 増分額 | 85億8,000万米ドル |
本調査では、深海および超深海プロジェクトの増加が、今後数年間の浮体式生産貯蔵積出設備市場成長を牽引する主な要因の1つであるとしています。また、浮体式生産貯蔵積出設備の技術進歩や非在来型石油・ガス資源からの生産へのシフトは、市場の大きな需要につながります。
目次
第1章 エグゼクティブサマリー
- 市場概要
第2章 市場情勢
- 市場エコシステム
第3章 市場規模の評価
- 市場の定義
- 市場セグメント分析
- 市場規模 2023
- 市場の見通し 2023-2028
第4章 市場規模実績
- 浮体式生産貯蔵積出設備の世界市場 2018-2022
- タイプ別セグメント分析 2018-2022
- 製品別タイプセグメント分析 2018-2022
- 地域別セグメント分析 2018-2022
- 国別セグメント分析 2018-2022
第5章 ファイブフォース分析
- ファイブフォースの要約
- 買い手の交渉力
- 供給企業の交渉力
- 新規参入業者の脅威
- 代替品の脅威
- 競争の脅威
- 市況
第6章 市場セグメンテーション:タイプ別
- 市場セグメント
- 比較:タイプ別
- シングル:市場規模と予測 2023-2028
- ダブル:市場規模と予測 2023-2028
- 市場機会:タイプ別
第7章 市場セグメンテーション:製品タイプ別
- 市場セグメント
- 比較:製品タイプ別
- 改築:市場規模と予測 2023-2028
- 新築:市場規模と予測 2023-2028
- 市場機会:製品タイプ別
第8章 顧客情勢
- 顧客情勢の概要
第9章 地域別情勢
- 地域別セグメンテーション
- 地域別比較
- 南米:市場規模と予測 2023-2028
- 中東・アフリカ:市場規模と予測 2023-2028
- アジア太平洋:市場規模と予測 2023-2028
- 欧州:市場規模と予測 2023-2028
- 北米:市場規模と予測 2023-2028
- ブラジル:市場規模と予測 2023-2028
- 英国:市場規模と予測 2023-2028
- アンゴラ:市場規模と予測 2023-2028
- ナイジェリア:市場規模と予測 2023-2028
- 中国:市場規模と予測 2023-2028
- 市場機会:地域情勢別
第10章 促進要因、課題、および動向
- 市場促進要因
- 市場の課題
- 促進要因と課題の影響
- 市場動向
第11章 ベンダー情勢
- 概要
- ベンダー情勢
- 混乱の状況
- 業界のリスク
第12章 ベンダー分析
- 対象ベンダー
- ベンダーの市場ポジショニング
- BUMI ARMADA BERHAD
- Bluewater Energy Services BV
- BP Plc
- BW Offshore Ltd.
- Chevron Corp.
- Exxon Mobil Corp.
- Mitsubishi Heavy Industries Ltd.
- MODEC Inc.
- Petroleo Brasileiro SA
- SBM Offshore NV
- Shell plc
- TechnipFMC plc
- TotalEnergies SE
- Woodside Energy Group Ltd.
- Yinson Holdings Berhad
第13章 付録
Exhibits:
- Exhibits1: Executive Summary - Chart on Market Overview
- Exhibits2: Executive Summary - Data Table on Market Overview
- Exhibits3: Executive Summary - Chart on Global Market Characteristics
- Exhibits4: Executive Summary - Chart on Market By Geographical Landscape
- Exhibits5: Executive Summary - Chart on Market Segmentation by Type
- Exhibits6: Executive Summary - Chart on Market Segmentation by Product Type
- Exhibits7: Executive Summary - Chart on Incremental Growth
- Exhibits8: Executive Summary - Data Table on Incremental Growth
- Exhibits9: Executive Summary - Chart on Vendor Market Positioning
- Exhibits10: Parent market
- Exhibits11: Market Characteristics
- Exhibits12: Offerings of vendors included in the market definition
- Exhibits13: Market segments
- Exhibits14: Chart on Global - Market size and forecast 2023-2028 ($ billion)
- Exhibits15: Data Table on Global - Market size and forecast 2023-2028 ($ billion)
- Exhibits16: Chart on Global Market: Year-over-year growth 2023-2028 (%)
- Exhibits17: Data Table on Global Market: Year-over-year growth 2023-2028 (%)
- Exhibits18: Historic Market Size - Data Table on global floating production storage and offloading market 2018 - 2022 ($ billion)
- Exhibits19: Historic Market Size - Type Segment 2018 - 2022 ($ billion)
- Exhibits20: Historic Market Size - Product Type Segment 2018 - 2022 ($ billion)
- Exhibits21: Historic Market Size - Geography Segment 2018 - 2022 ($ billion)
- Exhibits22: Historic Market Size - Country Segment 2018 - 2022 ($ billion)
- Exhibits23: Five forces analysis - Comparison between 2023 and 2028
- Exhibits24: Chart on Bargaining power of buyers - Impact of key factors 2023 and 2028
- Exhibits25: Bargaining power of suppliers - Impact of key factors in 2023 and 2028
- Exhibits26: Threat of new entrants - Impact of key factors in 2023 and 2028
- Exhibits27: Threat of substitutes - Impact of key factors in 2023 and 2028
- Exhibits28: Threat of rivalry - Impact of key factors in 2023 and 2028
- Exhibits29: Chart on Market condition - Five forces 2023 and 2028
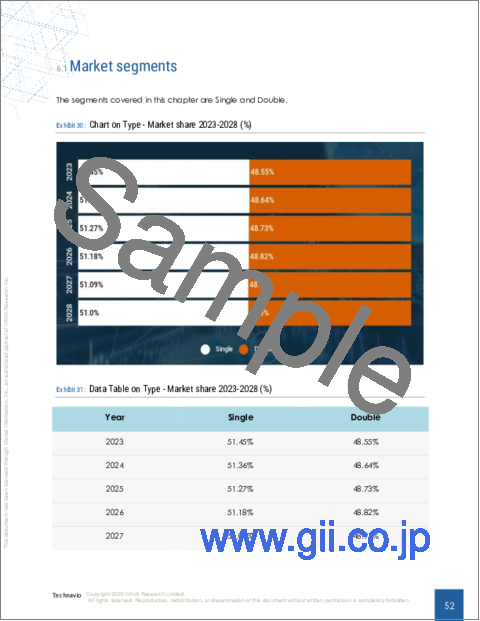
- Exhibits30: Chart on Type - Market share 2023-2028 (%)
- Exhibits31: Data Table on Type - Market share 2023-2028 (%)
- Exhibits32: Chart on Comparison by Type
- Exhibits33: Data Table on Comparison by Type
- Exhibits34: Chart on Single - Market size and forecast 2023-2028 ($ billion)
- Exhibits35: Data Table on Single - Market size and forecast 2023-2028 ($ billion)
- Exhibits36: Chart on Single - Year-over-year growth 2023-2028 (%)
- Exhibits37: Data Table on Single - Year-over-year growth 2023-2028 (%)
- Exhibits38: Chart on Double - Market size and forecast 2023-2028 ($ billion)
- Exhibits39: Data Table on Double - Market size and forecast 2023-2028 ($ billion)
- Exhibits40: Chart on Double - Year-over-year growth 2023-2028 (%)
- Exhibits41: Data Table on Double - Year-over-year growth 2023-2028 (%)
- Exhibits42: Market opportunity by Type ($ billion)
- Exhibits43: Data Table on Market opportunity by Type ($ billion)
- Exhibits44: Chart on Product Type - Market share 2023-2028 (%)
- Exhibits45: Data Table on Product Type - Market share 2023-2028 (%)
- Exhibits46: Chart on Comparison by Product Type
- Exhibits47: Data Table on Comparison by Product Type
- Exhibits48: Chart on Converted - Market size and forecast 2023-2028 ($ billion)
- Exhibits49: Data Table on Converted - Market size and forecast 2023-2028 ($ billion)
- Exhibits50: Chart on Converted - Year-over-year growth 2023-2028 (%)
- Exhibits51: Data Table on Converted - Year-over-year growth 2023-2028 (%)
- Exhibits52: Chart on Newly built - Market size and forecast 2023-2028 ($ billion)
- Exhibits53: Data Table on Newly built - Market size and forecast 2023-2028 ($ billion)
- Exhibits54: Chart on Newly built - Year-over-year growth 2023-2028 (%)
- Exhibits55: Data Table on Newly built - Year-over-year growth 2023-2028 (%)
- Exhibits56: Market opportunity by Product Type ($ billion)
- Exhibits57: Data Table on Market opportunity by Product Type ($ billion)
- Exhibits58: Analysis of price sensitivity, lifecycle, customer purchase basket, adoption rates, and purchase criteria
- Exhibits59: Chart on Market share By Geographical Landscape 2023-2028 (%)
- Exhibits60: Data Table on Market share By Geographical Landscape 2023-2028 (%)
- Exhibits61: Chart on Geographic comparison
- Exhibits62: Data Table on Geographic comparison
- Exhibits63: Chart on South America - Market size and forecast 2023-2028 ($ billion)
- Exhibits64: Data Table on South America - Market size and forecast 2023-2028 ($ billion)
- Exhibits65: Chart on South America - Year-over-year growth 2023-2028 (%)
- Exhibits66: Data Table on South America - Year-over-year growth 2023-2028 (%)
- Exhibits67: Chart on Middle East and Africa - Market size and forecast 2023-2028 ($ billion)
- Exhibits68: Data Table on Middle East and Africa - Market size and forecast 2023-2028 ($ billion)
- Exhibits69: Chart on Middle East and Africa - Year-over-year growth 2023-2028 (%)
- Exhibits70: Data Table on Middle East and Africa - Year-over-year growth 2023-2028 (%)
- Exhibits71: Chart on APAC - Market size and forecast 2023-2028 ($ billion)
- Exhibits72: Data Table on APAC - Market size and forecast 2023-2028 ($ billion)
- Exhibits73: Chart on APAC - Year-over-year growth 2023-2028 (%)
- Exhibits74: Data Table on APAC - Year-over-year growth 2023-2028 (%)
- Exhibits75: Chart on Europe - Market size and forecast 2023-2028 ($ billion)
- Exhibits76: Data Table on Europe - Market size and forecast 2023-2028 ($ billion)
- Exhibits77: Chart on Europe - Year-over-year growth 2023-2028 (%)
- Exhibits78: Data Table on Europe - Year-over-year growth 2023-2028 (%)
- Exhibits79: Chart on North America - Market size and forecast 2023-2028 ($ billion)
- Exhibits80: Data Table on North America - Market size and forecast 2023-2028 ($ billion)
- Exhibits81: Chart on North America - Year-over-year growth 2023-2028 (%)
- Exhibits82: Data Table on North America - Year-over-year growth 2023-2028 (%)
- Exhibits83: Chart on Brazil - Market size and forecast 2023-2028 ($ billion)
- Exhibits84: Data Table on Brazil - Market size and forecast 2023-2028 ($ billion)
- Exhibits85: Chart on Brazil - Year-over-year growth 2023-2028 (%)
- Exhibits86: Data Table on Brazil - Year-over-year growth 2023-2028 (%)
- Exhibits87: Chart on UK - Market size and forecast 2023-2028 ($ billion)
- Exhibits88: Data Table on UK - Market size and forecast 2023-2028 ($ billion)
- Exhibits89: Chart on UK - Year-over-year growth 2023-2028 (%)
- Exhibits90: Data Table on UK - Year-over-year growth 2023-2028 (%)
- Exhibits91: Chart on Angola - Market size and forecast 2023-2028 ($ billion)
- Exhibits92: Data Table on Angola - Market size and forecast 2023-2028 ($ billion)
- Exhibits93: Chart on Angola - Year-over-year growth 2023-2028 (%)
- Exhibits94: Data Table on Angola - Year-over-year growth 2023-2028 (%)
- Exhibits95: Chart on Nigeria - Market size and forecast 2023-2028 ($ billion)
- Exhibits96: Data Table on Nigeria - Market size and forecast 2023-2028 ($ billion)
- Exhibits97: Chart on Nigeria - Year-over-year growth 2023-2028 (%)
- Exhibits98: Data Table on Nigeria - Year-over-year growth 2023-2028 (%)
- Exhibits99: Chart on China - Market size and forecast 2023-2028 ($ billion)
- Exhibits100: Data Table on China - Market size and forecast 2023-2028 ($ billion)
- Exhibits101: Chart on China - Year-over-year growth 2023-2028 (%)
- Exhibits102: Data Table on China - Year-over-year growth 2023-2028 (%)
- Exhibits103: Market opportunity By Geographical Landscape ($ billion)
- Exhibits104: Data Tables on Market opportunity By Geographical Landscape ($ billion)
- Exhibits105: Impact of drivers and challenges in 2023 and 2028
- Exhibits106: Overview on Criticality of inputs and Factors of differentiation
- Exhibits107: Overview on factors of disruption
- Exhibits108: Impact of key risks on business
- Exhibits109: Vendors covered
- Exhibits110: Matrix on vendor position and classification
- Exhibits111: BUMI ARMADA BERHAD - Overview
- Exhibits112: BUMI ARMADA BERHAD - Business segments
- Exhibits113: BUMI ARMADA BERHAD - Key offerings
- Exhibits114: BUMI ARMADA BERHAD - Segment focus
- Exhibits115: Bluewater Energy Services BV - Overview
- Exhibits116: Bluewater Energy Services BV - Product / Service
- Exhibits117: Bluewater Energy Services BV - Key offerings
- Exhibits118: BP Plc - Overview
- Exhibits119: BP Plc - Business segments
- Exhibits120: BP Plc - Key news
- Exhibits121: BP Plc - Key offerings
- Exhibits122: BP Plc - Segment focus
- Exhibits123: BW Offshore Ltd. - Overview
- Exhibits124: BW Offshore Ltd. - Business segments
- Exhibits125: BW Offshore Ltd. - Key offerings
- Exhibits126: BW Offshore Ltd. - Segment focus
- Exhibits127: Chevron Corp. - Overview
- Exhibits128: Chevron Corp. - Business segments
- Exhibits129: Chevron Corp. - Key news
- Exhibits130: Chevron Corp. - Key offerings
- Exhibits131: Chevron Corp. - Segment focus
- Exhibits132: Exxon Mobil Corp. - Overview
- Exhibits133: Exxon Mobil Corp. - Business segments
- Exhibits134: Exxon Mobil Corp. - Key news
- Exhibits135: Exxon Mobil Corp. - Key offerings
- Exhibits136: Exxon Mobil Corp. - Segment focus
- Exhibits137: Mitsubishi Heavy Industries Ltd. - Overview
- Exhibits138: Mitsubishi Heavy Industries Ltd. - Business segments
- Exhibits139: Mitsubishi Heavy Industries Ltd. - Key news
- Exhibits140: Mitsubishi Heavy Industries Ltd. - Key offerings
- Exhibits141: Mitsubishi Heavy Industries Ltd. - Segment focus
- Exhibits142: MODEC Inc. - Overview
- Exhibits143: MODEC Inc. - Product / Service
- Exhibits144: MODEC Inc. - Key offerings
- Exhibits145: Petroleo Brasileiro SA - Overview
- Exhibits146: Petroleo Brasileiro SA - Business segments
- Exhibits147: Petroleo Brasileiro SA - Key offerings
- Exhibits148: Petroleo Brasileiro SA - Segment focus
- Exhibits149: SBM Offshore NV - Overview
- Exhibits150: SBM Offshore NV - Business segments
- Exhibits151: SBM Offshore NV - Key offerings
- Exhibits152: SBM Offshore NV - Segment focus
- Exhibits153: Shell plc - Overview
- Exhibits154: Shell plc - Business segments
- Exhibits155: Shell plc - Key offerings
- Exhibits156: Shell plc - Segment focus
- Exhibits157: TechnipFMC plc - Overview
- Exhibits158: TechnipFMC plc - Business segments
- Exhibits159: TechnipFMC plc - Key news
- Exhibits160: TechnipFMC plc - Key offerings
- Exhibits161: TechnipFMC plc - Segment focus
- Exhibits162: TotalEnergies SE - Overview
- Exhibits163: TotalEnergies SE - Business segments
- Exhibits164: TotalEnergies SE - Key news
- Exhibits165: TotalEnergies SE - Key offerings
- Exhibits166: TotalEnergies SE - Segment focus
- Exhibits167: Woodside Energy Group Ltd. - Overview
- Exhibits168: Woodside Energy Group Ltd. - Key offerings
- Exhibits169: Yinson Holdings Berhad - Overview
- Exhibits170: Yinson Holdings Berhad - Business segments
- Exhibits171: Yinson Holdings Berhad - Key offerings
- Exhibits172: Yinson Holdings Berhad - Segment focus
- Exhibits173: Inclusions checklist
- Exhibits174: Exclusions checklist
- Exhibits175: Currency conversion rates for US$
- Exhibits176: Research methodology
- Exhibits177: Validation techniques employed for market sizing
- Exhibits178: Information sources
- Exhibits179: List of abbreviations
The floating production storage and offloading market is forecasted to grow by USD 8.58 bn during 2023-2028, accelerating at a CAGR of 6.34% during the forecast period. The report on the floating production storage and the offloading market provides a holistic analysis, market size and forecast, trends, growth drivers, and challenges, as well as vendor analysis covering around 25 vendors.
The report offers an up-to-date analysis regarding the current market scenario, the latest trends and drivers, and the overall market environment. The market is driven by increasing investments in offshore E and P activities, rising demand for energy, and growing demand for towed floating production storage and offloading.
Technavio's floating production storage and offloading market is segmented as below:
| Market Scope | |
|---|---|
| Base Year | 2024 |
| End Year | 2028 |
| Series Year | 2024-2028 |
| Growth Momentum | Accelerate |
| YOY 2024 | 5.56% |
| CAGR | 6.34% |
| Incremental Value | $8.58bn |
By Type
- Single
- Double
By Product Type
- Converted
- Newly built
By Geographical Landscape
- South America
- Middle East and Africa
- APAC
- Europe
- North America
This study identifies the increase in deepwater and ultra-deepwater projects as one of the prime reasons driving the floating production storage and offloading market growth during the next few years. Also, technological advances in floating production storage and offloading and a shift toward production from unconventional oil and gas resources will lead to sizable demand in the market.
The report on the floating production storage and offloading market covers the following areas:
- Floating production storage and offloading market sizing
- Floating production storage and offloading market forecast
- Floating production storage and offloading market industry analysis
The robust vendor analysis is designed to help clients improve their market position, and in line with this, this report provides a detailed analysis of several leading floating production storage and offloading market vendors that include BUMI ARMADA BERHAD, Bluewater Energy Services BV, BP Plc, BW Offshore Ltd., Chevron Corp., China National Offshore Oil Corp., Exxon Mobil Corp., Hyundai Heavy Industries Co. Ltd., Mitsubishi Heavy Industries Ltd., MODEC Inc., Petroleo Brasileiro SA, Saipem S.p.A., SBM Offshore NV, Shell plc, TechnipFMC plc, TotalEnergies SE, Vietnam Oil and Gas Group, Woodside Energy Group Ltd., and Yinson Holdings Berhad. Also, the floating production storage and offloading market analysis report includes information on upcoming trends and challenges that will influence market growth. This is to help companies strategize and leverage all forthcoming growth opportunities.
The study was conducted using an objective combination of primary and secondary information including inputs from key participants in the industry. The report contains a comprehensive market and vendor landscape in addition to an analysis of the key vendors.
The publisher presents a detailed picture of the market by way of study, synthesis, and summation of data from multiple sources through an analysis of key parameters such as profit, pricing, competition, and promotions. It presents various market facets by identifying the key industry influencers. The data presented is comprehensive, reliable, and a result of extensive research - both primary and secondary. The market research reports provide a complete competitive landscape and an in-depth vendor selection methodology and analysis using qualitative and quantitative research to forecast accurate market growth.
Table of Contents
1 Executive Summary
- 1.1 Market overview
2 Market Landscape
- 2.1 Market ecosystem
3 Market Sizing
- 3.1 Market definition
- 3.2 Market segment analysis
- 3.3 Market size 2023
- 3.4 Market outlook: Forecast for 2023-2028
4 Historic Market Size
- 4.1 Global floating production storage and offloading market 2018 - 2022
- 4.2 Type Segment Analysis 2018 - 2022
- 4.3 Product Type Segment Analysis 2018 - 2022
- 4.4 Geography Segment Analysis 2018 - 2022
- 4.5 Country Segment Analysis 2018 - 2022
5 Five Forces Analysis
- 5.1 Five forces summary
- 5.2 Bargaining power of buyers
- 5.3 Bargaining power of suppliers
- 5.4 Threat of new entrants
- 5.5 Threat of substitutes
- 5.6 Threat of rivalry
- 5.7 Market condition
6 Market Segmentation by Type
- 6.1 Market segments
- 6.2 Comparison by Type
- 6.3 Single - Market size and forecast 2023-2028
- 6.4 Double - Market size and forecast 2023-2028
- 6.5 Market opportunity by Type
7 Market Segmentation by Product Type
- 7.1 Market segments
- 7.2 Comparison by Product Type
- 7.3 Converted - Market size and forecast 2023-2028
- 7.4 Newly built - Market size and forecast 2023-2028
- 7.5 Market opportunity by Product Type
8 Customer Landscape
- 8.1 Customer landscape overview
9 Geographic Landscape
- 9.1 Geographic segmentation
- 9.2 Geographic comparison
- 9.3 South America - Market size and forecast 2023-2028
- 9.4 Middle East and Africa - Market size and forecast 2023-2028
- 9.5 APAC - Market size and forecast 2023-2028
- 9.6 Europe - Market size and forecast 2023-2028
- 9.7 North America - Market size and forecast 2023-2028
- 9.8 Brazil - Market size and forecast 2023-2028
- 9.9 UK - Market size and forecast 2023-2028
- 9.10 Angola - Market size and forecast 2023-2028
- 9.11 Nigeria - Market size and forecast 2023-2028
- 9.12 China - Market size and forecast 2023-2028
- 9.13 Market opportunity By Geographical Landscape
10 Drivers, Challenges, and Trends
- 10.1 Market drivers
- 10.2 Market challenges
- 10.3 Impact of drivers and challenges
- 10.4 Market trends
11 Vendor Landscape
- 11.1 Overview
- 11.2 Vendor landscape
- 11.3 Landscape disruption
- 11.4 Industry risks
12 Vendor Analysis
- 12.1 Vendors covered
- 12.2 Market positioning of vendors
- 12.3 BUMI ARMADA BERHAD
- 12.4 Bluewater Energy Services BV
- 12.5 BP Plc
- 12.6 BW Offshore Ltd.
- 12.7 Chevron Corp.
- 12.8 Exxon Mobil Corp.
- 12.9 Mitsubishi Heavy Industries Ltd.
- 12.10 MODEC Inc.
- 12.11 Petroleo Brasileiro SA
- 12.12 SBM Offshore NV
- 12.13 Shell plc
- 12.14 TechnipFMC plc
- 12.15 TotalEnergies SE
- 12.16 Woodside Energy Group Ltd.
- 12.17 Yinson Holdings Berhad
13 Appendix
- 13.1 Scope of the report
- 13.2 Inclusions and exclusions checklist
- 13.3 Currency conversion rates for US$
- 13.4 Research methodology
- 13.5 List of abbreviations

