|
|
市場調査レポート
商品コード
1456801
家庭用血圧監視装置の世界市場 2024-2028Global Home Blood Pressure Monitoring Devices Market 2024-2028 |
||||||
|
|||||||
カスタマイズ可能
|
|||||||


| 家庭用血圧監視装置の世界市場 2024-2028 |
|
出版日: 2024年03月14日
発行: TechNavio
ページ情報: 英文 167 Pages
納期: 即納可能
|

全表示
- 概要
- 図表
- 目次
家庭用血圧監視装置市場は2023-2028年に7億8,703万米ドル、予測期間中のCAGRは6.76%で成長すると予測されます。
当レポートでは、家庭用血圧監視装置市場の全体的な分析、市場規模・予測、動向、成長促進要因、課題、約25のベンダーを網羅したベンダー分析などを掲載しています。
現在の市場シナリオ、最新動向と促進要因、市場環境全体に関する最新分析を提供しています。同市場は、家庭用デジタル血圧測定器に対する需要の高まり、高血圧の罹患率の増加、高齢化人口の増加によって牽引されています。
| 市場範囲 | |
|---|---|
| 基準年 | 2024 |
| 終了年 | 2028 |
| 予測期間 | 2024-2028 |
| 成長モメンタム | 加速 |
| 前年比2024年 | 5.8% |
| CAGR | 6.76% |
| 増分額 | 7億8,703万米ドル |
本調査では、家庭用血圧監視装置の技術進歩が今後数年間の家庭用血圧監視装置市場成長を牽引する主要因の1つであると分析しています。また、ウェアラブル家庭用血圧監視装置の人気の高まり、スマートフォンアプリとの統合、家庭用血圧監視装置の新製品発売は、市場の大きな需要につながります。
目次
第1章 エグゼクティブサマリー
- 市場概要
第2章 市場情勢
- 市場エコシステム
第3章 市場規模
- 市場の定義
- 市場セグメント分析
- 市場規模 2023
- 市場の見通し 2023-2028
第4章 市場規模実績
- 家庭用血圧監視装置の世界市場 2018-2022
- 流通チャネルセグメント分析 2018-2022
- タイプセグメント分析 2018-2022
- 地域別セグメント分析 2018-2022
- 国別セグメント分析 2018-2022
第5章 ファイブフォース分析
- ファイブフォースの要約
- 買い手の交渉力
- 供給企業の交渉力
- 新規参入業者の脅威
- 代替品の脅威
- 競争の脅威
- 市況
第6章 市場セグメンテーション:流通チャネル別
- 市場セグメント
- 比較:流通チャネル別
- オフライン:市場規模と予測 2023-2028
- オンライン:市場規模と予測 2023-2028
- 市場機会:流通チャネル別
第7章 市場セグメンテーション:タイプ別
- 市場セグメント
- 比較:タイプ別
- 上腕:市場規模と予測 2023-2028
- 手首:市場規模と予測 2023-2028
- 指:市場規模と予測 2023-2028
- 市場機会:タイプ別
第8章 顧客情勢
- 顧客情勢の概要
第9章 地域別情勢
- 地域別セグメンテーション
- 地域別比較
- アジア:市場規模と予測 2023-2028
- 北米:市場規模と予測 2023-2028
- 欧州:市場規模と予測 2023-2028
- 世界のその他の地域:市場規模と予測 2023-2028
- 米国:市場規模と予測 2023-2028
- 中国:市場規模と予測 2023-2028
- 日本:市場規模と予測 2023-2028
- インド:市場規模と予測 2023-2028
- ドイツ:市場規模と予測 2023-2028
- 市場機会:地域情勢別
第10章 促進要因、課題、および動向
- 市場促進要因
- 市場の課題
- 促進要因と課題の影響
- 市場動向
第11章 ベンダー情勢
- 概要
- ベンダー情勢
- 混乱の状況
- 業界のリスク
第12章 ベンダー分析
- 対象ベンダー
- ベンダーの市場ポジショニング
- A and D HOLON Holdings Co. Ltd.
- American Diagnostic Corp.
- Baxter International Inc.
- Beurer GmbH
- Contec Medical Systems Co. Ltd.
- ForaCare Inc.
- Halma Plc
- Koninklijke Philips N.V.
- Morepen Laboratories Ltd.
- Nokia Corp.
- OMRON Corp.
- Qardio Inc.
- Rossmax International Ltd.
- Spengler Holtex Group
- Tianjin Jiuan Medical Electronics Co. Ltd.
第13章 付録
Exhibits:
- Exhibits1: Executive Summary - Chart on Market Overview
- Exhibits2: Executive Summary - Data Table on Market Overview
- Exhibits3: Executive Summary - Chart on Global Market Characteristics
- Exhibits4: Executive Summary - Chart on Market By Geographical Landscape
- Exhibits5: Executive Summary - Chart on Market Segmentation by Distribution Channel
- Exhibits6: Executive Summary - Chart on Market Segmentation by Type
- Exhibits7: Executive Summary - Chart on Incremental Growth
- Exhibits8: Executive Summary - Data Table on Incremental Growth
- Exhibits9: Executive Summary - Chart on Vendor Market Positioning
- Exhibits10: Parent market
- Exhibits11: Market Characteristics
- Exhibits12: Offerings of vendors included in the market definition
- Exhibits13: Market segments
- Exhibits14: Chart on Global - Market size and forecast 2023-2028 ($ million)
- Exhibits15: Data Table on Global - Market size and forecast 2023-2028 ($ million)
- Exhibits16: Chart on Global Market: Year-over-year growth 2023-2028 (%)
- Exhibits17: Data Table on Global Market: Year-over-year growth 2023-2028 (%)
- Exhibits18: Historic Market Size - Data Table on global home blood pressure monitoring devices market 2018 - 2022 ($ million)
- Exhibits19: Historic Market Size - Distribution Channel Segment 2018 - 2022 ($ million)
- Exhibits20: Historic Market Size - Type Segment 2018 - 2022 ($ million)
- Exhibits21: Historic Market Size - Geography Segment 2018 - 2022 ($ million)
- Exhibits22: Historic Market Size - Country Segment 2018 - 2022 ($ million)
- Exhibits23: Five forces analysis - Comparison between 2023 and 2028
- Exhibits24: Chart on Bargaining power of buyers - Impact of key factors 2023 and 2028
- Exhibits25: Bargaining power of suppliers - Impact of key factors in 2023 and 2028
- Exhibits26: Threat of new entrants - Impact of key factors in 2023 and 2028
- Exhibits27: Threat of substitutes - Impact of key factors in 2023 and 2028
- Exhibits28: Threat of rivalry - Impact of key factors in 2023 and 2028
- Exhibits29: Chart on Market condition - Five forces 2023 and 2028
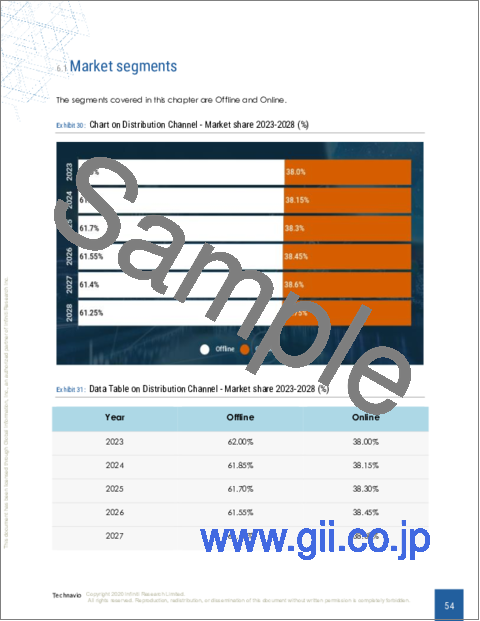
- Exhibits30: Chart on Distribution Channel - Market share 2023-2028 (%)
- Exhibits31: Data Table on Distribution Channel - Market share 2023-2028 (%)
- Exhibits32: Chart on Comparison by Distribution Channel
- Exhibits33: Data Table on Comparison by Distribution Channel
- Exhibits34: Chart on Offline - Market size and forecast 2023-2028 ($ million)
- Exhibits35: Data Table on Offline - Market size and forecast 2023-2028 ($ million)
- Exhibits36: Chart on Offline - Year-over-year growth 2023-2028 (%)
- Exhibits37: Data Table on Offline - Year-over-year growth 2023-2028 (%)
- Exhibits38: Chart on Online - Market size and forecast 2023-2028 ($ million)
- Exhibits39: Data Table on Online - Market size and forecast 2023-2028 ($ million)
- Exhibits40: Chart on Online - Year-over-year growth 2023-2028 (%)
- Exhibits41: Data Table on Online - Year-over-year growth 2023-2028 (%)
- Exhibits42: Market opportunity by Distribution Channel ($ million)
- Exhibits43: Data Table on Market opportunity by Distribution Channel ($ million)
- Exhibits44: Chart on Type - Market share 2023-2028 (%)
- Exhibits45: Data Table on Type - Market share 2023-2028 (%)
- Exhibits46: Chart on Comparison by Type
- Exhibits47: Data Table on Comparison by Type
- Exhibits48: Chart on Upper arm - Market size and forecast 2023-2028 ($ million)
- Exhibits49: Data Table on Upper arm - Market size and forecast 2023-2028 ($ million)
- Exhibits50: Chart on Upper arm - Year-over-year growth 2023-2028 (%)
- Exhibits51: Data Table on Upper arm - Year-over-year growth 2023-2028 (%)
- Exhibits52: Chart on Wrist - Market size and forecast 2023-2028 ($ million)
- Exhibits53: Data Table on Wrist - Market size and forecast 2023-2028 ($ million)
- Exhibits54: Chart on Wrist - Year-over-year growth 2023-2028 (%)
- Exhibits55: Data Table on Wrist - Year-over-year growth 2023-2028 (%)
- Exhibits56: Chart on Finger - Market size and forecast 2023-2028 ($ million)
- Exhibits57: Data Table on Finger - Market size and forecast 2023-2028 ($ million)
- Exhibits58: Chart on Finger - Year-over-year growth 2023-2028 (%)
- Exhibits59: Data Table on Finger - Year-over-year growth 2023-2028 (%)
- Exhibits60: Market opportunity by Type ($ million)
- Exhibits61: Data Table on Market opportunity by Type ($ million)
- Exhibits62: Analysis of price sensitivity, lifecycle, customer purchase basket, adoption rates, and purchase criteria
- Exhibits63: Chart on Market share By Geographical Landscape 2023-2028 (%)
- Exhibits64: Data Table on Market share By Geographical Landscape 2023-2028 (%)
- Exhibits65: Chart on Geographic comparison
- Exhibits66: Data Table on Geographic comparison
- Exhibits67: Chart on Asia - Market size and forecast 2023-2028 ($ million)
- Exhibits68: Data Table on Asia - Market size and forecast 2023-2028 ($ million)
- Exhibits69: Chart on Asia - Year-over-year growth 2023-2028 (%)
- Exhibits70: Data Table on Asia - Year-over-year growth 2023-2028 (%)
- Exhibits71: Chart on North America - Market size and forecast 2023-2028 ($ million)
- Exhibits72: Data Table on North America - Market size and forecast 2023-2028 ($ million)
- Exhibits73: Chart on North America - Year-over-year growth 2023-2028 (%)
- Exhibits74: Data Table on North America - Year-over-year growth 2023-2028 (%)
- Exhibits75: Chart on Europe - Market size and forecast 2023-2028 ($ million)
- Exhibits76: Data Table on Europe - Market size and forecast 2023-2028 ($ million)
- Exhibits77: Chart on Europe - Year-over-year growth 2023-2028 (%)
- Exhibits78: Data Table on Europe - Year-over-year growth 2023-2028 (%)
- Exhibits79: Chart on Rest of World (ROW) - Market size and forecast 2023-2028 ($ million)
- Exhibits80: Data Table on Rest of World (ROW) - Market size and forecast 2023-2028 ($ million)
- Exhibits81: Chart on Rest of World (ROW) - Year-over-year growth 2023-2028 (%)
- Exhibits82: Data Table on Rest of World (ROW) - Year-over-year growth 2023-2028 (%)
- Exhibits83: Chart on US - Market size and forecast 2023-2028 ($ million)
- Exhibits84: Data Table on US - Market size and forecast 2023-2028 ($ million)
- Exhibits85: Chart on US - Year-over-year growth 2023-2028 (%)
- Exhibits86: Data Table on US - Year-over-year growth 2023-2028 (%)
- Exhibits87: Chart on China - Market size and forecast 2023-2028 ($ million)
- Exhibits88: Data Table on China - Market size and forecast 2023-2028 ($ million)
- Exhibits89: Chart on China - Year-over-year growth 2023-2028 (%)
- Exhibits90: Data Table on China - Year-over-year growth 2023-2028 (%)
- Exhibits91: Chart on Japan - Market size and forecast 2023-2028 ($ million)
- Exhibits92: Data Table on Japan - Market size and forecast 2023-2028 ($ million)
- Exhibits93: Chart on Japan - Year-over-year growth 2023-2028 (%)
- Exhibits94: Data Table on Japan - Year-over-year growth 2023-2028 (%)
- Exhibits95: Chart on India - Market size and forecast 2023-2028 ($ million)
- Exhibits96: Data Table on India - Market size and forecast 2023-2028 ($ million)
- Exhibits97: Chart on India - Year-over-year growth 2023-2028 (%)
- Exhibits98: Data Table on India - Year-over-year growth 2023-2028 (%)
- Exhibits99: Chart on Germany - Market size and forecast 2023-2028 ($ million)
- Exhibits100: Data Table on Germany - Market size and forecast 2023-2028 ($ million)
- Exhibits101: Chart on Germany - Year-over-year growth 2023-2028 (%)
- Exhibits102: Data Table on Germany - Year-over-year growth 2023-2028 (%)
- Exhibits103: Market opportunity By Geographical Landscape ($ million)
- Exhibits104: Data Tables on Market opportunity By Geographical Landscape ($ million)
- Exhibits105: Impact of drivers and challenges in 2023 and 2028
- Exhibits106: Overview on Criticality of inputs and Factors of differentiation
- Exhibits107: Overview on factors of disruption
- Exhibits108: Impact of key risks on business
- Exhibits109: Vendors covered
- Exhibits110: Matrix on vendor position and classification
- Exhibits111: A and D HOLON Holdings Co. Ltd. - Overview
- Exhibits112: A and D HOLON Holdings Co. Ltd. - Business segments
- Exhibits113: A and D HOLON Holdings Co. Ltd. - Key offerings
- Exhibits114: A and D HOLON Holdings Co. Ltd. - Segment focus
- Exhibits115: American Diagnostic Corp. - Overview
- Exhibits116: American Diagnostic Corp. - Product / Service
- Exhibits117: American Diagnostic Corp. - Key offerings
- Exhibits118: Baxter International Inc. - Overview
- Exhibits119: Baxter International Inc. - Business segments
- Exhibits120: Baxter International Inc. - Key news
- Exhibits121: Baxter International Inc. - Key offerings
- Exhibits122: Baxter International Inc. - Segment focus
- Exhibits123: Beurer GmbH - Overview
- Exhibits124: Beurer GmbH - Product / Service
- Exhibits125: Beurer GmbH - Key offerings
- Exhibits126: Contec Medical Systems Co. Ltd. - Overview
- Exhibits127: Contec Medical Systems Co. Ltd. - Product / Service
- Exhibits128: Contec Medical Systems Co. Ltd. - Key offerings
- Exhibits129: ForaCare Inc. - Overview
- Exhibits130: ForaCare Inc. - Product / Service
- Exhibits131: ForaCare Inc. - Key offerings
- Exhibits132: Halma Plc - Overview
- Exhibits133: Halma Plc - Business segments
- Exhibits134: Halma Plc - Key news
- Exhibits135: Halma Plc - Key offerings
- Exhibits136: Halma Plc - Segment focus
- Exhibits137: Koninklijke Philips N.V. - Overview
- Exhibits138: Koninklijke Philips N.V. - Business segments
- Exhibits139: Koninklijke Philips N.V. - Key news
- Exhibits140: Koninklijke Philips N.V. - Key offerings
- Exhibits141: Koninklijke Philips N.V. - Segment focus
- Exhibits142: Morepen Laboratories Ltd. - Overview
- Exhibits143: Morepen Laboratories Ltd. - Business segments
- Exhibits144: Morepen Laboratories Ltd. - Key offerings
- Exhibits145: Morepen Laboratories Ltd. - Segment focus
- Exhibits146: Nokia Corp. - Overview
- Exhibits147: Nokia Corp. - Business segments
- Exhibits148: Nokia Corp. - Key offerings
- Exhibits149: Nokia Corp. - Segment focus
- Exhibits150: OMRON Corp. - Overview
- Exhibits151: OMRON Corp. - Business segments
- Exhibits152: OMRON Corp. - Key news
- Exhibits153: OMRON Corp. - Key offerings
- Exhibits154: OMRON Corp. - Segment focus
- Exhibits155: Qardio Inc. - Overview
- Exhibits156: Qardio Inc. - Product / Service
- Exhibits157: Qardio Inc. - Key offerings
- Exhibits158: Rossmax International Ltd. - Overview
- Exhibits159: Rossmax International Ltd. - Product / Service
- Exhibits160: Rossmax International Ltd. - Key offerings
- Exhibits161: Spengler Holtex Group - Overview
- Exhibits162: Spengler Holtex Group - Product / Service
- Exhibits163: Spengler Holtex Group - Key offerings
- Exhibits164: Tianjin Jiuan Medical Electronics Co. Ltd. - Overview
- Exhibits165: Tianjin Jiuan Medical Electronics Co. Ltd. - Product / Service
- Exhibits166: Tianjin Jiuan Medical Electronics Co. Ltd. - Key offerings
- Exhibits167: Inclusions checklist
- Exhibits168: Exclusions checklist
- Exhibits169: Currency conversion rates for US$
- Exhibits170: Research methodology
- Exhibits171: Validation techniques employed for market sizing
- Exhibits172: Information sources
- Exhibits173: List of abbreviations
The home blood pressure monitoring devices market is forecasted to grow by USD 787.03 mn during 2023-2028, accelerating at a CAGR of 6.76% during the forecast period. The report on the home blood pressure monitoring devices market provides a holistic analysis, market size and forecast, trends, growth drivers, and challenges, as well as vendor analysis covering around 25 vendors.
The report offers an up-to-date analysis regarding the current market scenario, the latest trends and drivers, and the overall market environment. The market is driven by growing demand for home-based digital blood pressure monitoring devices, increasing incidence of hypertension, and increasing aging population.
Technavio's home blood pressure monitoring devices market is segmented as below:
| Market Scope | |
|---|---|
| Base Year | 2024 |
| End Year | 2028 |
| Series Year | 2024-2028 |
| Growth Momentum | Accelerate |
| YOY 2024 | 5.8% |
| CAGR | 6.76% |
| Incremental Value | $787.03mn |
By Distribution Channel
- Offline
- Online
By Type
- Upper arm
- Wrist
- Finger
By Geographical Landscape
- Asia
- North America
- Europe
- Rest of World (ROW)
This study identifies the technological advances in home blood pressure monitoring devices as one of the prime reasons driving the home blood pressure monitoring devices market growth during the next few years. Also, the growing popularity of wearable home blood pressure monitoring devices and integration with smartphone apps and new product launches of home blood pressure monitoring devices will lead to sizable demand in the market.
The report on the home blood pressure monitoring devices market covers the following areas:
- Home blood pressure monitoring devices market sizing
- Home blood pressure monitoring devices market forecast
- Home blood pressure monitoring devices market industry analysis
The robust vendor analysis is designed to help clients improve their market position, and in line with this, this report provides a detailed analysis of several leading home blood pressure monitoring devices market vendors that include A and D HOLON Holdings Co. Ltd., American Diagnostic Corp., Baxter International Inc., Beurer GmbH, Contec Medical Systems Co. Ltd., ForaCare Inc., HEINE Optotechnik GmbH and Co. KG, Koninklijke Philips N.V., Microlife Corp., Morepen Laboratories Ltd., Nokia Corp., OMRON Corp., Qardio Inc., Rossmax International Ltd., Spengler Holtex Group, Telli Health LLC, Tianjin Jiuan Medical Electronics Co. Ltd., Wellue Health, Zewa Inc., and Halma Plc. Also, the home blood pressure monitoring devices market analysis report includes information on upcoming trends and challenges that will influence market growth. This is to help companies strategize and leverage all forthcoming growth opportunities.
The study was conducted using an objective combination of primary and secondary information including inputs from key participants in the industry. The report contains a comprehensive market and vendor landscape in addition to an analysis of the key vendors.
The publisher presents a detailed picture of the market by way of study, synthesis, and summation of data from multiple sources through an analysis of key parameters such as profit, pricing, competition, and promotions. It presents various market facets by identifying the key industry influencers. The data presented is comprehensive, reliable, and a result of extensive research - both primary and secondary. The market research reports provide a complete competitive landscape and an in-depth vendor selection methodology and analysis using qualitative and quantitative research to forecast accurate market growth.
Table of Contents
1 Executive Summary
- 1.1 Market overview
2 Market Landscape
- 2.1 Market ecosystem
3 Market Sizing
- 3.1 Market definition
- 3.2 Market segment analysis
- 3.3 Market size 2023
- 3.4 Market outlook: Forecast for 2023-2028
4 Historic Market Size
- 4.1 Global home blood pressure monitoring devices market 2018 - 2022
- 4.2 Distribution Channel Segment Analysis 2018 - 2022
- 4.3 Type Segment Analysis 2018 - 2022
- 4.4 Geography Segment Analysis 2018 - 2022
- 4.5 Country Segment Analysis 2018 - 2022
5 Five Forces Analysis
- 5.1 Five forces summary
- 5.2 Bargaining power of buyers
- 5.3 Bargaining power of suppliers
- 5.4 Threat of new entrants
- 5.5 Threat of substitutes
- 5.6 Threat of rivalry
- 5.7 Market condition
6 Market Segmentation by Distribution Channel
- 6.1 Market segments
- 6.2 Comparison by Distribution Channel
- 6.3 Offline - Market size and forecast 2023-2028
- 6.4 Online - Market size and forecast 2023-2028
- 6.5 Market opportunity by Distribution Channel
7 Market Segmentation by Type
- 7.1 Market segments
- 7.2 Comparison by Type
- 7.3 Upper arm - Market size and forecast 2023-2028
- 7.4 Wrist - Market size and forecast 2023-2028
- 7.5 Finger - Market size and forecast 2023-2028
- 7.6 Market opportunity by Type
8 Customer Landscape
- 8.1 Customer landscape overview
9 Geographic Landscape
- 9.1 Geographic segmentation
- 9.2 Geographic comparison
- 9.3 Asia - Market size and forecast 2023-2028
- 9.4 North America - Market size and forecast 2023-2028
- 9.5 Europe - Market size and forecast 2023-2028
- 9.6 Rest of World (ROW) - Market size and forecast 2023-2028
- 9.7 US - Market size and forecast 2023-2028
- 9.8 China - Market size and forecast 2023-2028
- 9.9 Japan - Market size and forecast 2023-2028
- 9.10 India - Market size and forecast 2023-2028
- 9.11 Germany - Market size and forecast 2023-2028
- 9.12 Market opportunity By Geographical Landscape
10 Drivers, Challenges, and Trends
- 10.1 Market drivers
- 10.2 Market challenges
- 10.3 Impact of drivers and challenges
- 10.4 Market trends
11 Vendor Landscape
- 11.1 Overview
- 11.2 Vendor landscape
- 11.3 Landscape disruption
- 11.4 Industry risks
12 Vendor Analysis
- 12.1 Vendors covered
- 12.2 Market positioning of vendors
- 12.3 A and D HOLON Holdings Co. Ltd.
- 12.4 American Diagnostic Corp.
- 12.5 Baxter International Inc.
- 12.6 Beurer GmbH
- 12.7 Contec Medical Systems Co. Ltd.
- 12.8 ForaCare Inc.
- 12.9 Halma Plc
- 12.10 Koninklijke Philips N.V.
- 12.11 Morepen Laboratories Ltd.
- 12.12 Nokia Corp.
- 12.13 OMRON Corp.
- 12.14 Qardio Inc.
- 12.15 Rossmax International Ltd.
- 12.16 Spengler Holtex Group
- 12.17 Tianjin Jiuan Medical Electronics Co. Ltd.
13 Appendix
- 13.1 Scope of the report
- 13.2 Inclusions and exclusions checklist
- 13.3 Currency conversion rates for US$
- 13.4 Research methodology
- 13.5 List of abbreviations

