|
|
市場調査レポート
商品コード
1453851
ホウ素の世界市場 2024-2028Global Boron Market 2024-2028 |
||||||
|
|||||||
カスタマイズ可能
|
|||||||

| ホウ素の世界市場 2024-2028 |
|
出版日: 2024年03月08日
発行: TechNavio
ページ情報: 英文 161 Pages
納期: 即納可能
|

全表示
- 概要
- 図表
- 目次
ホウ素市場は2023-2028年に15億3,304万米ドル、予測期間中のCAGRは10.13%で成長すると予測されます。
当レポートでは、ホウ素市場の全体的な分析、市場規模・予測、動向、成長促進要因、課題、約25のベンダーを網羅したベンダー分析などを掲載しています。
現在の市場シナリオ、最新動向と促進要因、市場環境全体に関する最新分析を提供しています。新興諸国からの需要の増加、エネルギー効率の高い建物への需要の高まり、消費者の可処分所得の増加が市場を牽引しています。
| 市場範囲 | |
|---|---|
| 基準年 | 2024 |
| 終了年 | 2028 |
| 予測期間 | 2024-2028 |
| 成長モメンタム | 加速 |
| 前年比2024年 | 12.75% |
| CAGR | 10.13% |
| 増分額 | 15億3,304万米ドル |
本調査では、今後数年間のホウ素市場成長を牽引する主な要因として、再生可能エネルギー分野からの需要拡大を挙げています。また、農薬の国内使用の増加や世界の原子力発電能力の増加が、市場の大きな需要につながります。
目次
第1章 エグゼクティブサマリー
- 市場概要
第2章 市場情勢
- 市場エコシステム
第3章 市場規模
- 市場の定義
- 市場セグメント分析
- 市場規模 2023
- 市場の見通し 2023-2028
第4章 市場規模実績
- ホウ素の世界市場 2018-2022
- 用途別セグメント分析 2018-2022
- エンドユーザーセグメント分析 2018-2022
- 地域別セグメント分析 2018-2022
- 国別セグメント分析 2018-2022
第5章 ファイブフォース分析
- ファイブフォースの要約
- 買い手の交渉力
- 供給企業の交渉力
- 新規参入業者の脅威
- 代替品の脅威
- 競争の脅威
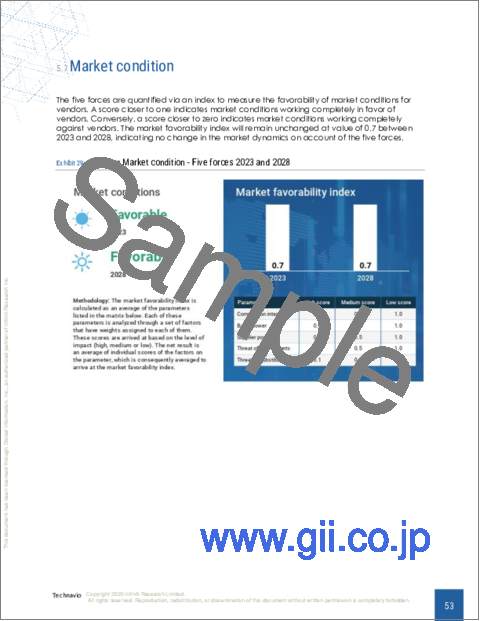
- 市況
第6章 市場セグメンテーション:用途別
- 市場セグメント
- 比較:用途別
- ガラス:市場規模と予測 2023-2028
- 肥料:市場規模と予測 2023-2028
- セラミックス:市場規模と予測 2023-2028
- 洗剤:市場規模と予測 2023-2028
- その他:市場規模と予測 2023-2028
- 市場機会:用途別
第7章 市場セグメンテーション:エンドユーザー別
- 市場セグメント
- 比較:エンドユーザー別
- 工事:市場規模と予測 2023-2028
- 農業:市場規模と予測 2023-2028
- パーソナルケア:市場規模と予測 2023-2028
- 自動車:市場規模と予測 2023-2028
- その他:市場規模と予測 2023-2028
- 市場機会:エンドユーザー別
第8章 顧客情勢
- 顧客情勢の概要
第9章 地域別情勢
- 地域別セグメンテーション
- 地域別比較
- アジア太平洋:市場規模と予測 2023-2028
- 北米:市場規模と予測 2023-2028
- 欧州:市場規模と予測 2023-2028
- 南米:市場規模と予測 2023-2028
- 中東・アフリカ:市場規模と予測 2023-2028
- 中国:市場規模と予測 2023-2028
- 米国:市場規模と予測 2023-2028
- インド:市場規模と予測 2023-2028
- 日本:市場規模と予測 2023-2028
- ドイツ:市場規模と予測 2023-2028
- 市場機会:地域情勢別
第10章 促進要因、課題、および動向
- 市場促進要因
- 市場の課題
- 促進要因と課題の影響
- 市場動向
第11章 ベンダー情勢
- 概要
- ベンダー情勢
- 混乱の状況
- 業界のリスク
第12章 ベンダー分析
- 対象ベンダー
- ベンダーの市場ポジショニング
- 3M Co.
- American Borate Co.
- Boron Specialties LLC
- Eti Maden isletmeleri Genel Mudurlugu
- Goodfellow Cambridge Ltd.
- Minera Santa Rita Srl
- Nanoshel LLC
- Orocobre Ltd.
- Quiborax
- Rio Tinto Ltd.
- Rose Mill Co.
- SB Boron Corp.
- SCL Italia Spa
- Stanford Advanced Materials
- Welvic Australia Pty Ltd.
第13章 付録
Exhibits:
- Exhibits1: Executive Summary - Chart on Market Overview
- Exhibits2: Executive Summary - Data Table on Market Overview
- Exhibits3: Executive Summary - Chart on Global Market Characteristics
- Exhibits4: Executive Summary - Chart on Market By Geographical Landscape
- Exhibits5: Executive Summary - Chart on Market Segmentation by Application
- Exhibits6: Executive Summary - Chart on Market Segmentation by End-user
- Exhibits7: Executive Summary - Chart on Incremental Growth
- Exhibits8: Executive Summary - Data Table on Incremental Growth
- Exhibits9: Executive Summary - Chart on Vendor Market Positioning
- Exhibits10: Parent market
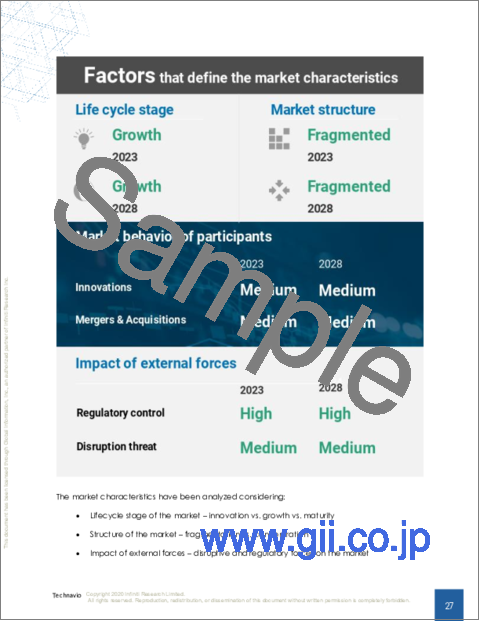
- Exhibits11: Market Characteristics
- Exhibits12: Offerings of vendors included in the market definition
- Exhibits13: Market segments
- Exhibits14: Chart on Global - Market size and forecast 2023-2028 ($ million)
- Exhibits15: Data Table on Global - Market size and forecast 2023-2028 ($ million)
- Exhibits16: Chart on Global Market: Year-over-year growth 2023-2028 (%)
- Exhibits17: Data Table on Global Market: Year-over-year growth 2023-2028 (%)
- Exhibits18: Historic Market Size - Data Table on global boron market 2018 - 2022 ($ million)
- Exhibits19: Historic Market Size - Application Segment 2018 - 2022 ($ million)
- Exhibits20: Historic Market Size - End-user Segment 2018 - 2022 ($ million)
- Exhibits21: Historic Market Size - Geography Segment 2018 - 2022 ($ million)
- Exhibits22: Historic Market Size - Country Segment 2018 - 2022 ($ million)
- Exhibits23: Five forces analysis - Comparison between 2023 and 2028
- Exhibits24: Chart on Bargaining power of buyers - Impact of key factors 2023 and 2028
- Exhibits25: Bargaining power of suppliers - Impact of key factors in 2023 and 2028
- Exhibits26: Threat of new entrants - Impact of key factors in 2023 and 2028
- Exhibits27: Threat of substitutes - Impact of key factors in 2023 and 2028
- Exhibits28: Threat of rivalry - Impact of key factors in 2023 and 2028
- Exhibits29: Chart on Market condition - Five forces 2023 and 2028
- Exhibits30: Chart on Application - Market share 2023-2028 (%)
- Exhibits31: Data Table on Application - Market share 2023-2028 (%)
- Exhibits32: Chart on Comparison by Application
- Exhibits33: Data Table on Comparison by Application
- Exhibits34: Chart on Glass - Market size and forecast 2023-2028 ($ million)
- Exhibits35: Data Table on Glass - Market size and forecast 2023-2028 ($ million)
- Exhibits36: Chart on Glass - Year-over-year growth 2023-2028 (%)
- Exhibits37: Data Table on Glass - Year-over-year growth 2023-2028 (%)
- Exhibits38: Chart on Fertilizers - Market size and forecast 2023-2028 ($ million)
- Exhibits39: Data Table on Fertilizers - Market size and forecast 2023-2028 ($ million)
- Exhibits40: Chart on Fertilizers - Year-over-year growth 2023-2028 (%)
- Exhibits41: Data Table on Fertilizers - Year-over-year growth 2023-2028 (%)
- Exhibits42: Chart on Ceramics - Market size and forecast 2023-2028 ($ million)
- Exhibits43: Data Table on Ceramics - Market size and forecast 2023-2028 ($ million)
- Exhibits44: Chart on Ceramics - Year-over-year growth 2023-2028 (%)
- Exhibits45: Data Table on Ceramics - Year-over-year growth 2023-2028 (%)
- Exhibits46: Chart on Detergents - Market size and forecast 2023-2028 ($ million)
- Exhibits47: Data Table on Detergents - Market size and forecast 2023-2028 ($ million)
- Exhibits48: Chart on Detergents - Year-over-year growth 2023-2028 (%)
- Exhibits49: Data Table on Detergents - Year-over-year growth 2023-2028 (%)
- Exhibits50: Chart on Others - Market size and forecast 2023-2028 ($ million)
- Exhibits51: Data Table on Others - Market size and forecast 2023-2028 ($ million)
- Exhibits52: Chart on Others - Year-over-year growth 2023-2028 (%)
- Exhibits53: Data Table on Others - Year-over-year growth 2023-2028 (%)
- Exhibits54: Market opportunity by Application ($ million)
- Exhibits55: Data Table on Market opportunity by Application ($ million)
- Exhibits56: Chart on End-user - Market share 2023-2028 (%)
- Exhibits57: Data Table on End-user - Market share 2023-2028 (%)
- Exhibits58: Chart on Comparison by End-user
- Exhibits59: Data Table on Comparison by End-user
- Exhibits60: Chart on Construction - Market size and forecast 2023-2028 ($ million)
- Exhibits61: Data Table on Construction - Market size and forecast 2023-2028 ($ million)
- Exhibits62: Chart on Construction - Year-over-year growth 2023-2028 (%)
- Exhibits63: Data Table on Construction - Year-over-year growth 2023-2028 (%)
- Exhibits64: Chart on Agriculture - Market size and forecast 2023-2028 ($ million)
- Exhibits65: Data Table on Agriculture - Market size and forecast 2023-2028 ($ million)
- Exhibits66: Chart on Agriculture - Year-over-year growth 2023-2028 (%)
- Exhibits67: Data Table on Agriculture - Year-over-year growth 2023-2028 (%)
- Exhibits68: Chart on Personal care - Market size and forecast 2023-2028 ($ million)
- Exhibits69: Data Table on Personal care - Market size and forecast 2023-2028 ($ million)
- Exhibits70: Chart on Personal care - Year-over-year growth 2023-2028 (%)
- Exhibits71: Data Table on Personal care - Year-over-year growth 2023-2028 (%)
- Exhibits72: Chart on Automotive - Market size and forecast 2023-2028 ($ million)
- Exhibits73: Data Table on Automotive - Market size and forecast 2023-2028 ($ million)
- Exhibits74: Chart on Automotive - Year-over-year growth 2023-2028 (%)
- Exhibits75: Data Table on Automotive - Year-over-year growth 2023-2028 (%)
- Exhibits76: Chart on Others - Market size and forecast 2023-2028 ($ million)
- Exhibits77: Data Table on Others - Market size and forecast 2023-2028 ($ million)
- Exhibits78: Chart on Others - Year-over-year growth 2023-2028 (%)
- Exhibits79: Data Table on Others - Year-over-year growth 2023-2028 (%)
- Exhibits80: Market opportunity by End-user ($ million)
- Exhibits81: Data Table on Market opportunity by End-user ($ million)
- Exhibits82: Analysis of price sensitivity, lifecycle, customer purchase basket, adoption rates, and purchase criteria
- Exhibits83: Chart on Market share By Geographical Landscape 2023-2028 (%)
- Exhibits84: Data Table on Market share By Geographical Landscape 2023-2028 (%)
- Exhibits85: Chart on Geographic comparison
- Exhibits86: Data Table on Geographic comparison
- Exhibits87: Chart on APAC - Market size and forecast 2023-2028 ($ million)
- Exhibits88: Data Table on APAC - Market size and forecast 2023-2028 ($ million)
- Exhibits89: Chart on APAC - Year-over-year growth 2023-2028 (%)
- Exhibits90: Data Table on APAC - Year-over-year growth 2023-2028 (%)
- Exhibits91: Chart on North America - Market size and forecast 2023-2028 ($ million)
- Exhibits92: Data Table on North America - Market size and forecast 2023-2028 ($ million)
- Exhibits93: Chart on North America - Year-over-year growth 2023-2028 (%)
- Exhibits94: Data Table on North America - Year-over-year growth 2023-2028 (%)
- Exhibits95: Chart on Europe - Market size and forecast 2023-2028 ($ million)
- Exhibits96: Data Table on Europe - Market size and forecast 2023-2028 ($ million)
- Exhibits97: Chart on Europe - Year-over-year growth 2023-2028 (%)
- Exhibits98: Data Table on Europe - Year-over-year growth 2023-2028 (%)
- Exhibits99: Chart on South America - Market size and forecast 2023-2028 ($ million)
- Exhibits100: Data Table on South America - Market size and forecast 2023-2028 ($ million)
- Exhibits101: Chart on South America - Year-over-year growth 2023-2028 (%)
- Exhibits102: Data Table on South America - Year-over-year growth 2023-2028 (%)
- Exhibits103: Chart on Middle East and Africa - Market size and forecast 2023-2028 ($ million)
- Exhibits104: Data Table on Middle East and Africa - Market size and forecast 2023-2028 ($ million)
- Exhibits105: Chart on Middle East and Africa - Year-over-year growth 2023-2028 (%)
- Exhibits106: Data Table on Middle East and Africa - Year-over-year growth 2023-2028 (%)
- Exhibits107: Chart on China - Market size and forecast 2023-2028 ($ million)
- Exhibits108: Data Table on China - Market size and forecast 2023-2028 ($ million)
- Exhibits109: Chart on China - Year-over-year growth 2023-2028 (%)
- Exhibits110: Data Table on China - Year-over-year growth 2023-2028 (%)
- Exhibits111: Chart on US - Market size and forecast 2023-2028 ($ million)
- Exhibits112: Data Table on US - Market size and forecast 2023-2028 ($ million)
- Exhibits113: Chart on US - Year-over-year growth 2023-2028 (%)
- Exhibits114: Data Table on US - Year-over-year growth 2023-2028 (%)
- Exhibits115: Chart on India - Market size and forecast 2023-2028 ($ million)
- Exhibits116: Data Table on India - Market size and forecast 2023-2028 ($ million)
- Exhibits117: Chart on India - Year-over-year growth 2023-2028 (%)
- Exhibits118: Data Table on India - Year-over-year growth 2023-2028 (%)
- Exhibits119: Chart on Japan - Market size and forecast 2023-2028 ($ million)
- Exhibits120: Data Table on Japan - Market size and forecast 2023-2028 ($ million)
- Exhibits121: Chart on Japan - Year-over-year growth 2023-2028 (%)
- Exhibits122: Data Table on Japan - Year-over-year growth 2023-2028 (%)
- Exhibits123: Chart on Germany - Market size and forecast 2023-2028 ($ million)
- Exhibits124: Data Table on Germany - Market size and forecast 2023-2028 ($ million)
- Exhibits125: Chart on Germany - Year-over-year growth 2023-2028 (%)
- Exhibits126: Data Table on Germany - Year-over-year growth 2023-2028 (%)
- Exhibits127: Market opportunity By Geographical Landscape ($ million)
- Exhibits128: Data Tables on Market opportunity By Geographical Landscape ($ million)
- Exhibits129: Impact of drivers and challenges in 2023 and 2028
- Exhibits130: Overview on Criticality of inputs and Factors of differentiation
- Exhibits131: Overview on factors of disruption
- Exhibits132: Impact of key risks on business
- Exhibits133: Vendors covered
- Exhibits134: Matrix on vendor position and classification
- Exhibits135: 3M Co. - Overview
- Exhibits136: 3M Co. - Business segments
- Exhibits137: 3M Co. - Key news
- Exhibits138: 3M Co. - Key offerings
- Exhibits139: 3M Co. - Segment focus
- Exhibits140: American Borate Co. - Overview
- Exhibits141: American Borate Co. - Product / Service
- Exhibits142: American Borate Co. - Key offerings
- Exhibits143: Boron Specialties LLC - Overview
- Exhibits144: Boron Specialties LLC - Product / Service
- Exhibits145: Boron Specialties LLC - Key offerings
- Exhibits146: Eti Maden isletmeleri Genel Mudurlugu - Overview
- Exhibits147: Eti Maden isletmeleri Genel Mudurlugu - Product / Service
- Exhibits148: Eti Maden isletmeleri Genel Mudurlugu - Key offerings
- Exhibits149: Goodfellow Cambridge Ltd. - Overview
- Exhibits150: Goodfellow Cambridge Ltd. - Product / Service
- Exhibits151: Goodfellow Cambridge Ltd. - Key offerings
- Exhibits152: Minera Santa Rita Srl - Overview
- Exhibits153: Minera Santa Rita Srl - Product / Service
- Exhibits154: Minera Santa Rita Srl - Key offerings
- Exhibits155: Nanoshel LLC - Overview
- Exhibits156: Nanoshel LLC - Product / Service
- Exhibits157: Nanoshel LLC - Key offerings
- Exhibits158: Orocobre Ltd. - Overview
- Exhibits159: Orocobre Ltd. - Business segments
- Exhibits160: Orocobre Ltd. - Key offerings
- Exhibits161: Orocobre Ltd. - Segment focus
- Exhibits162: Quiborax - Overview
- Exhibits163: Quiborax - Product / Service
- Exhibits164: Quiborax - Key offerings
- Exhibits165: Rio Tinto Ltd. - Overview
- Exhibits166: Rio Tinto Ltd. - Business segments
- Exhibits167: Rio Tinto Ltd. - Key news
- Exhibits168: Rio Tinto Ltd. - Key offerings
- Exhibits169: Rio Tinto Ltd. - Segment focus
- Exhibits170: Rose Mill Co. - Overview
- Exhibits171: Rose Mill Co. - Product / Service
- Exhibits172: Rose Mill Co. - Key offerings
- Exhibits173: SB Boron Corp. - Overview
- Exhibits174: SB Boron Corp. - Product / Service
- Exhibits175: SB Boron Corp. - Key offerings
- Exhibits176: SCL Italia Spa - Overview
- Exhibits177: SCL Italia Spa - Product / Service
- Exhibits178: SCL Italia Spa - Key offerings
- Exhibits179: Stanford Advanced Materials - Overview
- Exhibits180: Stanford Advanced Materials - Product / Service
- Exhibits181: Stanford Advanced Materials - Key offerings
- Exhibits182: Welvic Australia Pty Ltd. - Overview
- Exhibits183: Welvic Australia Pty Ltd. - Product / Service
- Exhibits184: Welvic Australia Pty Ltd. - Key offerings
- Exhibits185: Inclusions checklist
- Exhibits186: Exclusions checklist
- Exhibits187: Currency conversion rates for US$
- Exhibits188: Research methodology
- Exhibits189: Validation techniques employed for market sizing
- Exhibits190: Information sources
- Exhibits191: List of abbreviations
The boron market is forecasted to grow by USD 1533.04 mn during 2023-2028, accelerating at a CAGR of 10.13% during the forecast period. The report on the boron market provides a holistic analysis, market size and forecast, trends, growth drivers, and challenges, as well as vendor analysis covering around 25 vendors.
The report offers an up-to-date analysis regarding the current market scenario, the latest trends and drivers, and the overall market environment. The market is driven by increase in demand from developing countries, growing demand for energy-efficient buildings, and rise in consumer disposable income.
Technavio's boron market is segmented as below:
| Market Scope | |
|---|---|
| Base Year | 2024 |
| End Year | 2028 |
| Series Year | 2024-2028 |
| Growth Momentum | Accelerate |
| YOY 2024 | 12.75% |
| CAGR | 10.13% |
| Incremental Value | $1533.04mn |
By Application
- Glass
- Fertilizers
- Ceramics
- Detergents
- Others
By End-user
- Construction
- Agriculture
- Personal care
- Automotive
- Others
By Geographical Landscape
- APAC
- North America
- Europe
- South America
- Middle East and Africa
This study identifies the growing demand from renewable energy sector as one of the prime reasons driving the boron market growth during the next few years. Also, increasing domestic use of agrochemicals and increase in global nuclear power capacity will lead to sizable demand in the market.
The report on the boron market covers the following areas:
- Boron market sizing
- Boron market forecast
- Boron market industry analysis
The robust vendor analysis is designed to help clients improve their market position, and in line with this, this report provides a detailed analysis of several leading boron market vendors that include 3M Co., Alpha Chemika, American Borate Co., Boron Rubbers India, Boron Specialties LLC, Central Drug House P Ltd., Eti Maden isletmeleri Genel Mudurlugu, Goodfellow Cambridge Ltd., Minera Santa Rita Srl, MSE Supplies LLC, NANOGRAFI Co. Inc., Nanoshel LLC, Orocobre Ltd., Quiborax, Rose Mill Co., SB Boron Corp., SCL Italia Spa, Stanford Advanced Materials, Welvic Australia Pty Ltd., and Rio Tinto Ltd.. Also, the boron market analysis report includes information on upcoming trends and challenges that will influence market growth. This is to help companies strategize and leverage all forthcoming growth opportunities.
The study was conducted using an objective combination of primary and secondary information including inputs from key participants in the industry. The report contains a comprehensive market and vendor landscape in addition to an analysis of the key vendors.
The publisher presents a detailed picture of the market by the way of study, synthesis, and summation of data from multiple sources by an analysis of key parameters such as profit, pricing, competition, and promotions. It presents various market facets by identifying the key industry influencers. The data presented is comprehensive, reliable, and a result of extensive research - both primary and secondary. The market research reports provide a complete competitive landscape and an in-depth vendor selection methodology and analysis using qualitative and quantitative research to forecast the accurate market growth.
Table of Contents
1 Executive Summary
- 1.1 Market overview
2 Market Landscape
- 2.1 Market ecosystem
3 Market Sizing
- 3.1 Market definition
- 3.2 Market segment analysis
- 3.3 Market size 2023
- 3.4 Market outlook: Forecast for 2023-2028
4 Historic Market Size
- 4.1 Global boron market 2018 - 2022
- 4.2 Application Segment Analysis 2018 - 2022
- 4.3 End-user Segment Analysis 2018 - 2022
- 4.4 Geography Segment Analysis 2018 - 2022
- 4.5 Country Segment Analysis 2018 - 2022
5 Five Forces Analysis
- 5.1 Five forces summary
- 5.2 Bargaining power of buyers
- 5.3 Bargaining power of suppliers
- 5.4 Threat of new entrants
- 5.5 Threat of substitutes
- 5.6 Threat of rivalry
- 5.7 Market condition
6 Market Segmentation by Application
- 6.1 Market segments
- 6.2 Comparison by Application
- 6.3 Glass - Market size and forecast 2023-2028
- 6.4 Fertilizers - Market size and forecast 2023-2028
- 6.5 Ceramics - Market size and forecast 2023-2028
- 6.6 Detergents - Market size and forecast 2023-2028
- 6.7 Others - Market size and forecast 2023-2028
- 6.8 Market opportunity by Application
7 Market Segmentation by End-user
- 7.1 Market segments
- 7.2 Comparison by End-user
- 7.3 Construction - Market size and forecast 2023-2028
- 7.4 Agriculture - Market size and forecast 2023-2028
- 7.5 Personal care - Market size and forecast 2023-2028
- 7.6 Automotive - Market size and forecast 2023-2028
- 7.7 Others - Market size and forecast 2023-2028
- 7.8 Market opportunity by End-user
8 Customer Landscape
- 8.1 Customer landscape overview
9 Geographic Landscape
- 9.1 Geographic segmentation
- 9.2 Geographic comparison
- 9.3 APAC - Market size and forecast 2023-2028
- 9.4 North America - Market size and forecast 2023-2028
- 9.5 Europe - Market size and forecast 2023-2028
- 9.6 South America - Market size and forecast 2023-2028
- 9.7 Middle East and Africa - Market size and forecast 2023-2028
- 9.8 China - Market size and forecast 2023-2028
- 9.9 US - Market size and forecast 2023-2028
- 9.10 India - Market size and forecast 2023-2028
- 9.11 Japan - Market size and forecast 2023-2028
- 9.12 Germany - Market size and forecast 2023-2028
- 9.13 Market opportunity By Geographical Landscape
10 Drivers, Challenges, and Trends
- 10.1 Market drivers
- 10.2 Market challenges
- 10.3 Impact of drivers and challenges
- 10.4 Market trends
11 Vendor Landscape
- 11.1 Overview
- 11.2 Vendor landscape
- 11.3 Landscape disruption
- 11.4 Industry risks
12 Vendor Analysis
- 12.1 Vendors covered
- 12.2 Market positioning of vendors
- 12.3 3M Co.
- 12.4 American Borate Co.
- 12.5 Boron Specialties LLC
- 12.6 Eti Maden isletmeleri Genel Mudurlugu
- 12.7 Goodfellow Cambridge Ltd.
- 12.8 Minera Santa Rita Srl
- 12.9 Nanoshel LLC
- 12.10 Orocobre Ltd.
- 12.11 Quiborax
- 12.12 Rio Tinto Ltd.
- 12.13 Rose Mill Co.
- 12.14 SB Boron Corp.
- 12.15 SCL Italia Spa
- 12.16 Stanford Advanced Materials
- 12.17 Welvic Australia Pty Ltd.
13 Appendix
- 13.1 Scope of the report
- 13.2 Inclusions and exclusions checklist
- 13.3 Currency conversion rates for US$
- 13.4 Research methodology
- 13.5 List of abbreviations

