|
|
市場調査レポート
商品コード
1453807
RAIDコントローラ用バッテリーの世界市場 2024-2028Global RAID Controller Battery Market 2024-2028 |
||||||

|
|||||||
カスタマイズ可能
|
|||||||


| RAIDコントローラ用バッテリーの世界市場 2024-2028 |
|
出版日: 2024年02月05日
発行: TechNavio
ページ情報: 英文 152 Pages
納期: 即納可能
|

全表示
- 概要
- 図表
- 目次
RAIDコントローラ用バッテリー市場は2023-2028年に7,518万米ドル、予測期間中のCAGRは4.15%で成長すると予測されます。
当レポートでは、RAIDコントローラ用バッテリー市場の全体的な分析、市場規模・予測、動向、成長促進要因、課題、約25のベンダーを網羅したベンダー分析などを掲載しています。
現在の市場シナリオ、最新動向と促進要因、市場環境全体に関する最新分析を提供しています。同市場は、データセキュリティと完全性の重視の高まり、RAIDコンフィギュレーションの採用の増加、データ中心のアプリケーションの普及によって牽引されています。
| 市場範囲 | |
|---|---|
| 基準年 | 2024 |
| 終了年 | 2028 |
| 予測期間 | 2024-2028 |
| 成長モメンタム | 加速 |
| 前年比2024年 | 3.38% |
| CAGR | 4.15% |
| 増分額 | 7,518万米ドル |
本調査では、今後数年間のRAIDコントローラ用バッテリー市場成長を牽引する主な要因の1つとして、フラッシュベースのストレージデバイスの人気の高まりを挙げています。また、再生可能エネルギー源との統合やエネルギー効率への注目の高まりは、市場の大きな需要につながります。
目次
第1章 エグゼクティブサマリー
- 市場概要
第2章 市場情勢
- 市場エコシステム
第3章 市場規模
- 市場の定義
- 市場セグメント分析
- 市場規模 2023
- 市場の見通し 2023-2028
第4章 市場規模実績
- RAIDコントローラ用バッテリーの世界市場 2018-2022
- タイプセグメント分析 2018-2022
- 流通チャネルセグメント分析 2018-2022
- 地域別セグメント分析 2018-2022
- 国別セグメント分析 2018-2022
第5章 ファイブフォース分析
- ファイブフォースの要約
- 買い手の交渉力
- 供給企業の交渉力
- 新規参入業者の脅威
- 代替品の脅威
- 競争の脅威
- 市況
第6章 市場セグメンテーション:タイプ別
- 市場セグメント
- 比較:タイプ別
- リチウムイオン:市場規模と予測 2023-2028
- ニッケルカドミウム:市場規模と予測 2023-2028
- 市場機会:タイプ別
第7章 市場セグメンテーション:流通チャネル別
- 市場セグメント
- 比較:流通チャネル別
- オフライン:市場規模と予測 2023-2028
- オンライン:市場規模と予測 2023-2028
- 市場機会:流通チャネル別
第8章 顧客情勢
- 顧客情勢の概要
第9章 地域別情勢
- 地域別セグメンテーション
- 地域別比較
- アジア太平洋:市場規模と予測 2023-2028
- 北米:市場規模と予測 2023-2028
- 欧州:市場規模と予測 2023-2028
- 南米:市場規模と予測 2023-2028
- 中東・アフリカ:市場規模と予測 2023-2028
- 中国:市場規模と予測 2023-2028
- 米国:市場規模と予測 2023-2028
- インド:市場規模と予測 2023-2028
- ドイツ:市場規模と予測 2023-2028
- 日本:市場規模と予測 2023-2028
- 市場機会:地域情勢別
第10章 促進要因、課題、および動向
- 市場促進要因
- 市場の課題
- 促進要因と課題の影響
- 市場動向
第11章 ベンダー情勢
- 概要
- ベンダー情勢
- 混乱の状況
- 業界のリスク
第12章 ベンダー分析
- 対象ベンダー
- ベンダーの市場ポジショニング
- Areca Technology Corp.
- Broadcom Inc.
- Dell Technologies Inc.
- Hewlett Packard Enterprise Co.
- HighPoint Inc.
- Intel Corp.
- International Business Machines Corp.
- Lenovo Group Ltd.
- Super Micro Computer Inc.
第13章 付録
Exhibits:
- Exhibits1: Executive Summary - Chart on Market Overview
- Exhibits2: Executive Summary - Data Table on Market Overview
- Exhibits3: Executive Summary - Chart on Global Market Characteristics
- Exhibits4: Executive Summary - Chart on Market By Geographical Landscape
- Exhibits5: Executive Summary - Chart on Market Segmentation by Type
- Exhibits6: Executive Summary - Chart on Market Segmentation by Distribution Channel
- Exhibits7: Executive Summary - Chart on Incremental Growth
- Exhibits8: Executive Summary - Data Table on Incremental Growth
- Exhibits9: Executive Summary - Chart on Vendor Market Positioning
- Exhibits10: Parent market
- Exhibits11: Market Characteristics
- Exhibits12: Offerings of vendors included in the market definition
- Exhibits13: Market segments
- Exhibits14: Chart on Global - Market size and forecast 2023-2028 ($ million)
- Exhibits15: Data Table on Global - Market size and forecast 2023-2028 ($ million)
- Exhibits16: Chart on Global Market: Year-over-year growth 2023-2028 (%)
- Exhibits17: Data Table on Global Market: Year-over-year growth 2023-2028 (%)
- Exhibits18: Historic Market Size - Data Table on global raid controller battery market 2018 - 2022 ($ million)
- Exhibits19: Historic Market Size - Type Segment 2018 - 2022 ($ million)
- Exhibits20: Historic Market Size - Distribution Channel Segment 2018 - 2022 ($ million)
- Exhibits21: Historic Market Size - Geography Segment 2018 - 2022 ($ million)
- Exhibits22: Historic Market Size - Country Segment 2018 - 2022 ($ million)
- Exhibits23: Five forces analysis - Comparison between 2023 and 2028
- Exhibits24: Chart on Bargaining power of buyers - Impact of key factors 2023 and 2028
- Exhibits25: Bargaining power of suppliers - Impact of key factors in 2023 and 2028
- Exhibits26: Threat of new entrants - Impact of key factors in 2023 and 2028
- Exhibits27: Threat of substitutes - Impact of key factors in 2023 and 2028
- Exhibits28: Threat of rivalry - Impact of key factors in 2023 and 2028
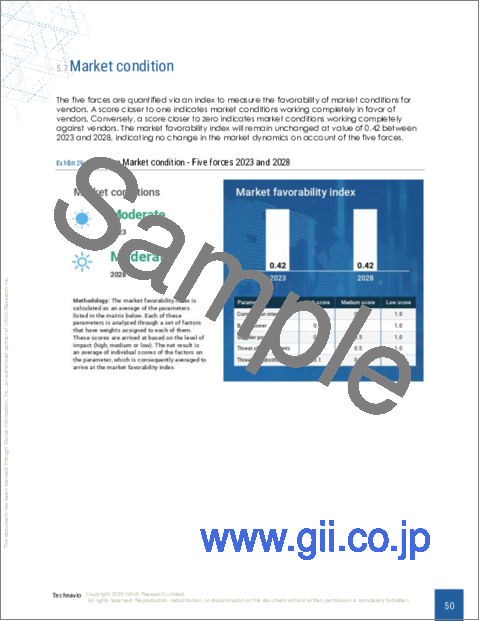
- Exhibits29: Chart on Market condition - Five forces 2023 and 2028
- Exhibits30: Chart on Type - Market share 2023-2028 (%)
- Exhibits31: Data Table on Type - Market share 2023-2028 (%)
- Exhibits32: Chart on Comparison by Type
- Exhibits33: Data Table on Comparison by Type
- Exhibits34: Chart on Lithium-ion - Market size and forecast 2023-2028 ($ million)
- Exhibits35: Data Table on Lithium-ion - Market size and forecast 2023-2028 ($ million)
- Exhibits36: Chart on Lithium-ion - Year-over-year growth 2023-2028 (%)
- Exhibits37: Data Table on Lithium-ion - Year-over-year growth 2023-2028 (%)
- Exhibits38: Chart on Nickel-cadmium - Market size and forecast 2023-2028 ($ million)
- Exhibits39: Data Table on Nickel-cadmium - Market size and forecast 2023-2028 ($ million)
- Exhibits40: Chart on Nickel-cadmium - Year-over-year growth 2023-2028 (%)
- Exhibits41: Data Table on Nickel-cadmium - Year-over-year growth 2023-2028 (%)
- Exhibits42: Market opportunity by Type ($ million)
- Exhibits43: Data Table on Market opportunity by Type ($ million)
- Exhibits44: Chart on Distribution Channel - Market share 2023-2028 (%)
- Exhibits45: Data Table on Distribution Channel - Market share 2023-2028 (%)
- Exhibits46: Chart on Comparison by Distribution Channel
- Exhibits47: Data Table on Comparison by Distribution Channel
- Exhibits48: Chart on Offline - Market size and forecast 2023-2028 ($ million)
- Exhibits49: Data Table on Offline - Market size and forecast 2023-2028 ($ million)
- Exhibits50: Chart on Offline - Year-over-year growth 2023-2028 (%)
- Exhibits51: Data Table on Offline - Year-over-year growth 2023-2028 (%)
- Exhibits52: Chart on Online - Market size and forecast 2023-2028 ($ million)
- Exhibits53: Data Table on Online - Market size and forecast 2023-2028 ($ million)
- Exhibits54: Chart on Online - Year-over-year growth 2023-2028 (%)
- Exhibits55: Data Table on Online - Year-over-year growth 2023-2028 (%)
- Exhibits56: Market opportunity by Distribution Channel ($ million)
- Exhibits57: Data Table on Market opportunity by Distribution Channel ($ million)
- Exhibits58: Analysis of price sensitivity, lifecycle, customer purchase basket, adoption rates, and purchase criteria
- Exhibits59: Chart on Market share By Geographical Landscape 2023-2028 (%)
- Exhibits60: Data Table on Market share By Geographical Landscape 2023-2028 (%)
- Exhibits61: Chart on Geographic comparison
- Exhibits62: Data Table on Geographic comparison
- Exhibits63: Chart on APAC - Market size and forecast 2023-2028 ($ million)
- Exhibits64: Data Table on APAC - Market size and forecast 2023-2028 ($ million)
- Exhibits65: Chart on APAC - Year-over-year growth 2023-2028 (%)
- Exhibits66: Data Table on APAC - Year-over-year growth 2023-2028 (%)
- Exhibits67: Chart on North America - Market size and forecast 2023-2028 ($ million)
- Exhibits68: Data Table on North America - Market size and forecast 2023-2028 ($ million)
- Exhibits69: Chart on North America - Year-over-year growth 2023-2028 (%)
- Exhibits70: Data Table on North America - Year-over-year growth 2023-2028 (%)
- Exhibits71: Chart on Europe - Market size and forecast 2023-2028 ($ million)
- Exhibits72: Data Table on Europe - Market size and forecast 2023-2028 ($ million)
- Exhibits73: Chart on Europe - Year-over-year growth 2023-2028 (%)
- Exhibits74: Data Table on Europe - Year-over-year growth 2023-2028 (%)
- Exhibits75: Chart on South America - Market size and forecast 2023-2028 ($ million)
- Exhibits76: Data Table on South America - Market size and forecast 2023-2028 ($ million)
- Exhibits77: Chart on South America - Year-over-year growth 2023-2028 (%)
- Exhibits78: Data Table on South America - Year-over-year growth 2023-2028 (%)
- Exhibits79: Chart on Middle East and Africa - Market size and forecast 2023-2028 ($ million)
- Exhibits80: Data Table on Middle East and Africa - Market size and forecast 2023-2028 ($ million)
- Exhibits81: Chart on Middle East and Africa - Year-over-year growth 2023-2028 (%)
- Exhibits82: Data Table on Middle East and Africa - Year-over-year growth 2023-2028 (%)
- Exhibits83: Chart on China - Market size and forecast 2023-2028 ($ million)
- Exhibits84: Data Table on China - Market size and forecast 2023-2028 ($ million)
- Exhibits85: Chart on China - Year-over-year growth 2023-2028 (%)
- Exhibits86: Data Table on China - Year-over-year growth 2023-2028 (%)
- Exhibits87: Chart on US - Market size and forecast 2023-2028 ($ million)
- Exhibits88: Data Table on US - Market size and forecast 2023-2028 ($ million)
- Exhibits89: Chart on US - Year-over-year growth 2023-2028 (%)
- Exhibits90: Data Table on US - Year-over-year growth 2023-2028 (%)
- Exhibits91: Chart on India - Market size and forecast 2023-2028 ($ million)
- Exhibits92: Data Table on India - Market size and forecast 2023-2028 ($ million)
- Exhibits93: Chart on India - Year-over-year growth 2023-2028 (%)
- Exhibits94: Data Table on India - Year-over-year growth 2023-2028 (%)
- Exhibits95: Chart on Germany - Market size and forecast 2023-2028 ($ million)
- Exhibits96: Data Table on Germany - Market size and forecast 2023-2028 ($ million)
- Exhibits97: Chart on Germany - Year-over-year growth 2023-2028 (%)
- Exhibits98: Data Table on Germany - Year-over-year growth 2023-2028 (%)
- Exhibits99: Chart on Japan - Market size and forecast 2023-2028 ($ million)
- Exhibits100: Data Table on Japan - Market size and forecast 2023-2028 ($ million)
- Exhibits101: Chart on Japan - Year-over-year growth 2023-2028 (%)
- Exhibits102: Data Table on Japan - Year-over-year growth 2023-2028 (%)
- Exhibits103: Market opportunity By Geographical Landscape ($ million)
- Exhibits104: Data Tables on Market opportunity By Geographical Landscape ($ million)
- Exhibits105: Impact of drivers and challenges in 2023 and 2028
- Exhibits106: Overview on Criticality of inputs and Factors of differentiation
- Exhibits107: Overview on factors of disruption
- Exhibits108: Impact of key risks on business
- Exhibits109: Vendors covered
- Exhibits110: Matrix on vendor position and classification
- Exhibits111: Areca Technology Corp. - Overview
- Exhibits112: Areca Technology Corp. - Product / Service
- Exhibits113: Areca Technology Corp. - Key offerings
- Exhibits114: Broadcom Inc. - Overview
- Exhibits115: Broadcom Inc. - Business segments
- Exhibits116: Broadcom Inc. - Key news
- Exhibits117: Broadcom Inc. - Key offerings
- Exhibits118: Broadcom Inc. - Segment focus
- Exhibits119: Dell Technologies Inc. - Overview
- Exhibits120: Dell Technologies Inc. - Business segments
- Exhibits121: Dell Technologies Inc. - Key news
- Exhibits122: Dell Technologies Inc. - Key offerings
- Exhibits123: Dell Technologies Inc. - Segment focus
- Exhibits124: Hewlett Packard Enterprise Co. - Overview
- Exhibits125: Hewlett Packard Enterprise Co. - Business segments
- Exhibits126: Hewlett Packard Enterprise Co. - Key news
- Exhibits127: Hewlett Packard Enterprise Co. - Key offerings
- Exhibits128: Hewlett Packard Enterprise Co. - Segment focus
- Exhibits129: HighPoint Inc. - Overview
- Exhibits130: HighPoint Inc. - Product / Service
- Exhibits131: HighPoint Inc. - Key offerings
- Exhibits132: Intel Corp. - Overview
- Exhibits133: Intel Corp. - Business segments
- Exhibits134: Intel Corp. - Key news
- Exhibits135: Intel Corp. - Key offerings
- Exhibits136: Intel Corp. - Segment focus
- Exhibits137: International Business Machines Corp. - Overview
- Exhibits138: International Business Machines Corp. - Business segments
- Exhibits139: International Business Machines Corp. - Key news
- Exhibits140: International Business Machines Corp. - Key offerings
- Exhibits141: International Business Machines Corp. - Segment focus
- Exhibits142: Lenovo Group Ltd. - Overview
- Exhibits143: Lenovo Group Ltd. - Business segments
- Exhibits144: Lenovo Group Ltd. - Key offerings
- Exhibits145: Lenovo Group Ltd. - Segment focus
- Exhibits146: Super Micro Computer Inc. - Overview
- Exhibits147: Super Micro Computer Inc. - Business segments
- Exhibits148: Super Micro Computer Inc. - Key offerings
- Exhibits149: Super Micro Computer Inc. - Segment focus
- Exhibits150: Inclusions checklist
- Exhibits151: Exclusions checklist
- Exhibits152: Currency conversion rates for US$
- Exhibits153: Research methodology
- Exhibits154: Validation techniques employed for market sizing
- Exhibits155: Information sources
- Exhibits156: List of abbreviations
The raid controller battery market is forecasted to grow by USD 75.18 mn during 2023-2028, accelerating at a CAGR of 4.15% during the forecast period. The report on the RAID controller battery market provides a holistic analysis, market size and forecast, trends, growth drivers, and challenges, as well as vendor analysis covering around 25 vendors.
The report offers an up-to-date analysis regarding the current market scenario, the latest trends and drivers, and the overall market environment. The market is driven by increasing emphasis on data security and integrity, rising adoption of raid configurations, and proliferation of data-centric applications.
Technavio's raid controller battery market is segmented as below:
| Market Scope | |
|---|---|
| Base Year | 2024 |
| End Year | 2028 |
| Series Year | 2024-2028 |
| Growth Momentum | Accelerate |
| YOY 2024 | 3.38% |
| CAGR | 4.15% |
| Incremental Value | $75.18mn |
By Type
- Lithium-ion
- Nickel-cadmium
By Distribution Channel
- Offline
- Online
By Geographical Landscape
- APAC
- North America
- Europe
- South America
- Middle East and Africa
This study identifies the growing popularity of flash-based storage devices as one of the prime reasons driving the RAID controller battery market growth during the next few years. Also, integration with renewable energy sources and increasing focus on energy efficiency will lead to sizable demand in the market.
The report on the RAID controller battery market covers the following areas:
- RAID controller battery market sizing
- RAID controller battery market forecast
- RAID controller battery market industry analysis
The robust vendor analysis is designed to help clients improve their market position, and in line with this, this report provides a detailed analysis of several leading RAID controller battery market vendors that include Areca Technology Corp., Broadcom Inc., Dell Technologies Inc., Hewlett Packard Enterprise Co., HighPoint Inc., Intel Corp., International Business Machines Corp., Lenovo Group Ltd., and Super Micro Computer Inc.. Also, the raid controller battery market analysis report includes information on upcoming trends and challenges that will influence market growth. This is to help companies strategize and leverage all forthcoming growth opportunities.
The study was conducted using an objective combination of primary and secondary information including inputs from key participants in the industry. The report contains a comprehensive market and vendor landscape in addition to an analysis of the key vendors.
The publisher presents a detailed picture of the market by the way of study, synthesis, and summation of data from multiple sources by an analysis of key parameters such as profit, pricing, competition, and promotions. It presents various market facets by identifying the key industry influencers. The data presented is comprehensive, reliable, and a result of extensive research - both primary and secondary. The market research reports provide a complete competitive landscape and an in-depth vendor selection methodology and analysis using qualitative and quantitative research to forecast the accurate market growth.
Table of Contents
1 Executive Summary
- 1.1 Market overview
2 Market Landscape
- 2.1 Market ecosystem
3 Market Sizing
- 3.1 Market definition
- 3.2 Market segment analysis
- 3.3 Market size 2023
- 3.4 Market outlook: Forecast for 2023-2028
4 Historic Market Size
- 4.1 Global RAID controller battery market 2018 - 2022
- 4.2 Type Segment Analysis 2018 - 2022
- 4.3 Distribution Channel Segment Analysis 2018 - 2022
- 4.4 Geography Segment Analysis 2018 - 2022
- 4.5 Country Segment Analysis 2018 - 2022
5 Five Forces Analysis
- 5.1 Five forces summary
- 5.2 Bargaining power of buyers
- 5.3 Bargaining power of suppliers
- 5.4 Threat of new entrants
- 5.5 Threat of substitutes
- 5.6 Threat of rivalry
- 5.7 Market condition
6 Market Segmentation by Type
- 6.1 Market segments
- 6.2 Comparison by Type
- 6.3 Lithium-ion - Market size and forecast 2023-2028
- 6.4 Nickel-cadmium - Market size and forecast 2023-2028
- 6.5 Market opportunity by Type
7 Market Segmentation by Distribution Channel
- 7.1 Market segments
- 7.2 Comparison by Distribution Channel
- 7.3 Offline - Market size and forecast 2023-2028
- 7.4 Online - Market size and forecast 2023-2028
- 7.5 Market opportunity by Distribution Channel
8 Customer Landscape
- 8.1 Customer landscape overview
9 Geographic Landscape
- 9.1 Geographic segmentation
- 9.2 Geographic comparison
- 9.3 APAC - Market size and forecast 2023-2028
- 9.4 North America - Market size and forecast 2023-2028
- 9.5 Europe - Market size and forecast 2023-2028
- 9.6 South America - Market size and forecast 2023-2028
- 9.7 Middle East and Africa - Market size and forecast 2023-2028
- 9.8 China - Market size and forecast 2023-2028
- 9.9 US - Market size and forecast 2023-2028
- 9.10 India - Market size and forecast 2023-2028
- 9.11 Germany - Market size and forecast 2023-2028
- 9.12 Japan - Market size and forecast 2023-2028
- 9.13 Market opportunity By Geographical Landscape
10 Drivers, Challenges, and Trends
- 10.1 Market drivers
- 10.2 Market challenges
- 10.3 Impact of drivers and challenges
- 10.4 Market trends
11 Vendor Landscape
- 11.1 Overview
- 11.2 Vendor landscape
- 11.3 Landscape disruption
- 11.4 Industry risks
12 Vendor Analysis
- 12.1 Vendors covered
- 12.2 Market positioning of vendors
- 12.3 Areca Technology Corp.
- 12.4 Broadcom Inc.
- 12.5 Dell Technologies Inc.
- 12.6 Hewlett Packard Enterprise Co.
- 12.7 HighPoint Inc.
- 12.8 Intel Corp.
- 12.9 International Business Machines Corp.
- 12.10 Lenovo Group Ltd.
- 12.11 Super Micro Computer Inc.
13 Appendix
- 13.1 Scope of the report
- 13.2 Inclusions and exclusions checklist
- 13.3 Currency conversion rates for US$
- 13.4 Research methodology
- 13.5 List of abbreviations

