|
|
市場調査レポート
商品コード
1450080
坑井試験サービスの世界市場 2024-2028Global Well Testing Services Market 2024-2028 |
||||||

|
|||||||
カスタマイズ可能
|
|||||||

| 坑井試験サービスの世界市場 2024-2028 |
|
出版日: 2024年03月01日
発行: TechNavio
ページ情報: 英文 174 Pages
納期: 即納可能
|

全表示
- 概要
- 図表
- 目次
坑井試験サービス市場は2023-2028年に26億9,000万米ドル、予測期間中のCAGRは6.69%で成長すると予測されます。
当レポートでは、坑井試験サービス市場の全体的な分析、市場規模・予測、動向、成長促進要因、課題、約25のベンダーを網羅したベンダー分析などを掲載しています。
現在の市場シナリオ、最新動向と促進要因、市場環境全体に関する最新分析を提供しています。深海や超深海のE・Pプロジェクトの増加、世界の石油・ガス需要の増加、坑井性能モニタリングに関連する政府規制の存在などが市場を牽引しています。
| 市場範囲 | |
|---|---|
| 基準年 | 2024 |
| 終了年 | 2028 |
| 予測期間 | 2024-2028 |
| 成長モメンタム | 加速 |
| 前年比2024年 | 6.09% |
| CAGR | 6.69% |
| 増分額 | 26億9,000万米ドル |
本調査では、石油・ガス産業におけるIoT導入の拡大が、今後数年間の坑井試験サービス市場成長を牽引する主要因の1つであると分析しています。また、非在来型石油・ガス資源の増加や石油・ガス業界における統合の進展は、市場の大きな需要につながります。
目次
第1章 エグゼクティブサマリー
- 市場概要
第2章 市場情勢
- 市場エコシステム
第3章 市場規模
- 市場の定義
- 市場セグメント分析
- 市場規模 2023
- 市場の見通し 2023-2028
第4章 市場規模実績
- 坑井試験サービスの世界市場 2018-2022
- 用途別セグメント分析 2018-2022
- タイプセグメント分析 2018-2022
- 地域別セグメント分析 2018-2022
- 国別セグメント分析 2018-2022
第5章 ファイブフォース分析
- ファイブフォースの要約
- 買い手の交渉力
- 供給企業の交渉力
- 新規参入業者の脅威
- 代替品の脅威
- 競争の脅威
- 市況
第6章 市場セグメンテーション:用途別
- 市場セグメント
- 比較:用途別
- オンショア:市場規模と予測 2023-2028
- オフショア:市場規模と予測 2023-2028
- 市場機会:用途別
第7章 市場セグメンテーション:タイプ別
- 市場セグメント
- 比較:タイプ別
- 水平井:市場規模と予測 2023-2028
- 垂直井:市場規模と予測 2023-2028
- 市場機会:タイプ別
第8章 顧客情勢
- 顧客情勢の概要
第9章 地域別情勢
- 地域別セグメンテーション
- 地域別比較
- 北米:市場規模と予測 2023-2028
- アジア太平洋:市場規模と予測 2023-2028
- 欧州:市場規模と予測 2023-2028
- 中東・アフリカ:市場規模と予測 2023-2028
- 南米:市場規模と予測 2023-2028
- 米国:市場規模と予測 2023-2028
- 中国:市場規模と予測 2023-2028
- ロシア:市場規模と予測 2023-2028
- カナダ:市場規模と予測 2023-2028
- 英国:市場規模と予測 2023-2028
- 市場機会:地域情勢別
第10章 促進要因、課題、および動向
- 市場促進要因
- 市場の課題
- 促進要因と課題の影響
- 市場動向
第11章 ベンダー情勢
- 概要
- ベンダー情勢
- 混乱の状況
- 業界のリスク
第12章 ベンダー分析
- 対象ベンダー
- ベンダーの市場ポジショニング
- Baker Hughes Co.
- Expro Group Holdings NV
- Gulf Energy SAOC
- Halliburton Co.
- MB Petroleum Services LLC
- Minerals Technologies Inc.
- National Energy Services Reunited Corp.
- Oil States International Inc.
- OiLSERV
- Schlumberger Ltd.
- SGS SA
- TechnipFMC plc
- TETRA Technologies Inc.
- Weatherford International Plc
- WellMax Oilfield Technologies Pvt. Ltd.
第13章 付録
Exhibits:
- Exhibits1: Executive Summary - Chart on Market Overview
- Exhibits2: Executive Summary - Data Table on Market Overview
- Exhibits3: Executive Summary - Chart on Global Market Characteristics
- Exhibits4: Executive Summary - Chart on Market By Geographical Landscape
- Exhibits5: Executive Summary - Chart on Market Segmentation by Application
- Exhibits6: Executive Summary - Chart on Market Segmentation by Type
- Exhibits7: Executive Summary - Chart on Incremental Growth
- Exhibits8: Executive Summary - Data Table on Incremental Growth
- Exhibits9: Executive Summary - Chart on Vendor Market Positioning
- Exhibits10: Parent market
- Exhibits11: Market Characteristics
- Exhibits12: Offerings of vendors included in the market definition
- Exhibits13: Market segments
- Exhibits14: Chart on Global - Market size and forecast 2023-2028 ($ billion)
- Exhibits15: Data Table on Global - Market size and forecast 2023-2028 ($ billion)
- Exhibits16: Chart on Global Market: Year-over-year growth 2023-2028 (%)
- Exhibits17: Data Table on Global Market: Year-over-year growth 2023-2028 (%)
- Exhibits18: Historic Market Size - Data Table on global well testing services market 2018 - 2022 ($ billion)
- Exhibits19: Historic Market Size - Application Segment 2018 - 2022 ($ billion)
- Exhibits20: Historic Market Size - Type Segment 2018 - 2022 ($ billion)
- Exhibits21: Historic Market Size - Geography Segment 2018 - 2022 ($ billion)
- Exhibits22: Historic Market Size - Country Segment 2018 - 2022 ($ billion)
- Exhibits23: Five forces analysis - Comparison between 2023 and 2028
- Exhibits24: Chart on Bargaining power of buyers - Impact of key factors 2023 and 2028
- Exhibits25: Bargaining power of suppliers - Impact of key factors in 2023 and 2028
- Exhibits26: Threat of new entrants - Impact of key factors in 2023 and 2028
- Exhibits27: Threat of substitutes - Impact of key factors in 2023 and 2028
- Exhibits28: Threat of rivalry - Impact of key factors in 2023 and 2028
- Exhibits29: Chart on Market condition - Five forces 2023 and 2028
- Exhibits30: Chart on Application - Market share 2023-2028 (%)
- Exhibits31: Data Table on Application - Market share 2023-2028 (%)
- Exhibits32: Chart on Comparison by Application
- Exhibits33: Data Table on Comparison by Application
- Exhibits34: Chart on Onshore - Market size and forecast 2023-2028 ($ billion)
- Exhibits35: Data Table on Onshore - Market size and forecast 2023-2028 ($ billion)
- Exhibits36: Chart on Onshore - Year-over-year growth 2023-2028 (%)
- Exhibits37: Data Table on Onshore - Year-over-year growth 2023-2028 (%)
- Exhibits38: Chart on Offshore - Market size and forecast 2023-2028 ($ billion)
- Exhibits39: Data Table on Offshore - Market size and forecast 2023-2028 ($ billion)
- Exhibits40: Chart on Offshore - Year-over-year growth 2023-2028 (%)
- Exhibits41: Data Table on Offshore - Year-over-year growth 2023-2028 (%)
- Exhibits42: Market opportunity by Application ($ billion)
- Exhibits43: Data Table on Market opportunity by Application ($ billion)
- Exhibits44: Chart on Type - Market share 2023-2028 (%)
- Exhibits45: Data Table on Type - Market share 2023-2028 (%)
- Exhibits46: Chart on Comparison by Type
- Exhibits47: Data Table on Comparison by Type
- Exhibits48: Chart on Horizontal wells - Market size and forecast 2023-2028 ($ billion)
- Exhibits49: Data Table on Horizontal wells - Market size and forecast 2023-2028 ($ billion)
- Exhibits50: Chart on Horizontal wells - Year-over-year growth 2023-2028 (%)
- Exhibits51: Data Table on Horizontal wells - Year-over-year growth 2023-2028 (%)
- Exhibits52: Chart on Vertical wells - Market size and forecast 2023-2028 ($ billion)
- Exhibits53: Data Table on Vertical wells - Market size and forecast 2023-2028 ($ billion)
- Exhibits54: Chart on Vertical wells - Year-over-year growth 2023-2028 (%)
- Exhibits55: Data Table on Vertical wells - Year-over-year growth 2023-2028 (%)
- Exhibits56: Market opportunity by Type ($ billion)
- Exhibits57: Data Table on Market opportunity by Type ($ billion)
- Exhibits58: Analysis of price sensitivity, lifecycle, customer purchase basket, adoption rates, and purchase criteria
- Exhibits59: Chart on Market share By Geographical Landscape 2023-2028 (%)
- Exhibits60: Data Table on Market share By Geographical Landscape 2023-2028 (%)
- Exhibits61: Chart on Geographic comparison
- Exhibits62: Data Table on Geographic comparison
- Exhibits63: Chart on North America - Market size and forecast 2023-2028 ($ billion)
- Exhibits64: Data Table on North America - Market size and forecast 2023-2028 ($ billion)
- Exhibits65: Chart on North America - Year-over-year growth 2023-2028 (%)
- Exhibits66: Data Table on North America - Year-over-year growth 2023-2028 (%)
- Exhibits67: Chart on APAC - Market size and forecast 2023-2028 ($ billion)
- Exhibits68: Data Table on APAC - Market size and forecast 2023-2028 ($ billion)
- Exhibits69: Chart on APAC - Year-over-year growth 2023-2028 (%)
- Exhibits70: Data Table on APAC - Year-over-year growth 2023-2028 (%)
- Exhibits71: Chart on Europe - Market size and forecast 2023-2028 ($ billion)
- Exhibits72: Data Table on Europe - Market size and forecast 2023-2028 ($ billion)
- Exhibits73: Chart on Europe - Year-over-year growth 2023-2028 (%)
- Exhibits74: Data Table on Europe - Year-over-year growth 2023-2028 (%)
- Exhibits75: Chart on Middle East and Africa - Market size and forecast 2023-2028 ($ billion)
- Exhibits76: Data Table on Middle East and Africa - Market size and forecast 2023-2028 ($ billion)
- Exhibits77: Chart on Middle East and Africa - Year-over-year growth 2023-2028 (%)
- Exhibits78: Data Table on Middle East and Africa - Year-over-year growth 2023-2028 (%)
- Exhibits79: Chart on South America - Market size and forecast 2023-2028 ($ billion)
- Exhibits80: Data Table on South America - Market size and forecast 2023-2028 ($ billion)
- Exhibits81: Chart on South America - Year-over-year growth 2023-2028 (%)
- Exhibits82: Data Table on South America - Year-over-year growth 2023-2028 (%)
- Exhibits83: Chart on US - Market size and forecast 2023-2028 ($ billion)
- Exhibits84: Data Table on US - Market size and forecast 2023-2028 ($ billion)
- Exhibits85: Chart on US - Year-over-year growth 2023-2028 (%)
- Exhibits86: Data Table on US - Year-over-year growth 2023-2028 (%)
- Exhibits87: Chart on China - Market size and forecast 2023-2028 ($ billion)
- Exhibits88: Data Table on China - Market size and forecast 2023-2028 ($ billion)
- Exhibits89: Chart on China - Year-over-year growth 2023-2028 (%)
- Exhibits90: Data Table on China - Year-over-year growth 2023-2028 (%)
- Exhibits91: Chart on Russia - Market size and forecast 2023-2028 ($ billion)
- Exhibits92: Data Table on Russia - Market size and forecast 2023-2028 ($ billion)
- Exhibits93: Chart on Russia - Year-over-year growth 2023-2028 (%)
- Exhibits94: Data Table on Russia - Year-over-year growth 2023-2028 (%)
- Exhibits95: Chart on Canada - Market size and forecast 2023-2028 ($ billion)
- Exhibits96: Data Table on Canada - Market size and forecast 2023-2028 ($ billion)
- Exhibits97: Chart on Canada - Year-over-year growth 2023-2028 (%)
- Exhibits98: Data Table on Canada - Year-over-year growth 2023-2028 (%)
- Exhibits99: Chart on UK - Market size and forecast 2023-2028 ($ billion)
- Exhibits100: Data Table on UK - Market size and forecast 2023-2028 ($ billion)
- Exhibits101: Chart on UK - Year-over-year growth 2023-2028 (%)
- Exhibits102: Data Table on UK - Year-over-year growth 2023-2028 (%)
- Exhibits103: Market opportunity By Geographical Landscape ($ billion)
- Exhibits104: Data Tables on Market opportunity By Geographical Landscape ($ billion)
- Exhibits105: Impact of drivers and challenges in 2023 and 2028
- Exhibits106: Overview on Criticality of inputs and Factors of differentiation
- Exhibits107: Overview on factors of disruption
- Exhibits108: Impact of key risks on business
- Exhibits109: Vendors covered
- Exhibits110: Matrix on vendor position and classification
- Exhibits111: Baker Hughes Co. - Overview
- Exhibits112: Baker Hughes Co. - Business segments
- Exhibits113: Baker Hughes Co. - Key news
- Exhibits114: Baker Hughes Co. - Key offerings
- Exhibits115: Baker Hughes Co. - Segment focus
- Exhibits116: Expro Group Holdings NV - Overview
- Exhibits117: Expro Group Holdings NV - Business segments
- Exhibits118: Expro Group Holdings NV - Key offerings
- Exhibits119: Expro Group Holdings NV - Segment focus
- Exhibits120: Gulf Energy SAOC - Overview
- Exhibits121: Gulf Energy SAOC - Key offerings
- Exhibits122: Halliburton Co. - Overview
- Exhibits123: Halliburton Co. - Business segments
- Exhibits124: Halliburton Co. - Key news
- Exhibits125: Halliburton Co. - Key offerings
- Exhibits126: Halliburton Co. - Segment focus
- Exhibits127: MB Petroleum Services LLC - Overview
- Exhibits128: MB Petroleum Services LLC - Product / Service
- Exhibits129: MB Petroleum Services LLC - Key offerings
- Exhibits130: Minerals Technologies Inc. - Overview
- Exhibits131: Minerals Technologies Inc. - Business segments
- Exhibits132: Minerals Technologies Inc. - Key offerings
- Exhibits133: Minerals Technologies Inc. - Segment focus
- Exhibits134: National Energy Services Reunited Corp. - Overview
- Exhibits135: National Energy Services Reunited Corp. - Product / Service
- Exhibits136: National Energy Services Reunited Corp. - Key offerings
- Exhibits137: Oil States International Inc. - Overview
- Exhibits138: Oil States International Inc. - Business segments
- Exhibits139: Oil States International Inc. - Key news
- Exhibits140: Oil States International Inc. - Key offerings
- Exhibits141: Oil States International Inc. - Segment focus
- Exhibits142: OiLSERV - Overview
- Exhibits143: OiLSERV - Product / Service
- Exhibits144: OiLSERV - Key offerings
- Exhibits145: Schlumberger Ltd. - Overview
- Exhibits146: Schlumberger Ltd. - Business segments
- Exhibits147: Schlumberger Ltd. - Key news
- Exhibits148: Schlumberger Ltd. - Key offerings
- Exhibits149: Schlumberger Ltd. - Segment focus
- Exhibits150: SGS SA - Overview
- Exhibits151: SGS SA - Business segments
- Exhibits152: SGS SA - Key offerings
- Exhibits153: SGS SA - Segment focus
- Exhibits154: TechnipFMC plc - Overview
- Exhibits155: TechnipFMC plc - Business segments
- Exhibits156: TechnipFMC plc - Key news
- Exhibits157: TechnipFMC plc - Key offerings
- Exhibits158: TechnipFMC plc - Segment focus
- Exhibits159: TETRA Technologies Inc. - Overview
- Exhibits160: TETRA Technologies Inc. - Business segments
- Exhibits161: TETRA Technologies Inc. - Key offerings
- Exhibits162: TETRA Technologies Inc. - Segment focus
- Exhibits163: Weatherford International Plc - Overview
- Exhibits164: Weatherford International Plc - Business segments
- Exhibits165: Weatherford International Plc - Key news
- Exhibits166: Weatherford International Plc - Key offerings
- Exhibits167: Weatherford International Plc - Segment focus
- Exhibits168: WellMax Oilfield Technologies Pvt. Ltd. - Overview
- Exhibits169: WellMax Oilfield Technologies Pvt. Ltd. - Key offerings
- Exhibits170: Inclusions checklist
- Exhibits171: Exclusions checklist
- Exhibits172: Currency conversion rates for US$
- Exhibits173: Research methodology
- Exhibits174: Validation techniques employed for market sizing
- Exhibits175: Information sources
- Exhibits176: List of abbreviations
The well testing services market is forecasted to grow by USD 2.69 bn during 2023-2028, accelerating at a CAGR of 6.69% during the forecast period. The report on the well testing services market provides a holistic analysis, market size and forecast, trends, growth drivers, and challenges, as well as vendor analysis covering around 25 vendors.
The report offers an up-to-date analysis regarding the current market scenario, the latest trends and drivers, and the overall market environment. The market is driven by rise in deepwater and ultra-deepwater E and P projects, increase in demand for oil and gas globally, and presence of government regulations related to well performance monitoring.
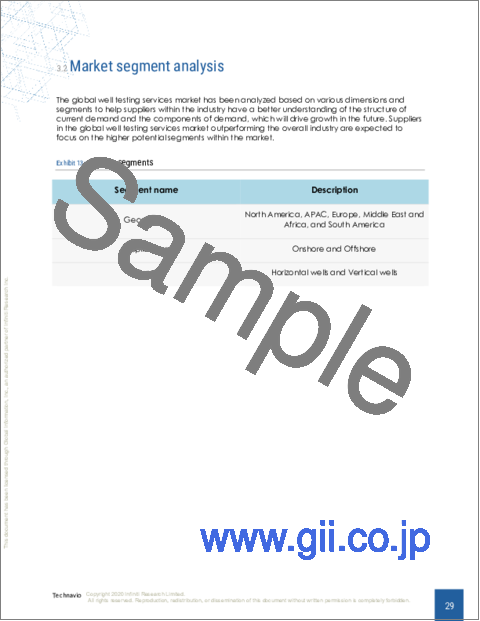
Technavio's well testing services market is segmented as below:
| Market Scope | |
|---|---|
| Base Year | 2024 |
| End Year | 2028 |
| Series Year | 2024-2028 |
| Growth Momentum | Accelerate |
| YOY 2024 | 6.09% |
| CAGR | 6.69% |
| Incremental Value | $2.69bn |
By Application
- Onshore
- Offshore
By Type
- Horizontal wells
- Vertical wells
By Geographical Landscape
- North America
- APAC
- Europe
- Middle East and Africa
- South America
This study identifies the growing adoption of IoT by oil and gas industry as one of the prime reasons driving the well testing services market growth during the next few years. Also, rise in unconventional oil and gas resources and growing consolidation in oil and gas industry will lead to sizable demand in the market.
The report on the well testing services market covers the following areas:
- Well testing services market sizing
- Well testing services market forecast
- Well testing services market industry analysis
The robust vendor analysis is designed to help clients improve their market position, and in line with this, this report provides a detailed analysis of several leading well testing services market vendors that include Baker Hughes Co., China Oilfield Services Ltd., EXALO Drilling SA, Expro Group Holdings NV, Gulf Energy SAOC, Halliburton Co., MB Petroleum Services LLC, Minerals Technologies Inc., National Energy Services Reunited Corp., Oil States International Inc., OiLSERV, Rays Well Testing Service Inc, Schlumberger Ltd., SGS SA, Stuart Wells Ltd., TechnipFMC plc, TETRA Technologies Inc., Weatherford International Plc, Well Services Group, and WellMax Oilfield Technologies Pvt. Ltd.. Also, the well testing services market analysis report includes information on upcoming trends and challenges that will influence market growth. This is to help companies strategize and leverage all forthcoming growth opportunities.
The study was conducted using an objective combination of primary and secondary information including inputs from key participants in the industry. The report contains a comprehensive market and vendor landscape in addition to an analysis of the key vendors.
The publisher presents a detailed picture of the market by the way of study, synthesis, and summation of data from multiple sources by an analysis of key parameters such as profit, pricing, competition, and promotions. It presents various market facets by identifying the key industry influencers. The data presented is comprehensive, reliable, and a result of extensive research - both primary and secondary. The market research reports provide a complete competitive landscape and an in-depth vendor selection methodology and analysis using qualitative and quantitative research to forecast the accurate market growth.
Table of Contents
1 Executive Summary
- 1.1 Market overview
2 Market Landscape
- 2.1 Market ecosystem
3 Market Sizing
- 3.1 Market definition
- 3.2 Market segment analysis
- 3.3 Market size 2023
- 3.4 Market outlook: Forecast for 2023-2028
4 Historic Market Size
- 4.1 Global well testing services market 2018 - 2022
- 4.2 Application Segment Analysis 2018 - 2022
- 4.3 Type Segment Analysis 2018 - 2022
- 4.4 Geography Segment Analysis 2018 - 2022
- 4.5 Country Segment Analysis 2018 - 2022
5 Five Forces Analysis
- 5.1 Five forces summary
- 5.2 Bargaining power of buyers
- 5.3 Bargaining power of suppliers
- 5.4 Threat of new entrants
- 5.5 Threat of substitutes
- 5.6 Threat of rivalry
- 5.7 Market condition
6 Market Segmentation by Application
- 6.1 Market segments
- 6.2 Comparison by Application
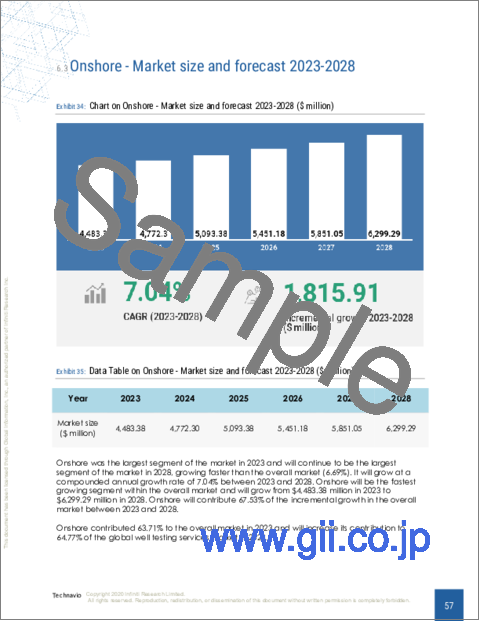
- 6.3 Onshore - Market size and forecast 2023-2028
- 6.4 Offshore - Market size and forecast 2023-2028
- 6.5 Market opportunity by Application
7 Market Segmentation by Type
- 7.1 Market segments
- 7.2 Comparison by Type
- 7.3 Horizontal wells - Market size and forecast 2023-2028
- 7.4 Vertical wells - Market size and forecast 2023-2028
- 7.5 Market opportunity by Type
8 Customer Landscape
- 8.1 Customer landscape overview
9 Geographic Landscape
- 9.1 Geographic segmentation
- 9.2 Geographic comparison
- 9.3 North America - Market size and forecast 2023-2028
- 9.4 APAC - Market size and forecast 2023-2028
- 9.5 Europe - Market size and forecast 2023-2028
- 9.6 Middle East and Africa - Market size and forecast 2023-2028
- 9.7 South America - Market size and forecast 2023-2028
- 9.8 US - Market size and forecast 2023-2028
- 9.9 China - Market size and forecast 2023-2028
- 9.10 Russia - Market size and forecast 2023-2028
- 9.11 Canada - Market size and forecast 2023-2028
- 9.12 UK - Market size and forecast 2023-2028
- 9.13 Market opportunity By Geographical Landscape
10 Drivers, Challenges, and Trends
- 10.1 Market drivers
- 10.2 Market challenges
- 10.3 Impact of drivers and challenges
- 10.4 Market trends
11 Vendor Landscape
- 11.1 Overview
- 11.2 Vendor landscape
- 11.3 Landscape disruption
- 11.4 Industry risks
12 Vendor Analysis
- 12.1 Vendors covered
- 12.2 Market positioning of vendors
- 12.3 Baker Hughes Co.
- 12.4 Expro Group Holdings NV
- 12.5 Gulf Energy SAOC
- 12.6 Halliburton Co.
- 12.7 MB Petroleum Services LLC
- 12.8 Minerals Technologies Inc.
- 12.9 National Energy Services Reunited Corp.
- 12.10 Oil States International Inc.
- 12.11 OiLSERV
- 12.12 Schlumberger Ltd.
- 12.13 SGS SA
- 12.14 TechnipFMC plc
- 12.15 TETRA Technologies Inc.
- 12.16 Weatherford International Plc
- 12.17 WellMax Oilfield Technologies Pvt. Ltd.
13 Appendix
- 13.1 Scope of the report
- 13.2 Inclusions and exclusions checklist
- 13.3 Currency conversion rates for US$
- 13.4 Research methodology
- 13.5 List of abbreviations

