|
|
市場調査レポート
商品コード
1450074
量子センサーの世界市場 2024-2028Global Quantum Sensors Market 2024-2028 |
||||||
|
|||||||
カスタマイズ可能
|
|||||||

| 量子センサーの世界市場 2024-2028 |
|
出版日: 2024年02月29日
発行: TechNavio
ページ情報: 英文 185 Pages
納期: 即納可能
|

全表示
- 概要
- 図表
- 目次
量子センサー市場は2023-2028年に5億6,050万米ドル、予測期間中のCAGRは13.47%で成長すると予測されます。
当レポートでは、量子センサー市場の全体的な分析、市場規模・予測、動向、成長促進要因、課題、約25のベンダーを網羅したベンダー分析などを掲載しています。
現在の市場シナリオ、最新動向と促進要因、市場環境全体に関する最新分析を提供しています。市場は、大学における量子コンピューティング研究への注目の高まり、量子技術の研究開発に対する政府の取り組みや資金提供プログラムの増加、環境モニタリングにおける量子センサーの需要の高まりなどが牽引しています。
| 市場範囲 | |
|---|---|
| 基準年 | 2024 |
| 終了年 | 2028 |
| 予測期間 | 2024-2028 |
| 成長モメンタム | 加速 |
| 前年比2024年 | 12.39% |
| CAGR | 13.47% |
| 増分額 | 5億6,050万米ドル |
本調査では、今後数年間の量子センサー市場成長を牽引する主要因の1つとして、量子センサー産業における発展と投資の増加を挙げています。また、量子センサーにおけるAIや機械学習の統合、量子センサーの小型化、既存のシステムやデバイスへの統合が市場の大きな需要につながります。
目次
第1章 エグゼクティブサマリー
- 市場概要
第2章 市場情勢
- 市場エコシステム
第3章 市場規模
- 市場の定義
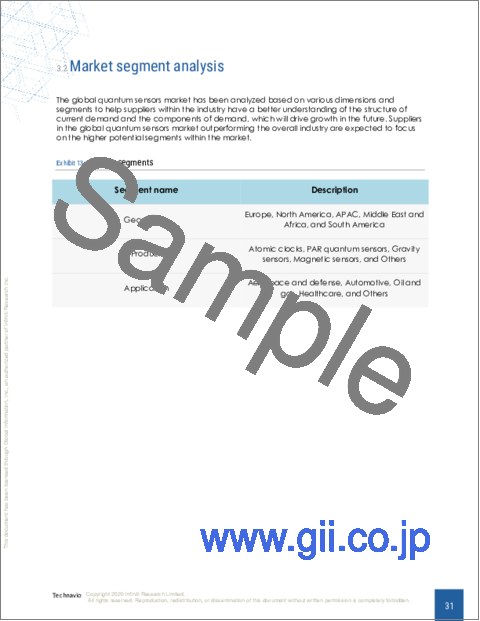
- 市場セグメント分析
- 市場規模 2023
- 市場の見通し 2023-2028
第4章 市場規模実績
- 量子センサーの世界市場 2018-2022
- 製品セグメント分析 2018-2022
- 用途別セグメント分析 2018-2022
- 地域別セグメント分析 2018-2022
- 国別セグメント分析 2018-2022
第5章 ファイブフォース分析
- ファイブフォースの要約
- 買い手の交渉力
- 供給企業の交渉力
- 新規参入業者の脅威
- 代替品の脅威
- 競争の脅威
- 市況
第6章 市場セグメンテーション:製品別
- 市場セグメント
- 比較:製品別
- 原子時計:市場規模と予測 2023-2028
- PAR量子センサー:市場規模と予測 2023-2028
- 重力センサー:市場規模と予測 2023-2028
- 磁気センサー:市場規模と予測 2023-2028
- その他:市場規模と予測 2023-2028
- 市場機会:製品別
第7章 市場セグメンテーション:用途別
- 市場セグメント
- 比較:用途別
- 航空宇宙と防衛:市場規模と予測 2023-2028
- 自動車:市場規模と予測 2023-2028
- 石油・ガス:市場規模と予測 2023-2028
- ヘルスケア:市場規模と予測 2023-2028
- その他:市場規模と予測 2023-2028
- 市場機会:用途別
第8章 顧客情勢
- 顧客情勢の概要
第9章 地域別情勢
- 地域別セグメンテーション
- 地域別比較
- 欧州:市場規模と予測 2023-2028
- 北米:市場規模と予測 2023-2028
- アジア太平洋:市場規模と予測 2023-2028
- 中東・アフリカ:市場規模と予測 2023-2028
- 南米:市場規模と予測 2023-2028
- 米国:市場規模と予測 2023-2028
- 英国:市場規模と予測 2023-2028
- 中国:市場規模と予測 2023-2028
- ドイツ:市場規模と予測 2023-2028
- 日本:市場規模と予測 2023-2028
- 市場機会:地域情勢別
第10章 促進要因、課題、および動向
- 市場促進要因
- 市場の課題
- 促進要因と課題の影響
- 市場動向
第11章 ベンダー情勢
- 概要
- ベンダー情勢
- 混乱の状況
- 業界のリスク
第12章 ベンダー分析
- 対象ベンダー
- ベンダーの市場ポジショニング
- ADVA Optical Networking SE
- AOSense Inc.
- Apogee Instruments Inc.
- Biospherical Instruments Inc.
- GWR Instruments Inc.
- Impedans Ltd.
- Irradian Ltd.
- Kipp and Zonen BV
- LI COR Inc.
- M Squared Lasers Ltd.
- Mesotech International Inc.
- Microchip Technology Inc.
- Muquans
- OTT HydroMet GmbH
- Skye Instruments Ltd.
第13章 付録
Exhibits:
- Exhibits1: Executive Summary - Chart on Market Overview
- Exhibits2: Executive Summary - Data Table on Market Overview
- Exhibits3: Executive Summary - Chart on Global Market Characteristics
- Exhibits4: Executive Summary - Chart on Market By Geographical Landscape
- Exhibits5: Executive Summary - Chart on Market Segmentation by Product
- Exhibits6: Executive Summary - Chart on Market Segmentation by Application
- Exhibits7: Executive Summary - Chart on Incremental Growth
- Exhibits8: Executive Summary - Data Table on Incremental Growth
- Exhibits9: Executive Summary - Chart on Vendor Market Positioning
- Exhibits10: Parent market
- Exhibits11: Market Characteristics
- Exhibits12: Offerings of vendors included in the market definition
- Exhibits13: Market segments
- Exhibits14: Chart on Global - Market size and forecast 2023-2028 ($ million)
- Exhibits15: Data Table on Global - Market size and forecast 2023-2028 ($ million)
- Exhibits16: Chart on Global Market: Year-over-year growth 2023-2028 (%)
- Exhibits17: Data Table on Global Market: Year-over-year growth 2023-2028 (%)
- Exhibits18: Historic Market Size - Data Table on global quantum sensors market 2018 - 2022 ($ million)
- Exhibits19: Historic Market Size - Product Segment 2018 - 2022 ($ million)
- Exhibits20: Historic Market Size - Application Segment 2018 - 2022 ($ million)
- Exhibits21: Historic Market Size - Geography Segment 2018 - 2022 ($ million)
- Exhibits22: Historic Market Size - Country Segment 2018 - 2022 ($ million)
- Exhibits23: Five forces analysis - Comparison between 2023 and 2028
- Exhibits24: Chart on Bargaining power of buyers - Impact of key factors 2023 and 2028
- Exhibits25: Bargaining power of suppliers - Impact of key factors in 2023 and 2028
- Exhibits26: Threat of new entrants - Impact of key factors in 2023 and 2028
- Exhibits27: Threat of substitutes - Impact of key factors in 2023 and 2028
- Exhibits28: Threat of rivalry - Impact of key factors in 2023 and 2028
- Exhibits29: Chart on Market condition - Five forces 2023 and 2028
- Exhibits30: Chart on Product - Market share 2023-2028 (%)
- Exhibits31: Data Table on Product - Market share 2023-2028 (%)
- Exhibits32: Chart on Comparison by Product
- Exhibits33: Data Table on Comparison by Product
- Exhibits34: Chart on Atomic clocks - Market size and forecast 2023-2028 ($ million)
- Exhibits35: Data Table on Atomic clocks - Market size and forecast 2023-2028 ($ million)
- Exhibits36: Chart on Atomic clocks - Year-over-year growth 2023-2028 (%)
- Exhibits37: Data Table on Atomic clocks - Year-over-year growth 2023-2028 (%)
- Exhibits38: Chart on PAR quantum sensors - Market size and forecast 2023-2028 ($ million)
- Exhibits39: Data Table on PAR quantum sensors - Market size and forecast 2023-2028 ($ million)
- Exhibits40: Chart on PAR quantum sensors - Year-over-year growth 2023-2028 (%)
- Exhibits41: Data Table on PAR quantum sensors - Year-over-year growth 2023-2028 (%)
- Exhibits42: Chart on Gravity sensors - Market size and forecast 2023-2028 ($ million)
- Exhibits43: Data Table on Gravity sensors - Market size and forecast 2023-2028 ($ million)
- Exhibits44: Chart on Gravity sensors - Year-over-year growth 2023-2028 (%)
- Exhibits45: Data Table on Gravity sensors - Year-over-year growth 2023-2028 (%)
- Exhibits46: Chart on Magnetic sensors - Market size and forecast 2023-2028 ($ million)
- Exhibits47: Data Table on Magnetic sensors - Market size and forecast 2023-2028 ($ million)
- Exhibits48: Chart on Magnetic sensors - Year-over-year growth 2023-2028 (%)
- Exhibits49: Data Table on Magnetic sensors - Year-over-year growth 2023-2028 (%)
- Exhibits50: Chart on Others - Market size and forecast 2023-2028 ($ million)
- Exhibits51: Data Table on Others - Market size and forecast 2023-2028 ($ million)
- Exhibits52: Chart on Others - Year-over-year growth 2023-2028 (%)
- Exhibits53: Data Table on Others - Year-over-year growth 2023-2028 (%)
- Exhibits54: Market opportunity by Product ($ million)
- Exhibits55: Data Table on Market opportunity by Product ($ million)
- Exhibits56: Chart on Application - Market share 2023-2028 (%)
- Exhibits57: Data Table on Application - Market share 2023-2028 (%)
- Exhibits58: Chart on Comparison by Application
- Exhibits59: Data Table on Comparison by Application
- Exhibits60: Chart on Aerospace and defense - Market size and forecast 2023-2028 ($ million)
- Exhibits61: Data Table on Aerospace and defense - Market size and forecast 2023-2028 ($ million)
- Exhibits62: Chart on Aerospace and defense - Year-over-year growth 2023-2028 (%)
- Exhibits63: Data Table on Aerospace and defense - Year-over-year growth 2023-2028 (%)
- Exhibits64: Chart on Automotive - Market size and forecast 2023-2028 ($ million)
- Exhibits65: Data Table on Automotive - Market size and forecast 2023-2028 ($ million)
- Exhibits66: Chart on Automotive - Year-over-year growth 2023-2028 (%)
- Exhibits67: Data Table on Automotive - Year-over-year growth 2023-2028 (%)
- Exhibits68: Chart on Oil and gas - Market size and forecast 2023-2028 ($ million)
- Exhibits69: Data Table on Oil and gas - Market size and forecast 2023-2028 ($ million)
- Exhibits70: Chart on Oil and gas - Year-over-year growth 2023-2028 (%)
- Exhibits71: Data Table on Oil and gas - Year-over-year growth 2023-2028 (%)
- Exhibits72: Chart on Healthcare - Market size and forecast 2023-2028 ($ million)
- Exhibits73: Data Table on Healthcare - Market size and forecast 2023-2028 ($ million)
- Exhibits74: Chart on Healthcare - Year-over-year growth 2023-2028 (%)
- Exhibits75: Data Table on Healthcare - Year-over-year growth 2023-2028 (%)
- Exhibits76: Chart on Others - Market size and forecast 2023-2028 ($ million)
- Exhibits77: Data Table on Others - Market size and forecast 2023-2028 ($ million)
- Exhibits78: Chart on Others - Year-over-year growth 2023-2028 (%)
- Exhibits79: Data Table on Others - Year-over-year growth 2023-2028 (%)
- Exhibits80: Market opportunity by Application ($ million)
- Exhibits81: Data Table on Market opportunity by Application ($ million)
- Exhibits82: Analysis of price sensitivity, lifecycle, customer purchase basket, adoption rates, and purchase criteria
- Exhibits83: Chart on Market share By Geographical Landscape 2023-2028 (%)
- Exhibits84: Data Table on Market share By Geographical Landscape 2023-2028 (%)
- Exhibits85: Chart on Geographic comparison
- Exhibits86: Data Table on Geographic comparison
- Exhibits87: Chart on Europe - Market size and forecast 2023-2028 ($ million)
- Exhibits88: Data Table on Europe - Market size and forecast 2023-2028 ($ million)
- Exhibits89: Chart on Europe - Year-over-year growth 2023-2028 (%)
- Exhibits90: Data Table on Europe - Year-over-year growth 2023-2028 (%)
- Exhibits91: Chart on North America - Market size and forecast 2023-2028 ($ million)
- Exhibits92: Data Table on North America - Market size and forecast 2023-2028 ($ million)
- Exhibits93: Chart on North America - Year-over-year growth 2023-2028 (%)
- Exhibits94: Data Table on North America - Year-over-year growth 2023-2028 (%)
- Exhibits95: Chart on APAC - Market size and forecast 2023-2028 ($ million)
- Exhibits96: Data Table on APAC - Market size and forecast 2023-2028 ($ million)
- Exhibits97: Chart on APAC - Year-over-year growth 2023-2028 (%)
- Exhibits98: Data Table on APAC - Year-over-year growth 2023-2028 (%)
- Exhibits99: Chart on Middle East and Africa - Market size and forecast 2023-2028 ($ million)
- Exhibits100: Data Table on Middle East and Africa - Market size and forecast 2023-2028 ($ million)
- Exhibits101: Chart on Middle East and Africa - Year-over-year growth 2023-2028 (%)
- Exhibits102: Data Table on Middle East and Africa - Year-over-year growth 2023-2028 (%)
- Exhibits103: Chart on South America - Market size and forecast 2023-2028 ($ million)
- Exhibits104: Data Table on South America - Market size and forecast 2023-2028 ($ million)
- Exhibits105: Chart on South America - Year-over-year growth 2023-2028 (%)
- Exhibits106: Data Table on South America - Year-over-year growth 2023-2028 (%)
- Exhibits107: Chart on US - Market size and forecast 2023-2028 ($ million)
- Exhibits108: Data Table on US - Market size and forecast 2023-2028 ($ million)
- Exhibits109: Chart on US - Year-over-year growth 2023-2028 (%)
- Exhibits110: Data Table on US - Year-over-year growth 2023-2028 (%)
- Exhibits111: Chart on UK - Market size and forecast 2023-2028 ($ million)
- Exhibits112: Data Table on UK - Market size and forecast 2023-2028 ($ million)
- Exhibits113: Chart on UK - Year-over-year growth 2023-2028 (%)
- Exhibits114: Data Table on UK - Year-over-year growth 2023-2028 (%)
- Exhibits115: Chart on China - Market size and forecast 2023-2028 ($ million)
- Exhibits116: Data Table on China - Market size and forecast 2023-2028 ($ million)
- Exhibits117: Chart on China - Year-over-year growth 2023-2028 (%)
- Exhibits118: Data Table on China - Year-over-year growth 2023-2028 (%)
- Exhibits119: Chart on Germany - Market size and forecast 2023-2028 ($ million)
- Exhibits120: Data Table on Germany - Market size and forecast 2023-2028 ($ million)
- Exhibits121: Chart on Germany - Year-over-year growth 2023-2028 (%)
- Exhibits122: Data Table on Germany - Year-over-year growth 2023-2028 (%)
- Exhibits123: Chart on Japan - Market size and forecast 2023-2028 ($ million)
- Exhibits124: Data Table on Japan - Market size and forecast 2023-2028 ($ million)
- Exhibits125: Chart on Japan - Year-over-year growth 2023-2028 (%)
- Exhibits126: Data Table on Japan - Year-over-year growth 2023-2028 (%)
- Exhibits127: Market opportunity By Geographical Landscape ($ million)
- Exhibits128: Data Tables on Market opportunity By Geographical Landscape ($ million)
- Exhibits129: Impact of drivers and challenges in 2023 and 2028
- Exhibits130: Overview on Criticality of inputs and Factors of differentiation
- Exhibits131: Overview on factors of disruption
- Exhibits132: Impact of key risks on business
- Exhibits133: Vendors covered
- Exhibits134: Matrix on vendor position and classification
- Exhibits135: ADVA Optical Networking SE - Overview
- Exhibits136: ADVA Optical Networking SE - Product / Service
- Exhibits137: ADVA Optical Networking SE - Key offerings
- Exhibits138: AOSense Inc. - Overview
- Exhibits139: AOSense Inc. - Product / Service
- Exhibits140: AOSense Inc. - Key offerings
- Exhibits141: Apogee Instruments Inc. - Overview
- Exhibits142: Apogee Instruments Inc. - Product / Service
- Exhibits143: Apogee Instruments Inc. - Key offerings
- Exhibits144: Biospherical Instruments Inc. - Overview
- Exhibits145: Biospherical Instruments Inc. - Product / Service
- Exhibits146: Biospherical Instruments Inc. - Key offerings
- Exhibits147: GWR Instruments Inc. - Overview
- Exhibits148: GWR Instruments Inc. - Product / Service
- Exhibits149: GWR Instruments Inc. - Key offerings
- Exhibits150: Impedans Ltd. - Overview
- Exhibits151: Impedans Ltd. - Product / Service
- Exhibits152: Impedans Ltd. - Key offerings
- Exhibits153: Irradian Ltd. - Overview
- Exhibits154: Irradian Ltd. - Product / Service
- Exhibits155: Irradian Ltd. - Key offerings
- Exhibits156: Kipp and Zonen BV - Overview
- Exhibits157: Kipp and Zonen BV - Product / Service
- Exhibits158: Kipp and Zonen BV - Key offerings
- Exhibits159: LI COR Inc. - Overview
- Exhibits160: LI COR Inc. - Product / Service
- Exhibits161: LI COR Inc. - Key news
- Exhibits162: LI COR Inc. - Key offerings
- Exhibits163: M Squared Lasers Ltd. - Overview
- Exhibits164: M Squared Lasers Ltd. - Product / Service
- Exhibits165: M Squared Lasers Ltd. - Key offerings
- Exhibits166: Mesotech International Inc. - Overview
- Exhibits167: Mesotech International Inc. - Product / Service
- Exhibits168: Mesotech International Inc. - Key offerings
- Exhibits169: Microchip Technology Inc. - Overview
- Exhibits170: Microchip Technology Inc. - Business segments
- Exhibits171: Microchip Technology Inc. - Key news
- Exhibits172: Microchip Technology Inc. - Key offerings
- Exhibits173: Microchip Technology Inc. - Segment focus
- Exhibits174: Muquans - Overview
- Exhibits175: Muquans - Product / Service
- Exhibits176: Muquans - Key offerings
- Exhibits177: OTT HydroMet GmbH - Overview
- Exhibits178: OTT HydroMet GmbH - Product / Service
- Exhibits179: OTT HydroMet GmbH - Key offerings
- Exhibits180: Skye Instruments Ltd. - Overview
- Exhibits181: Skye Instruments Ltd. - Product / Service
- Exhibits182: Skye Instruments Ltd. - Key offerings
- Exhibits183: Inclusions checklist
- Exhibits184: Exclusions checklist
- Exhibits185: Currency conversion rates for US$
- Exhibits186: Research methodology
- Exhibits187: Validation techniques employed for market sizing
- Exhibits188: Information sources
- Exhibits189: List of abbreviations
The quantum sensors market is forecasted to grow by USD 560.5 mn during 2023-2028, accelerating at a CAGR of 13.47% during the forecast period. The report on the quantum sensors market provides a holistic analysis, market size and forecast, trends, growth drivers, and challenges, as well as vendor analysis covering around 25 vendors.
The report offers an up-to-date analysis regarding the current market scenario, the latest trends and drivers, and the overall market environment. The market is driven by growing focus on quantum computing research in universities, increasing government initiatives and funding programs on quantum technology research and development, and rising demand for quantum sensors in environmental monitoring.
Technavio's quantum sensors market is segmented as below:
| Market Scope | |
|---|---|
| Base Year | 2024 |
| End Year | 2028 |
| Series Year | 2024-2028 |
| Growth Momentum | Accelerate |
| YOY 2024 | 12.39% |
| CAGR | 13.47% |
| Incremental Value | $560.5mn |
By Product
- Atomic clocks
- PAR quantum sensors
- Gravity sensors
- Magnetic sensors
- Others
By Application
- Aerospace and defense
- Automotive
- Oil and gas
- Healthcare
- Others
By Geographical Landscape
- Europe
- North America
- APAC
- Middle East and Africa
- South America
This study identifies the increasing developments and investments in quantum sensor industries as one of the prime reasons driving the quantum sensors market growth during the next few years. Also, integration of AI and machine learning in quantum sensors and miniaturization and integration of quantum sensors into existing systems and devices will lead to sizable demand in the market.
The report on the quantum sensors market covers the following areas:
- Quantum sensors market sizing
- Quantum sensors market forecast
- Quantum sensors market industry analysis
The robust vendor analysis is designed to help clients improve their market position, and in line with this, this report provides a detailed analysis of several leading quantum sensors market vendors that include ADVA Optical Networking SE, AOSense Inc., Apogee Instruments Inc., Biospherical Instruments Inc., GWR Instruments Inc., Impedans Ltd., Irradian Ltd., Kipp and Zonen BV, LI COR Inc., M Squared Lasers Ltd., Mesotech International Inc., Muquans, OTT HydroMet GmbH, Robert Bosch GmbH, Sea Bird Scientific, Skye Instruments Ltd., Spectrum Technologies Inc., Virtual Hydromet, and Microchip Technology Inc.. Also, the quantum sensors market analysis report includes information on upcoming trends and challenges that will influence market growth. This is to help companies strategize and leverage all forthcoming growth opportunities.
The study was conducted using an objective combination of primary and secondary information including inputs from key participants in the industry. The report contains a comprehensive market and vendor landscape in addition to an analysis of the key vendors.
The publisher presents a detailed picture of the market by the way of study, synthesis, and summation of data from multiple sources by an analysis of key parameters such as profit, pricing, competition, and promotions. It presents various market facets by identifying the key industry influencers. The data presented is comprehensive, reliable, and a result of extensive research - both primary and secondary. The market research reports provide a complete competitive landscape and an in-depth vendor selection methodology and analysis using qualitative and quantitative research to forecast the accurate market growth.
Table of Contents
1 Executive Summary
- 1.1 Market overview
2 Market Landscape
- 2.1 Market ecosystem
3 Market Sizing
- 3.1 Market definition
- 3.2 Market segment analysis
- 3.3 Market size 2023
- 3.4 Market outlook: Forecast for 2023-2028
4 Historic Market Size
- 4.1 Global quantum sensors market 2018 - 2022
- 4.2 Product Segment Analysis 2018 - 2022
- 4.3 Application Segment Analysis 2018 - 2022
- 4.4 Geography Segment Analysis 2018 - 2022
- 4.5 Country Segment Analysis 2018 - 2022
5 Five Forces Analysis
- 5.1 Five forces summary
- 5.2 Bargaining power of buyers
- 5.3 Bargaining power of suppliers
- 5.4 Threat of new entrants
- 5.5 Threat of substitutes
- 5.6 Threat of rivalry
- 5.7 Market condition
6 Market Segmentation by Product
- 6.1 Market segments
- 6.2 Comparison by Product
- 6.3 Atomic clocks - Market size and forecast 2023-2028
- 6.4 PAR quantum sensors - Market size and forecast 2023-2028
- 6.5 Gravity sensors - Market size and forecast 2023-2028
- 6.6 Magnetic sensors - Market size and forecast 2023-2028
- 6.7 Others - Market size and forecast 2023-2028
- 6.8 Market opportunity by Product
7 Market Segmentation by Application
- 7.1 Market segments
- 7.2 Comparison by Application
- 7.3 Aerospace and defense - Market size and forecast 2023-2028
- 7.4 Automotive - Market size and forecast 2023-2028
- 7.5 Oil and gas - Market size and forecast 2023-2028
- 7.6 Healthcare - Market size and forecast 2023-2028
- 7.7 Others - Market size and forecast 2023-2028
- 7.8 Market opportunity by Application
8 Customer Landscape
- 8.1 Customer landscape overview
9 Geographic Landscape
- 9.1 Geographic segmentation
- 9.2 Geographic comparison
- 9.3 Europe - Market size and forecast 2023-2028
- 9.4 North America - Market size and forecast 2023-2028
- 9.5 APAC - Market size and forecast 2023-2028
- 9.6 Middle East and Africa - Market size and forecast 2023-2028
- 9.7 South America - Market size and forecast 2023-2028
- 9.8 US - Market size and forecast 2023-2028
- 9.9 UK - Market size and forecast 2023-2028
- 9.10 China - Market size and forecast 2023-2028
- 9.11 Germany - Market size and forecast 2023-2028
- 9.12 Japan - Market size and forecast 2023-2028
- 9.13 Market opportunity By Geographical Landscape
10 Drivers, Challenges, and Trends
- 10.1 Market drivers
- 10.2 Market challenges
- 10.3 Impact of drivers and challenges
- 10.4 Market trends
11 Vendor Landscape
- 11.1 Overview
- 11.2 Vendor landscape
- 11.3 Landscape disruption
- 11.4 Industry risks
12 Vendor Analysis
- 12.1 Vendors covered
- 12.2 Market positioning of vendors
- 12.3 ADVA Optical Networking SE
- 12.4 AOSense Inc.
- 12.5 Apogee Instruments Inc.
- 12.6 Biospherical Instruments Inc.
- 12.7 GWR Instruments Inc.
- 12.8 Impedans Ltd.
- 12.9 Irradian Ltd.
- 12.10 Kipp and Zonen BV
- 12.11 LI COR Inc.
- 12.12 M Squared Lasers Ltd.
- 12.13 Mesotech International Inc.
- 12.14 Microchip Technology Inc.
- 12.15 Muquans
- 12.16 OTT HydroMet GmbH
- 12.17 Skye Instruments Ltd.
13 Appendix
- 13.1 Scope of the report
- 13.2 Inclusions and exclusions checklist
- 13.3 Currency conversion rates for US$
- 13.4 Research methodology
- 13.5 List of abbreviations

