|
|
市場調査レポート
商品コード
1732670
自動車用スノーチェーンの世界市場 2025~2029年Global Automotive Snow Chain Market 2025-2029 |
||||||

|
|||||||
カスタマイズ可能
|
|||||||

| 自動車用スノーチェーンの世界市場 2025~2029年 |
|
出版日: 2025年05月16日
発行: TechNavio
ページ情報: 英文 215 Pages
納期: 即納可能
|

全表示
- 概要
- 図表
- 目次
自動車用スノーチェーン市場は2024-2029年に9,500万米ドル、予測期間中のCAGRは3.3%で成長すると予測されます。
当レポートでは、自動車用スノーチェーン市場の全体的な分析、市場規模・予測、動向、成長促進要因、課題、約25のベンダーを網羅したベンダー分析などを掲載しています。
現在の市場シナリオ、最新動向と促進要因、市場環境全体に関する最新分析を提供しています。市場は、自動車用スノーチェーンの使用を義務付ける厳しい冬季交通安全規制、自動車用スノーチェーン技術の進歩、スノーチェーン製造における軽量素材の人気の高まりによって牽引されています。
| 市場範囲 | |
|---|---|
| 基準年 | 2025 |
| 終了年 | 2029 |
| 予測期間 | 2025-2029 |
| 成長モメンタム | 加速 |
| 前年比 | 3.2% |
| CAGR | 3.3% |
| 増分額 | 9,500万米ドル |
本調査は、業界の主要参加者からのインプットを含め、一次情報と二次情報を客観的に組み合わせて実施しました。レポートには、主要企業の分析に加え、包括的な市場規模データ、地域別分析によるセグメント、ベンダー情勢が含まれています。レポートには過去データと予測データがあります。
本調査では、自動車用スノーチェーンへのスマート技術の統合が、今後数年間の自動車用スノーチェーン市場の成長を促進する主要な理由の1つであると特定しています。また、様々な車種向けにカスタマイズされた自動車用スノーチェーンの採用が増加し、小売市場の情勢が変化していることも、市場の大きな需要につながると考えられます。
目次
第1章 エグゼクティブサマリー
- 市場概要
第2章 Technavio分析
- 価格・ライフサイクル・顧客購入バスケット・採用率・購入基準の分析
- インプットの重要性と差別化の要因
- 混乱の要因
- 促進要因と課題の影響
第3章 市場情勢
- 市場エコシステム
- 市場の特徴
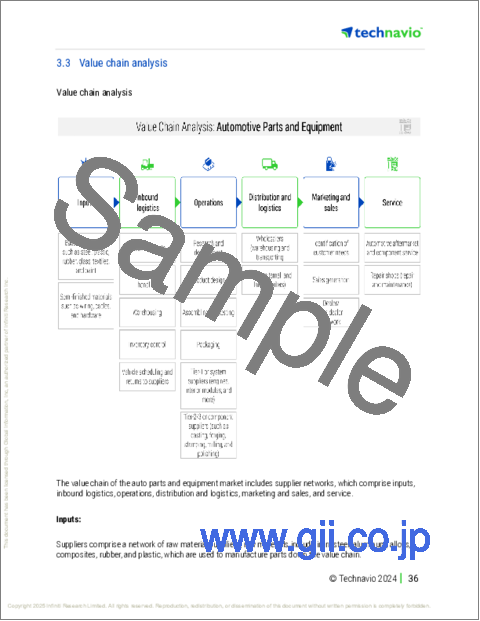
- バリューチェーン分析
第4章 市場規模
- 市場の定義
- 市場セグメント分析
- 市場規模 2024
- 市場の見通し 2024-2029
第5章 市場規模実績
- 自動車用スノーチェーンの世界市場 2019-2023
- タイプ別セグメント分析 2019-2023
- 素材別セグメント分析 2019-2023
- 製品タイプ別セグメント分析 2019-2023
- 地域別セグメント分析 2019-2023
- 国別セグメント分析 2019-2023
第6章 定性分析
- AIの影響:自動車用スノーチェーンの世界市場
第7章 ファイブフォース分析
- ファイブフォースの要約
- 買い手の交渉力
- 供給企業の交渉力
- 新規参入業者の脅威
- 代替品の脅威
- 競争の脅威
- 市況
第8章 市場セグメンテーション:タイプ別
- 市場セグメント
- 比較:タイプ別
- 乗用車:市場規模と予測 2024-2029
- 商用車:市場規模と予測 2024-2029
- 市場機会:タイプ別
第9章 市場セグメンテーション:素材別
- 市場セグメント
- 比較:素材別
- 金属:市場規模と予測 2024-2029
- 非金属:市場規模と予測 2024-2029
- 市場機会:素材別
第10章 市場セグメンテーション:製品タイプ別
- 市場セグメント
- 比較:製品タイプ別
- スタッド付きスノーチェーン:市場規模と予測 2024-2029
- スタッドレスタイヤチェーン:市場規模と予測 2024-2029
- ケーブルスノーチェーン:市場規模と予測 2024-2029
- ラダースノーチェーン:市場規模と予測 2024-2029
- 市場機会:製品タイプ別
第11章 顧客情勢
- 顧客情勢の概要
第12章 地域別情勢
- 地域別セグメンテーション
- 地域別比較
- 北米:市場規模と予測 2024-2029
- 欧州:市場規模と予測 2024-2029
- アジア太平洋:市場規模と予測 2024-2029
- 南米:市場規模と予測 2024-2029
- 中東・アフリカ:市場規模と予測 2024-2029
- 米国:市場規模と予測 2024-2029
- カナダ:市場規模と予測 2024-2029
- 中国:市場規模と予測 2024-2029
- ドイツ:市場規模と予測 2024-2029
- フランス:市場規模と予測 2024-2029
- メキシコ:市場規模と予測 2024-2029
- 日本:市場規模と予測 2024-2029
- 英国:市場規模と予測 2024-2029
- インド:市場規模と予測 2024-2029
- イタリア:市場規模と予測 2024-2029
- 市場機会:地域情勢別
第13章 促進要因・課題・機会・抑制要因
- 市場促進要因
- 市場の課題
- 促進要因と課題の影響
- 市場の機会・抑制要因
第14章 競合情勢
- 概要
- 競合情勢
- 混乱の状況
- 業界のリスク
第15章 競合分析
- 企業プロファイル
- 企業ランキング指数
- 企業の市場ポジショニング
- Ferreterro India Pvt Ltd.
- Hilifting
- Jinhua Luxiang Chain Co. Ltd.
- JOUBERT GROUP
- Laclede Chain Manufacturing Co. LLC
- LeMans Corp.
- Maggi Group
- Michelin Group
- Nordic Traction Group
- Ottinger GmbH
- Pewag International GmbH
- RUD Ketten Rieger and Dietz GmbH u. Co. KG
- Spikes Spider
- Veriga KF doo.
- Volvo Car Corp.
第16章 付録
Exhibits:
- Exhibits1: Executive Summary - Chart on Market Overview
- Exhibits2: Executive Summary - Data Table on Market Overview
- Exhibits3: Executive Summary - Chart on Global Market Characteristics
- Exhibits4: Executive Summary - Chart on Market By Geographical Landscape
- Exhibits5: Executive Summary - Chart on Market Segmentation by Type
- Exhibits6: Executive Summary - Chart on Market Segmentation by Material
- Exhibits7: Executive Summary - Chart on Market Segmentation by Product Type
- Exhibits8: Executive Summary - Chart on Incremental Growth
- Exhibits9: Executive Summary - Data Table on Incremental Growth
- Exhibits10: Executive Summary - Chart on Company Market Positioning
- Exhibits11: Analysis of price sensitivity, lifecycle, customer purchase basket, adoption rates, and purchase criteria
- Exhibits12: Overview on criticality of inputs and factors of differentiation
- Exhibits13: Overview on factors of disruption
- Exhibits14: Impact of drivers and challenges in 2024 and 2029
- Exhibits15: Parent Market
- Exhibits16: Data Table on - Parent Market
- Exhibits17: Market characteristics analysis
- Exhibits18: Value chain analysis
- Exhibits19: Offerings of companies included in the market definition
- Exhibits20: Market segments
- Exhibits21: Chart on Global - Market size and forecast 2024-2029 ($ million)
- Exhibits22: Data Table on Global - Market size and forecast 2024-2029 ($ million)
- Exhibits23: Chart on Global Market: Year-over-year growth 2024-2029 (%)
- Exhibits24: Data Table on Global Market: Year-over-year growth 2024-2029 (%)
- Exhibits25: Historic Market Size - Data Table on Global Automotive Snow Chain Market 2019 - 2023 ($ million)
- Exhibits26: Historic Market Size - Type Segment 2019 - 2023 ($ million)
- Exhibits27: Historic Market Size - Material Segment 2019 - 2023 ($ million)
- Exhibits28: Historic Market Size - Product Type Segment 2019 - 2023 ($ million)
- Exhibits29: Historic Market Size - Geography Segment 2019 - 2023 ($ million)
- Exhibits30: Historic Market Size - Country Segment 2019 - 2023 ($ million)
- Exhibits31: Five forces analysis - Comparison between 2024 and 2029
- Exhibits32: Bargaining power of buyers - Impact of key factors 2024 and 2029
- Exhibits33: Bargaining power of suppliers - Impact of key factors in 2024 and 2029
- Exhibits34: Threat of new entrants - Impact of key factors in 2024 and 2029
- Exhibits35: Threat of substitutes - Impact of key factors in 2024 and 2029
- Exhibits36: Threat of rivalry - Impact of key factors in 2024 and 2029
- Exhibits37: Chart on Market condition - Five forces 2024 and 2029
- Exhibits38: Chart on Type - Market share 2024-2029 (%)
- Exhibits39: Data Table on Type - Market share 2024-2029 (%)
- Exhibits40: Chart on Comparison by Type
- Exhibits41: Data Table on Comparison by Type
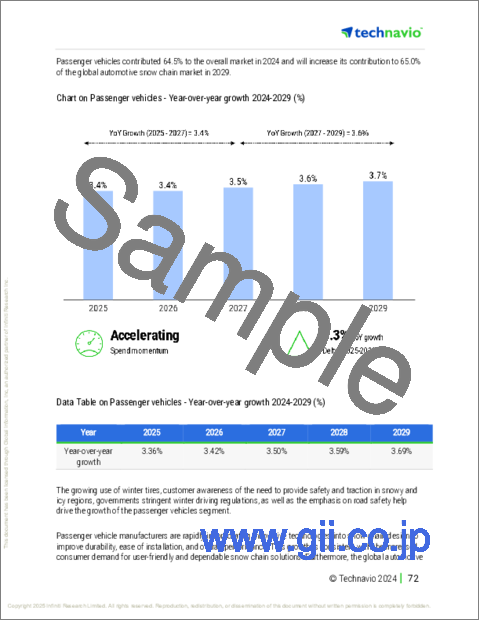
- Exhibits42: Chart on Passenger vehicles - Market size and forecast 2024-2029 ($ million)
- Exhibits43: Data Table on Passenger vehicles - Market size and forecast 2024-2029 ($ million)
- Exhibits44: Chart on Passenger vehicles - Year-over-year growth 2024-2029 (%)
- Exhibits45: Data Table on Passenger vehicles - Year-over-year growth 2024-2029 (%)
- Exhibits46: Chart on Commercial vehicles - Market size and forecast 2024-2029 ($ million)
- Exhibits47: Data Table on Commercial vehicles - Market size and forecast 2024-2029 ($ million)
- Exhibits48: Chart on Commercial vehicles - Year-over-year growth 2024-2029 (%)
- Exhibits49: Data Table on Commercial vehicles - Year-over-year growth 2024-2029 (%)
- Exhibits50: Market opportunity by Type ($ million)
- Exhibits51: Data Table on Market opportunity by Type ($ million)
- Exhibits52: Chart on Material - Market share 2024-2029 (%)
- Exhibits53: Data Table on Material - Market share 2024-2029 (%)
- Exhibits54: Chart on Comparison by Material
- Exhibits55: Data Table on Comparison by Material
- Exhibits56: Chart on Metal - Market size and forecast 2024-2029 ($ million)
- Exhibits57: Data Table on Metal - Market size and forecast 2024-2029 ($ million)
- Exhibits58: Chart on Metal - Year-over-year growth 2024-2029 (%)
- Exhibits59: Data Table on Metal - Year-over-year growth 2024-2029 (%)
- Exhibits60: Chart on Non-metal - Market size and forecast 2024-2029 ($ million)
- Exhibits61: Data Table on Non-metal - Market size and forecast 2024-2029 ($ million)
- Exhibits62: Chart on Non-metal - Year-over-year growth 2024-2029 (%)
- Exhibits63: Data Table on Non-metal - Year-over-year growth 2024-2029 (%)
- Exhibits64: Market opportunity by Material ($ million)
- Exhibits65: Data Table on Market opportunity by Material ($ million)
- Exhibits66: Chart on Product Type - Market share 2024-2029 (%)
- Exhibits67: Data Table on Product Type - Market share 2024-2029 (%)
- Exhibits68: Chart on Comparison by Product Type
- Exhibits69: Data Table on Comparison by Product Type
- Exhibits70: Chart on Studded snow chains - Market size and forecast 2024-2029 ($ million)
- Exhibits71: Data Table on Studded snow chains - Market size and forecast 2024-2029 ($ million)
- Exhibits72: Chart on Studded snow chains - Year-over-year growth 2024-2029 (%)
- Exhibits73: Data Table on Studded snow chains - Year-over-year growth 2024-2029 (%)
- Exhibits74: Chart on Non-studded snow chains - Market size and forecast 2024-2029 ($ million)
- Exhibits75: Data Table on Non-studded snow chains - Market size and forecast 2024-2029 ($ million)
- Exhibits76: Chart on Non-studded snow chains - Year-over-year growth 2024-2029 (%)
- Exhibits77: Data Table on Non-studded snow chains - Year-over-year growth 2024-2029 (%)
- Exhibits78: Chart on Cable snow chains - Market size and forecast 2024-2029 ($ million)
- Exhibits79: Data Table on Cable snow chains - Market size and forecast 2024-2029 ($ million)
- Exhibits80: Chart on Cable snow chains - Year-over-year growth 2024-2029 (%)
- Exhibits81: Data Table on Cable snow chains - Year-over-year growth 2024-2029 (%)
- Exhibits82: Chart on Ladder snow chains - Market size and forecast 2024-2029 ($ million)
- Exhibits83: Data Table on Ladder snow chains - Market size and forecast 2024-2029 ($ million)
- Exhibits84: Chart on Ladder snow chains - Year-over-year growth 2024-2029 (%)
- Exhibits85: Data Table on Ladder snow chains - Year-over-year growth 2024-2029 (%)
- Exhibits86: Market opportunity by Product Type ($ million)
- Exhibits87: Data Table on Market opportunity by Product Type ($ million)
- Exhibits88: Analysis of price sensitivity, lifecycle, customer purchase basket, adoption rates, and purchase criteria
- Exhibits89: Chart on Market share By Geographical Landscape 2024-2029 (%)
- Exhibits90: Data Table on Market share By Geographical Landscape 2024-2029 (%)
- Exhibits91: Chart on Geographic comparison
- Exhibits92: Data Table on Geographic comparison
- Exhibits93: Chart on North America - Market size and forecast 2024-2029 ($ million)
- Exhibits94: Data Table on North America - Market size and forecast 2024-2029 ($ million)
- Exhibits95: Chart on North America - Year-over-year growth 2024-2029 (%)
- Exhibits96: Data Table on North America - Year-over-year growth 2024-2029 (%)
- Exhibits97: Chart on Europe - Market size and forecast 2024-2029 ($ million)
- Exhibits98: Data Table on Europe - Market size and forecast 2024-2029 ($ million)
- Exhibits99: Chart on Europe - Year-over-year growth 2024-2029 (%)
- Exhibits100: Data Table on Europe - Year-over-year growth 2024-2029 (%)
- Exhibits101: Chart on APAC - Market size and forecast 2024-2029 ($ million)
- Exhibits102: Data Table on APAC - Market size and forecast 2024-2029 ($ million)
- Exhibits103: Chart on APAC - Year-over-year growth 2024-2029 (%)
- Exhibits104: Data Table on APAC - Year-over-year growth 2024-2029 (%)
- Exhibits105: Chart on South America - Market size and forecast 2024-2029 ($ million)
- Exhibits106: Data Table on South America - Market size and forecast 2024-2029 ($ million)
- Exhibits107: Chart on South America - Year-over-year growth 2024-2029 (%)
- Exhibits108: Data Table on South America - Year-over-year growth 2024-2029 (%)
- Exhibits109: Chart on Middle East and Africa - Market size and forecast 2024-2029 ($ million)
- Exhibits110: Data Table on Middle East and Africa - Market size and forecast 2024-2029 ($ million)
- Exhibits111: Chart on Middle East and Africa - Year-over-year growth 2024-2029 (%)
- Exhibits112: Data Table on Middle East and Africa - Year-over-year growth 2024-2029 (%)
- Exhibits113: Chart on US - Market size and forecast 2024-2029 ($ million)
- Exhibits114: Data Table on US - Market size and forecast 2024-2029 ($ million)
- Exhibits115: Chart on US - Year-over-year growth 2024-2029 (%)
- Exhibits116: Data Table on US - Year-over-year growth 2024-2029 (%)
- Exhibits117: Chart on Canada - Market size and forecast 2024-2029 ($ million)
- Exhibits118: Data Table on Canada - Market size and forecast 2024-2029 ($ million)
- Exhibits119: Chart on Canada - Year-over-year growth 2024-2029 (%)
- Exhibits120: Data Table on Canada - Year-over-year growth 2024-2029 (%)
- Exhibits121: Chart on China - Market size and forecast 2024-2029 ($ million)
- Exhibits122: Data Table on China - Market size and forecast 2024-2029 ($ million)
- Exhibits123: Chart on China - Year-over-year growth 2024-2029 (%)
- Exhibits124: Data Table on China - Year-over-year growth 2024-2029 (%)
- Exhibits125: Chart on Germany - Market size and forecast 2024-2029 ($ million)
- Exhibits126: Data Table on Germany - Market size and forecast 2024-2029 ($ million)
- Exhibits127: Chart on Germany - Year-over-year growth 2024-2029 (%)
- Exhibits128: Data Table on Germany - Year-over-year growth 2024-2029 (%)
- Exhibits129: Chart on France - Market size and forecast 2024-2029 ($ million)
- Exhibits130: Data Table on France - Market size and forecast 2024-2029 ($ million)
- Exhibits131: Chart on France - Year-over-year growth 2024-2029 (%)
- Exhibits132: Data Table on France - Year-over-year growth 2024-2029 (%)
- Exhibits133: Chart on Mexico - Market size and forecast 2024-2029 ($ million)
- Exhibits134: Data Table on Mexico - Market size and forecast 2024-2029 ($ million)
- Exhibits135: Chart on Mexico - Year-over-year growth 2024-2029 (%)
- Exhibits136: Data Table on Mexico - Year-over-year growth 2024-2029 (%)
- Exhibits137: Chart on Japan - Market size and forecast 2024-2029 ($ million)
- Exhibits138: Data Table on Japan - Market size and forecast 2024-2029 ($ million)
- Exhibits139: Chart on Japan - Year-over-year growth 2024-2029 (%)
- Exhibits140: Data Table on Japan - Year-over-year growth 2024-2029 (%)
- Exhibits141: Chart on UK - Market size and forecast 2024-2029 ($ million)
- Exhibits142: Data Table on UK - Market size and forecast 2024-2029 ($ million)
- Exhibits143: Chart on UK - Year-over-year growth 2024-2029 (%)
- Exhibits144: Data Table on UK - Year-over-year growth 2024-2029 (%)
- Exhibits145: Chart on India - Market size and forecast 2024-2029 ($ million)
- Exhibits146: Data Table on India - Market size and forecast 2024-2029 ($ million)
- Exhibits147: Chart on India - Year-over-year growth 2024-2029 (%)
- Exhibits148: Data Table on India - Year-over-year growth 2024-2029 (%)
- Exhibits149: Chart on Italy - Market size and forecast 2024-2029 ($ million)
- Exhibits150: Data Table on Italy - Market size and forecast 2024-2029 ($ million)
- Exhibits151: Chart on Italy - Year-over-year growth 2024-2029 (%)
- Exhibits152: Data Table on Italy - Year-over-year growth 2024-2029 (%)
- Exhibits153: Market opportunity By Geographical Landscape ($ million)
- Exhibits154: Data Tables on Market opportunity By Geographical Landscape ($ million)
- Exhibits155: Impact of drivers and challenges in 2024 and 2029
- Exhibits156: Overview on criticality of inputs and factors of differentiation
- Exhibits157: Overview on factors of disruption
- Exhibits158: Impact of key risks on business
- Exhibits159: Companies covered
- Exhibits160: Company ranking index
- Exhibits161: Matrix on companies position and classification
- Exhibits162: Ferreterro India Pvt Ltd. - Overview
- Exhibits163: Ferreterro India Pvt Ltd. - Product / Service
- Exhibits164: Ferreterro India Pvt Ltd. - Key offerings
- Exhibits165: SWOT
- Exhibits166: Hilifting - Overview
- Exhibits167: Hilifting - Product / Service
- Exhibits168: Hilifting - Key offerings
- Exhibits169: SWOT
- Exhibits170: Jinhua Luxiang Chain Co. Ltd. - Overview
- Exhibits171: Jinhua Luxiang Chain Co. Ltd. - Product / Service
- Exhibits172: Jinhua Luxiang Chain Co. Ltd. - Key offerings
- Exhibits173: SWOT
- Exhibits174: JOUBERT GROUP - Overview
- Exhibits175: JOUBERT GROUP - Product / Service
- Exhibits176: JOUBERT GROUP - Key offerings
- Exhibits177: SWOT
- Exhibits178: Laclede Chain Manufacturing Co. LLC - Overview
- Exhibits179: Laclede Chain Manufacturing Co. LLC - Product / Service
- Exhibits180: Laclede Chain Manufacturing Co. LLC - Key offerings
- Exhibits181: SWOT
- Exhibits182: LeMans Corp. - Overview
- Exhibits183: LeMans Corp. - Product / Service
- Exhibits184: LeMans Corp. - Key offerings
- Exhibits185: SWOT
- Exhibits186: Maggi Group - Overview
- Exhibits187: Maggi Group - Product / Service
- Exhibits188: Maggi Group - Key offerings
- Exhibits189: SWOT
- Exhibits190: Michelin Group - Overview
- Exhibits191: Michelin Group - Business segments
- Exhibits192: Michelin Group - Key news
- Exhibits193: Michelin Group - Key offerings
- Exhibits194: Michelin Group - Segment focus
- Exhibits195: SWOT
- Exhibits196: Nordic Traction Group - Overview
- Exhibits197: Nordic Traction Group - Product / Service
- Exhibits198: Nordic Traction Group - Key offerings
- Exhibits199: SWOT
- Exhibits200: Ottinger GmbH - Overview
- Exhibits201: Ottinger GmbH - Product / Service
- Exhibits202: Ottinger GmbH - Key offerings
- Exhibits203: SWOT
- Exhibits204: Pewag International GmbH - Overview
- Exhibits205: Pewag International GmbH - Product / Service
- Exhibits206: Pewag International GmbH - Key offerings
- Exhibits207: SWOT
- Exhibits208: RUD Ketten Rieger and Dietz GmbH u. Co. KG - Overview
- Exhibits209: RUD Ketten Rieger and Dietz GmbH u. Co. KG - Product / Service
- Exhibits210: RUD Ketten Rieger and Dietz GmbH u. Co. KG - Key offerings
- Exhibits211: SWOT
- Exhibits212: Spikes Spider - Overview
- Exhibits213: Spikes Spider - Product / Service
- Exhibits214: Spikes Spider - Key offerings
- Exhibits215: SWOT
- Exhibits216: Veriga KF doo. - Overview
- Exhibits217: Veriga KF doo. - Product / Service
- Exhibits218: Veriga KF doo. - Key offerings
- Exhibits219: SWOT
- Exhibits220: Volvo Car Corp. - Overview
- Exhibits221: Volvo Car Corp. - Product / Service
- Exhibits222: Volvo Car Corp. - Key offerings
- Exhibits223: SWOT
- Exhibits224: Inclusions checklist
- Exhibits225: Exclusions checklist
- Exhibits226: Currency conversion rates for US$
- Exhibits227: Research methodology
- Exhibits228: Information sources
- Exhibits229: Data validation
- Exhibits230: Validation techniques employed for market sizing
- Exhibits231: Data synthesis
- Exhibits232: 360 degree market analysis
- Exhibits233: List of abbreviations
The automotive snow chain market is forecasted to grow by USD 95 mn during 2024-2029, accelerating at a CAGR of 3.3% during the forecast period. The report on the automotive snow chain market provides a holistic analysis, market size and forecast, trends, growth drivers, and challenges, as well as vendor analysis covering around 25 vendors.
The report offers an up-to-date analysis regarding the current market scenario, the latest trends and drivers, and the overall market environment. The market is driven by stringent winter road safety regulations mandating use of automotive snow chains, advancements in automotive snow chain technology, and growing popularity of lightweight materials in snow chain manufacturing.
| Market Scope | |
|---|---|
| Base Year | 2025 |
| End Year | 2029 |
| Series Year | 2025-2029 |
| Growth Momentum | Accelerate |
| YOY 2025 | 3.2% |
| CAGR | 3.3% |
| Incremental Value | $95.0 mn |
The study was conducted using an objective combination of primary and secondary information including inputs from key participants in the industry. The report contains a comprehensive market size data, segment with regional analysis and vendor landscape in addition to an analysis of the key companies. Reports have historic and forecast data.
Technavio's automotive snow chain market is segmented as below:
By Type
- Passenger vehicles
- Commercial vehicles
By Material
- Metal
- Non-metal
By Product Type
- Studded snow chains
- Non-studded snow chains
- Cable snow chains
- Ladder snow chains
By Geographical Landscape
- North America
- Europe
- APAC
- South America
- Middle East and Africa
This study identifies the integration of smart technologies into automotive snow chains as one of the prime reasons driving the automotive snow chain market growth during the next few years. Also, rising adoption of customized automotive snow chains for different vehicles and shift in retail landscape outlook will lead to sizable demand in the market.
The report on the automotive snow chain market covers the following areas:
- Automotive Snow Chain Market sizing
- Automotive Snow Chain Market forecast
- Automotive Snow Chain Market industry analysis
The robust vendor analysis is designed to help clients improve their market position, and in line with this, this report provides a detailed analysis of several leading automotive snow chain market vendors that include Dawson Group Ltd., Ferreterro India Pvt Ltd., Hilifting, Jinhua Luxiang Chain Co. Ltd., JOUBERT GROUP, Konig snow chains, Laclede Chain Manufacturing Co. LLC, LeMans Corp., Maggi Group, McGee Co., Michelin Group, Nordic Traction Group, Ottinger GmbH, Pewag International GmbH, RUD Ketten Rieger and Dietz GmbH u. Co. KG, Spikes Spider, Veriga KF doo., and Volvo Car Corp.. Also, the automotive snow chain market analysis report includes information on upcoming trends and challenges that will influence market growth. This is to help companies strategize and leverage all forthcoming growth opportunities.
The publisher presents a detailed picture of the market by the way of study, synthesis, and summation of data from multiple sources by an analysis of key parameters such as profit, pricing, competition, and promotions. It presents various market facets by identifying the key industry influencers. The data presented is comprehensive, reliable, and a result of extensive primary and secondary research. The market research reports provide a complete competitive landscape and an in-depth vendor selection methodology and analysis using qualitative and quantitative research to forecast accurate market growth.
Table of Contents
1 Executive Summary
- 1.1 Market overview
- Executive Summary - Chart on Market Overview
- Executive Summary - Data Table on Market Overview
- Executive Summary - Chart on Global Market Characteristics
- Executive Summary - Chart on Market By Geographical Landscape
- Executive Summary - Chart on Market Segmentation by Type
- Executive Summary - Chart on Market Segmentation by Material
- Executive Summary - Chart on Market Segmentation by Product Type
- Executive Summary - Chart on Incremental Growth
- Executive Summary - Data Table on Incremental Growth
- Executive Summary - Chart on Company Market Positioning
2 Technavio Analysis
- 2.1 Analysis of price sensitivity, lifecycle, customer purchase basket, adoption rates, and purchase criteria
- Analysis of price sensitivity, lifecycle, customer purchase basket, adoption rates, and purchase criteria
- 2.2 Criticality of inputs and Factors of differentiation
- Overview on criticality of inputs and factors of differentiation
- 2.3 Factors of disruption
- Overview on factors of disruption
- 2.4 Impact of drivers and challenges
- Impact of drivers and challenges in 2024 and 2029
3 Market Landscape
- 3.1 Market ecosystem
- Parent Market
- Data Table on - Parent Market
- 3.2 Market characteristics
- Market characteristics analysis
- 3.3 Value chain analysis
- Value chain analysis
4 Market Sizing
- 4.1 Market definition
- Offerings of companies included in the market definition
- 4.2 Market segment analysis
- Market segments
- 4.3 Market size 2024
- 4.4 Market outlook: Forecast for 2024-2029
- Chart on Global - Market size and forecast 2024-2029 ($ million)
- Data Table on Global - Market size and forecast 2024-2029 ($ million)
- Chart on Global Market: Year-over-year growth 2024-2029 (%)
- Data Table on Global Market: Year-over-year growth 2024-2029 (%)
5 Historic Market Size
- 5.1 Global Automotive Snow Chain Market 2019 - 2023
- Historic Market Size - Data Table on Global Automotive Snow Chain Market 2019 - 2023 ($ million)
- 5.2 Type segment analysis 2019 - 2023
- Historic Market Size - Type Segment 2019 - 2023 ($ million)
- 5.3 Material segment analysis 2019 - 2023
- Historic Market Size - Material Segment 2019 - 2023 ($ million)
- 5.4 Product Type segment analysis 2019 - 2023
- Historic Market Size - Product Type Segment 2019 - 2023 ($ million)
- 5.5 Geography segment analysis 2019 - 2023
- Historic Market Size - Geography Segment 2019 - 2023 ($ million)
- 5.6 Country segment analysis 2019 - 2023
- Historic Market Size - Country Segment 2019 - 2023 ($ million)
6 Qualitative Analysis
- 6.1 The AI impact on Global Automotive Snow Chain Market
7 Five Forces Analysis
- 7.1 Five forces summary
- Five forces analysis - Comparison between 2024 and 2029
- 7.2 Bargaining power of buyers
- Bargaining power of buyers - Impact of key factors 2024 and 2029
- 7.3 Bargaining power of suppliers
- Bargaining power of suppliers - Impact of key factors in 2024 and 2029
- 7.4 Threat of new entrants
- Threat of new entrants - Impact of key factors in 2024 and 2029
- 7.5 Threat of substitutes
- Threat of substitutes - Impact of key factors in 2024 and 2029
- 7.6 Threat of rivalry
- Threat of rivalry - Impact of key factors in 2024 and 2029
- 7.7 Market condition
- Chart on Market condition - Five forces 2024 and 2029
8 Market Segmentation by Type
- 8.1 Market segments
- Chart on Type - Market share 2024-2029 (%)
- Data Table on Type - Market share 2024-2029 (%)
- 8.2 Comparison by Type
- Chart on Comparison by Type
- Data Table on Comparison by Type
- 8.3 Passenger vehicles - Market size and forecast 2024-2029
- Chart on Passenger vehicles - Market size and forecast 2024-2029 ($ million)
- Data Table on Passenger vehicles - Market size and forecast 2024-2029 ($ million)
- Chart on Passenger vehicles - Year-over-year growth 2024-2029 (%)
- Data Table on Passenger vehicles - Year-over-year growth 2024-2029 (%)
- 8.4 Commercial vehicles - Market size and forecast 2024-2029
- Chart on Commercial vehicles - Market size and forecast 2024-2029 ($ million)
- Data Table on Commercial vehicles - Market size and forecast 2024-2029 ($ million)
- Chart on Commercial vehicles - Year-over-year growth 2024-2029 (%)
- Data Table on Commercial vehicles - Year-over-year growth 2024-2029 (%)
- 8.5 Market opportunity by Type
- Market opportunity by Type ($ million)
- Data Table on Market opportunity by Type ($ million)
9 Market Segmentation by Material
- 9.1 Market segments
- Chart on Material - Market share 2024-2029 (%)
- Data Table on Material - Market share 2024-2029 (%)
- 9.2 Comparison by Material
- Chart on Comparison by Material
- Data Table on Comparison by Material
- 9.3 Metal - Market size and forecast 2024-2029
- Chart on Metal - Market size and forecast 2024-2029 ($ million)
- Data Table on Metal - Market size and forecast 2024-2029 ($ million)
- Chart on Metal - Year-over-year growth 2024-2029 (%)
- Data Table on Metal - Year-over-year growth 2024-2029 (%)
- 9.4 Non-metal - Market size and forecast 2024-2029
- Chart on Non-metal - Market size and forecast 2024-2029 ($ million)
- Data Table on Non-metal - Market size and forecast 2024-2029 ($ million)
- Chart on Non-metal - Year-over-year growth 2024-2029 (%)
- Data Table on Non-metal - Year-over-year growth 2024-2029 (%)
- 9.5 Market opportunity by Material
- Market opportunity by Material ($ million)
- Data Table on Market opportunity by Material ($ million)
10 Market Segmentation by Product Type
- 10.1 Market segments
- Chart on Product Type - Market share 2024-2029 (%)
- Data Table on Product Type - Market share 2024-2029 (%)
- 10.2 Comparison by Product Type
- Chart on Comparison by Product Type
- Data Table on Comparison by Product Type
- 10.3 Studded snow chains - Market size and forecast 2024-2029
- Chart on Studded snow chains - Market size and forecast 2024-2029 ($ million)
- Data Table on Studded snow chains - Market size and forecast 2024-2029 ($ million)
- Chart on Studded snow chains - Year-over-year growth 2024-2029 (%)
- Data Table on Studded snow chains - Year-over-year growth 2024-2029 (%)
- 10.4 Non-studded snow chains - Market size and forecast 2024-2029
- Chart on Non-studded snow chains - Market size and forecast 2024-2029 ($ million)
- Data Table on Non-studded snow chains - Market size and forecast 2024-2029 ($ million)
- Chart on Non-studded snow chains - Year-over-year growth 2024-2029 (%)
- Data Table on Non-studded snow chains - Year-over-year growth 2024-2029 (%)
- 10.5 Cable snow chains - Market size and forecast 2024-2029
- Chart on Cable snow chains - Market size and forecast 2024-2029 ($ million)
- Data Table on Cable snow chains - Market size and forecast 2024-2029 ($ million)
- Chart on Cable snow chains - Year-over-year growth 2024-2029 (%)
- Data Table on Cable snow chains - Year-over-year growth 2024-2029 (%)
- 10.6 Ladder snow chains - Market size and forecast 2024-2029
- Chart on Ladder snow chains - Market size and forecast 2024-2029 ($ million)
- Data Table on Ladder snow chains - Market size and forecast 2024-2029 ($ million)
- Chart on Ladder snow chains - Year-over-year growth 2024-2029 (%)
- Data Table on Ladder snow chains - Year-over-year growth 2024-2029 (%)
- 10.7 Market opportunity by Product Type
- Market opportunity by Product Type ($ million)
- Data Table on Market opportunity by Product Type ($ million)
11 Customer Landscape
- 11.1 Customer landscape overview
- Analysis of price sensitivity, lifecycle, customer purchase basket, adoption rates, and purchase criteria
12 Geographic Landscape
- 12.1 Geographic segmentation
- Chart on Market share By Geographical Landscape 2024-2029 (%)
- Data Table on Market share By Geographical Landscape 2024-2029 (%)
- 12.2 Geographic comparison
- Chart on Geographic comparison
- Data Table on Geographic comparison
- 12.3 North America - Market size and forecast 2024-2029
- Chart on North America - Market size and forecast 2024-2029 ($ million)
- Data Table on North America - Market size and forecast 2024-2029 ($ million)
- Chart on North America - Year-over-year growth 2024-2029 (%)
- Data Table on North America - Year-over-year growth 2024-2029 (%)
- 12.4 Europe - Market size and forecast 2024-2029
- Chart on Europe - Market size and forecast 2024-2029 ($ million)
- Data Table on Europe - Market size and forecast 2024-2029 ($ million)
- Chart on Europe - Year-over-year growth 2024-2029 (%)
- Data Table on Europe - Year-over-year growth 2024-2029 (%)
- 12.5 APAC - Market size and forecast 2024-2029
- Chart on APAC - Market size and forecast 2024-2029 ($ million)
- Data Table on APAC - Market size and forecast 2024-2029 ($ million)
- Chart on APAC - Year-over-year growth 2024-2029 (%)
- Data Table on APAC - Year-over-year growth 2024-2029 (%)
- 12.6 South America - Market size and forecast 2024-2029
- Chart on South America - Market size and forecast 2024-2029 ($ million)
- Data Table on South America - Market size and forecast 2024-2029 ($ million)
- Chart on South America - Year-over-year growth 2024-2029 (%)
- Data Table on South America - Year-over-year growth 2024-2029 (%)
- 12.7 Middle East and Africa - Market size and forecast 2024-2029
- Chart on Middle East and Africa - Market size and forecast 2024-2029 ($ million)
- Data Table on Middle East and Africa - Market size and forecast 2024-2029 ($ million)
- Chart on Middle East and Africa - Year-over-year growth 2024-2029 (%)
- Data Table on Middle East and Africa - Year-over-year growth 2024-2029 (%)
- 12.8 US - Market size and forecast 2024-2029
- Chart on US - Market size and forecast 2024-2029 ($ million)
- Data Table on US - Market size and forecast 2024-2029 ($ million)
- Chart on US - Year-over-year growth 2024-2029 (%)
- Data Table on US - Year-over-year growth 2024-2029 (%)
- 12.9 Canada - Market size and forecast 2024-2029
- Chart on Canada - Market size and forecast 2024-2029 ($ million)
- Data Table on Canada - Market size and forecast 2024-2029 ($ million)
- Chart on Canada - Year-over-year growth 2024-2029 (%)
- Data Table on Canada - Year-over-year growth 2024-2029 (%)
- 12.10 China - Market size and forecast 2024-2029
- Chart on China - Market size and forecast 2024-2029 ($ million)
- Data Table on China - Market size and forecast 2024-2029 ($ million)
- Chart on China - Year-over-year growth 2024-2029 (%)
- Data Table on China - Year-over-year growth 2024-2029 (%)
- 12.11 Germany - Market size and forecast 2024-2029
- Chart on Germany - Market size and forecast 2024-2029 ($ million)
- Data Table on Germany - Market size and forecast 2024-2029 ($ million)
- Chart on Germany - Year-over-year growth 2024-2029 (%)
- Data Table on Germany - Year-over-year growth 2024-2029 (%)
- 12.12 France - Market size and forecast 2024-2029
- Chart on France - Market size and forecast 2024-2029 ($ million)
- Data Table on France - Market size and forecast 2024-2029 ($ million)
- Chart on France - Year-over-year growth 2024-2029 (%)
- Data Table on France - Year-over-year growth 2024-2029 (%)
- 12.13 Mexico - Market size and forecast 2024-2029
- Chart on Mexico - Market size and forecast 2024-2029 ($ million)
- Data Table on Mexico - Market size and forecast 2024-2029 ($ million)
- Chart on Mexico - Year-over-year growth 2024-2029 (%)
- Data Table on Mexico - Year-over-year growth 2024-2029 (%)
- 12.14 Japan - Market size and forecast 2024-2029
- Chart on Japan - Market size and forecast 2024-2029 ($ million)
- Data Table on Japan - Market size and forecast 2024-2029 ($ million)
- Chart on Japan - Year-over-year growth 2024-2029 (%)
- Data Table on Japan - Year-over-year growth 2024-2029 (%)
- 12.15 UK - Market size and forecast 2024-2029
- Chart on UK - Market size and forecast 2024-2029 ($ million)
- Data Table on UK - Market size and forecast 2024-2029 ($ million)
- Chart on UK - Year-over-year growth 2024-2029 (%)
- Data Table on UK - Year-over-year growth 2024-2029 (%)
- 12.16 India - Market size and forecast 2024-2029
- Chart on India - Market size and forecast 2024-2029 ($ million)
- Data Table on India - Market size and forecast 2024-2029 ($ million)
- Chart on India - Year-over-year growth 2024-2029 (%)
- Data Table on India - Year-over-year growth 2024-2029 (%)
- 12.17 Italy - Market size and forecast 2024-2029
- Chart on Italy - Market size and forecast 2024-2029 ($ million)
- Data Table on Italy - Market size and forecast 2024-2029 ($ million)
- Chart on Italy - Year-over-year growth 2024-2029 (%)
- Data Table on Italy - Year-over-year growth 2024-2029 (%)
- 12.18 Market opportunity By Geographical Landscape
- Market opportunity By Geographical Landscape ($ million)
- Data Tables on Market opportunity By Geographical Landscape ($ million)
13 Drivers, Challenges, and Opportunity/Restraints
- 13.1 Market drivers
- 13.2 Market challenges
- 13.3 Impact of drivers and challenges
- Impact of drivers and challenges in 2024 and 2029
- 13.4 Market opportunities/restraints
14 Competitive Landscape
- 14.1 Overview
- 14.2 Competitive Landscape
- Overview on criticality of inputs and factors of differentiation
- 14.3 Landscape disruption
- Overview on factors of disruption
- 14.4 Industry risks
- Impact of key risks on business
15 Competitive Analysis
- 15.1 Companies profiled
- Companies covered
- 15.2 Company ranking index
- Company ranking index
- 15.3 Market positioning of companies
- Matrix on companies position and classification
- 15.4 Ferreterro India Pvt Ltd.
- Ferreterro India Pvt Ltd. - Overview
- Ferreterro India Pvt Ltd. - Product / Service
- Ferreterro India Pvt Ltd. - Key offerings
- SWOT
- 15.5 Hilifting
- Hilifting - Overview
- Hilifting - Product / Service
- Hilifting - Key offerings
- SWOT
- 15.6 Jinhua Luxiang Chain Co. Ltd.
- Jinhua Luxiang Chain Co. Ltd. - Overview
- Jinhua Luxiang Chain Co. Ltd. - Product / Service
- Jinhua Luxiang Chain Co. Ltd. - Key offerings
- SWOT
- 15.7 JOUBERT GROUP
- JOUBERT GROUP - Overview
- JOUBERT GROUP - Product / Service
- JOUBERT GROUP - Key offerings
- SWOT
- 15.8 Laclede Chain Manufacturing Co. LLC
- Laclede Chain Manufacturing Co. LLC - Overview
- Laclede Chain Manufacturing Co. LLC - Product / Service
- Laclede Chain Manufacturing Co. LLC - Key offerings
- SWOT
- 15.9 LeMans Corp.
- LeMans Corp. - Overview
- LeMans Corp. - Product / Service
- LeMans Corp. - Key offerings
- SWOT
- 15.10 Maggi Group
- Maggi Group - Overview
- Maggi Group - Product / Service
- Maggi Group - Key offerings
- SWOT
- 15.11 Michelin Group
- Michelin Group - Overview
- Michelin Group - Business segments
- Michelin Group - Key news
- Michelin Group - Key offerings
- Michelin Group - Segment focus
- SWOT
- 15.12 Nordic Traction Group
- Nordic Traction Group - Overview
- Nordic Traction Group - Product / Service
- Nordic Traction Group - Key offerings
- SWOT
- 15.13 Ottinger GmbH
- Ottinger GmbH - Overview
- Ottinger GmbH - Product / Service
- Ottinger GmbH - Key offerings
- SWOT
- 15.14 Pewag International GmbH
- Pewag International GmbH - Overview
- Pewag International GmbH - Product / Service
- Pewag International GmbH - Key offerings
- SWOT
- 15.15 RUD Ketten Rieger and Dietz GmbH u. Co. KG
- RUD Ketten Rieger and Dietz GmbH u. Co. KG - Overview
- RUD Ketten Rieger and Dietz GmbH u. Co. KG - Product / Service
- RUD Ketten Rieger and Dietz GmbH u. Co. KG - Key offerings
- SWOT
- 15.16 Spikes Spider
- Spikes Spider - Overview
- Spikes Spider - Product / Service
- Spikes Spider - Key offerings
- SWOT
- 15.17 Veriga KF doo.
- Veriga KF doo. - Overview
- Veriga KF doo. - Product / Service
- Veriga KF doo. - Key offerings
- SWOT
- 15.18 Volvo Car Corp.
- Volvo Car Corp. - Overview
- Volvo Car Corp. - Product / Service
- Volvo Car Corp. - Key offerings
- SWOT
16 Appendix
- 16.1 Scope of the report
- 16.2 Inclusions and exclusions checklist
- Inclusions checklist
- Exclusions checklist
- 16.3 Currency conversion rates for US$
- Currency conversion rates for US$
- 16.4 Research methodology
- Research methodology
- 16.5 Data procurement
- Information sources
- 16.6 Data validation
- Data validation
- 16.7 Validation techniques employed for market sizing
- Validation techniques employed for market sizing
- 16.8 Data synthesis
- Data synthesis
- 16.9 360 degree market analysis
- 360 degree market analysis
- 16.10 List of abbreviations
- List of abbreviations

