|
|
市場調査レポート
商品コード
1693056
点滴灌漑システムの世界市場 2025~2029年Global Drip Irrigation Systems Market 2025-2029 |
||||||
|
|||||||
カスタマイズ可能
|
|||||||


| 点滴灌漑システムの世界市場 2025~2029年 |
|
出版日: 2025年03月21日
発行: TechNavio
ページ情報: 英文 241 Pages
納期: 即納可能
|

全表示
- 概要
- 図表
- 目次
点滴灌漑システム市場は2024-2029年に39億3,560万米ドル、予測期間中のCAGRは10.1%で成長すると予測されます。
当レポートでは、点滴灌漑システム市場の全体的な分析、市場規模・予測、動向、成長促進要因、課題、約25のベンダーを網羅したベンダー分析などを掲載しています。
現在の市場シナリオ、最新動向と促進要因、市場環境全体に関する最新分析を提供しています。市場は、持続可能な農業の実践を支援する政府のイニシアチブの増加、点滴灌漑システムが提供するメリット、認証された点滴灌漑システムへの嗜好の高まりによって牽引されています。
| 市場範囲 | |
|---|---|
| 基準年 | 2025 |
| 終了年 | 2029 |
| 予測期間 | 2025-2029 |
| 成長モメンタム | 加速 |
| 前年比2025年 | 9.3% |
| CAGR | 10.1% |
| 増分額 | 39億3,560万米ドル |
本調査は、業界の主要参加者からのインプットを含め、一次情報と二次情報を客観的に組み合わせて実施しました。レポートには、主要企業の分析に加え、包括的な市場規模データ、地域分析によるセグメント、ベンダー情勢が含まれています。レポートには過去データと予測データがあります。
本調査では、点滴灌漑システムにおける自動化機能に対する需要の高まりを、今後数年間の点滴灌漑システム市場の成長を促進する主要な理由の1つとして挙げています。また、点滴灌漑システムにおける温室灌漑システムの採用拡大や技術革新の進展は、同市場における大きな需要につながるでしょう。
目次
第1章 エグゼクティブサマリー
- 市場概要
第2章 Technavio分析
- 価格・ライフサイクル・顧客購入バスケット・採用率・購入基準の分析
- インプットの重要性と差別化の要因
- 混乱の要因
- 促進要因と課題の影響
第3章 市場情勢
- 市場エコシステム
- 市場の特徴
- バリューチェーン分析
第4章 市場規模
- 市場の定義
- 市場セグメント分析
- 市場規模 2024
- 市場の見通し 2024-2029
第5章 市場規模実績
- 点滴灌漑システムの世界市場 2019-2023
- エンドユーザー別セグメント分析 2019-2023
- タイプ別セグメント分析 2019-2023
- 技術別セグメント分析 2019-2023
- 作物タイプ別セグメント分析 2019-2023
- 地域別セグメント分析 2019-2023
- 国別セグメント分析 2019-2023
第6章 定性分析
- AIの影響:点滴灌漑システムの世界市場
第7章 ファイブフォース分析
- ファイブフォースの要約
- 買い手の交渉力
- 供給企業の交渉力
- 新規参入業者の脅威
- 代替品の脅威
- 競争の脅威
- 市況
第8章 市場セグメンテーション:エンドユーザー別
- 市場セグメント
- 比較:エンドユーザー別
- 農業:市場規模と予測 2024-2029
- その他:市場規模と予測 2024-2029
- 市場機会:エンドユーザー別
第9章 市場セグメンテーション:タイプ別
- 市場セグメント
- 比較:タイプ別
- インライン:市場規模と予測 2024-2029
- オンライン:市場規模と予測 2024-2029
- 市場機会:タイプ別
第10章 市場セグメンテーション:技術別
- 市場セグメント
- 比較:技術別
- 自動化技術:市場規模と予測 2024-2029
- スマート散水コントローラー:市場規模と予測 2024-2029
- IoTベースのシステム:市場規模と予測 2024-2029
- デジタル流量計:市場規模と予測 2024-2029
- 市場機会:技術別
第11章 市場セグメンテーション:作物タイプ別
- 市場セグメント
- 比較:作物タイプ別
- 果物とナッツ:市場規模と予測 2024-2029
- 畑作物:市場規模と予測 2024-2029
- 野菜作物:市場規模と予測 2024-2029
- その他:市場規模と予測 2024-2029
- 市場機会:作物タイプ別
第12章 顧客情勢
- 顧客情勢の概要
第13章 地域別情勢
- 地域別セグメンテーション
- 地域別比較
- アジア太平洋:市場規模と予測 2024-2029
- 欧州:市場規模と予測 2024-2029
- 北米:市場規模と予測 2024-2029
- 南米:市場規模と予測 2024-2029
- 中東・アフリカ:市場規模と予測 2024-2029
- 米国:市場規模と予測 2024-2029
- 中国:市場規模と予測 2024-2029
- 日本:市場規模と予測 2024-2029
- インド:市場規模と予測 2024-2029
- カナダ:市場規模と予測 2024-2029
- 英国:市場規模と予測 2024-2029
- ドイツ:市場規模と予測 2024-2029
- 韓国:市場規模と予測 2024-2029
- フランス:市場規模と予測 2024-2029
- イタリア:市場規模と予測 2024-2029
- 市場機会:地域情勢別
第14章 促進要因・課題・機会・抑制要因
- 市場促進要因
- 市場の課題
- 促進要因と課題の影響
- 市場の機会・抑制要因
第15章 競合情勢
- 概要
- 競合情勢
- 混乱の状況
- 業界のリスク
第16章 競合分析
- 企業プロファイル
- 企業ランキング指数
- 企業の市場ポジショニング
- DIG Corp.
- DripWorks Inc.
- Golden Key Middle East FZE
- Hunter Industries Inc.
- Husqvarna AB
- Irritec SpA
- Jain Irrigation Systems Ltd.
- Lindsay Corp.
- Mahindra and Mahindra Ltd.
- Nelson Irrigation Corp.
- Netafim Ltd.
- Rain Bird Corp.
- Rivulis Irrigation Ltd.
- The Toro Co.
- Valmont Industries Inc.
第17章 付録
Exhibits:
- Exhibits1: Executive Summary - Chart on Market Overview
- Exhibits2: Executive Summary - Data Table on Market Overview
- Exhibits3: Executive Summary - Chart on Global Market Characteristics
- Exhibits4: Executive Summary - Chart on Market By Geographical Landscape
- Exhibits5: Executive Summary - Chart on Market Segmentation by End-user
- Exhibits6: Executive Summary - Chart on Market Segmentation by Type
- Exhibits7: Executive Summary - Chart on Market Segmentation by Technology
- Exhibits8: Executive Summary - Chart on Market Segmentation by Crop Type
- Exhibits9: Executive Summary - Chart on Incremental Growth
- Exhibits10: Executive Summary - Data Table on Incremental Growth
- Exhibits11: Executive Summary - Chart on Company Market Positioning
- Exhibits12: Analysis of price sensitivity, lifecycle, customer purchase basket, adoption rates, and purchase criteria
- Exhibits13: Overview on criticality of inputs and factors of differentiation
- Exhibits14: Overview on factors of disruption
- Exhibits15: Impact of drivers and challenges in 2024 and 2029
- Exhibits16: Parent Market
- Exhibits17: Data Table on - Parent Market
- Exhibits18: Market characteristics analysis
- Exhibits19: Value chain analysis
- Exhibits20: Offerings of companies included in the market definition
- Exhibits21: Market segments
- Exhibits22: Chart on Global - Market size and forecast 2024-2029 ($ million)
- Exhibits23: Data Table on Global - Market size and forecast 2024-2029 ($ million)
- Exhibits24: Chart on Global Market: Year-over-year growth 2024-2029 (%)
- Exhibits25: Data Table on Global Market: Year-over-year growth 2024-2029 (%)
- Exhibits26: Historic Market Size - Data Table on Global Drip Irrigation Systems Market 2019 - 2023 ($ million)
- Exhibits27: Historic Market Size - End-user Segment 2019 - 2023 ($ million)
- Exhibits28: Historic Market Size - Type Segment 2019 - 2023 ($ million)
- Exhibits29: Historic Market Size - Technology Segment 2019 - 2023 ($ million)
- Exhibits30: Historic Market Size - Crop Type Segment 2019 - 2023 ($ million)
- Exhibits31: Historic Market Size - Geography Segment 2019 - 2023 ($ million)
- Exhibits32: Historic Market Size - Country Segment 2019 - 2023 ($ million)
- Exhibits33: Five forces analysis - Comparison between 2024 and 2029
- Exhibits34: Bargaining power of buyers - Impact of key factors 2024 and 2029
- Exhibits35: Bargaining power of suppliers - Impact of key factors in 2024 and 2029
- Exhibits36: Threat of new entrants - Impact of key factors in 2024 and 2029
- Exhibits37: Threat of substitutes - Impact of key factors in 2024 and 2029
- Exhibits38: Threat of rivalry - Impact of key factors in 2024 and 2029
- Exhibits39: Chart on Market condition - Five forces 2024 and 2029
- Exhibits40: Chart on End-user - Market share 2024-2029 (%)
- Exhibits41: Data Table on End-user - Market share 2024-2029 (%)
- Exhibits42: Chart on Comparison by End-user
- Exhibits43: Data Table on Comparison by End-user
- Exhibits44: Chart on Agriculture - Market size and forecast 2024-2029 ($ million)
- Exhibits45: Data Table on Agriculture - Market size and forecast 2024-2029 ($ million)
- Exhibits46: Chart on Agriculture - Year-over-year growth 2024-2029 (%)
- Exhibits47: Data Table on Agriculture - Year-over-year growth 2024-2029 (%)
- Exhibits48: Chart on Others - Market size and forecast 2024-2029 ($ million)
- Exhibits49: Data Table on Others - Market size and forecast 2024-2029 ($ million)
- Exhibits50: Chart on Others - Year-over-year growth 2024-2029 (%)
- Exhibits51: Data Table on Others - Year-over-year growth 2024-2029 (%)
- Exhibits52: Market opportunity by End-user ($ million)
- Exhibits53: Data Table on Market opportunity by End-user ($ million)
- Exhibits54: Chart on Type - Market share 2024-2029 (%)
- Exhibits55: Data Table on Type - Market share 2024-2029 (%)
- Exhibits56: Chart on Comparison by Type
- Exhibits57: Data Table on Comparison by Type
- Exhibits58: Chart on Inline - Market size and forecast 2024-2029 ($ million)
- Exhibits59: Data Table on Inline - Market size and forecast 2024-2029 ($ million)
- Exhibits60: Chart on Inline - Year-over-year growth 2024-2029 (%)
- Exhibits61: Data Table on Inline - Year-over-year growth 2024-2029 (%)
- Exhibits62: Chart on Online - Market size and forecast 2024-2029 ($ million)
- Exhibits63: Data Table on Online - Market size and forecast 2024-2029 ($ million)
- Exhibits64: Chart on Online - Year-over-year growth 2024-2029 (%)
- Exhibits65: Data Table on Online - Year-over-year growth 2024-2029 (%)
- Exhibits66: Market opportunity by Type ($ million)
- Exhibits67: Data Table on Market opportunity by Type ($ million)
- Exhibits68: Chart on Technology - Market share 2024-2029 (%)
- Exhibits69: Data Table on Technology - Market share 2024-2029 (%)
- Exhibits70: Chart on Comparison by Technology
- Exhibits71: Data Table on Comparison by Technology
- Exhibits72: Chart on Automation technologies - Market size and forecast 2024-2029 ($ million)
- Exhibits73: Data Table on Automation technologies - Market size and forecast 2024-2029 ($ million)
- Exhibits74: Chart on Automation technologies - Year-over-year growth 2024-2029 (%)
- Exhibits75: Data Table on Automation technologies - Year-over-year growth 2024-2029 (%)
- Exhibits76: Chart on Smart watering controllers - Market size and forecast 2024-2029 ($ million)
- Exhibits77: Data Table on Smart watering controllers - Market size and forecast 2024-2029 ($ million)
- Exhibits78: Chart on Smart watering controllers - Year-over-year growth 2024-2029 (%)
- Exhibits79: Data Table on Smart watering controllers - Year-over-year growth 2024-2029 (%)
- Exhibits80: Chart on IoT-based systems - Market size and forecast 2024-2029 ($ million)
- Exhibits81: Data Table on IoT-based systems - Market size and forecast 2024-2029 ($ million)
- Exhibits82: Chart on IoT-based systems - Year-over-year growth 2024-2029 (%)
- Exhibits83: Data Table on IoT-based systems - Year-over-year growth 2024-2029 (%)
- Exhibits84: Chart on Digital flow meters - Market size and forecast 2024-2029 ($ million)
- Exhibits85: Data Table on Digital flow meters - Market size and forecast 2024-2029 ($ million)
- Exhibits86: Chart on Digital flow meters - Year-over-year growth 2024-2029 (%)
- Exhibits87: Data Table on Digital flow meters - Year-over-year growth 2024-2029 (%)
- Exhibits88: Market opportunity by Technology ($ million)
- Exhibits89: Data Table on Market opportunity by Technology ($ million)
- Exhibits90: Chart on Crop Type - Market share 2024-2029 (%)
- Exhibits91: Data Table on Crop Type - Market share 2024-2029 (%)
- Exhibits92: Chart on Comparison by Crop Type
- Exhibits93: Data Table on Comparison by Crop Type
- Exhibits94: Chart on Fruits and nuts - Market size and forecast 2024-2029 ($ million)
- Exhibits95: Data Table on Fruits and nuts - Market size and forecast 2024-2029 ($ million)
- Exhibits96: Chart on Fruits and nuts - Year-over-year growth 2024-2029 (%)
- Exhibits97: Data Table on Fruits and nuts - Year-over-year growth 2024-2029 (%)
- Exhibits98: Chart on Field crops - Market size and forecast 2024-2029 ($ million)
- Exhibits99: Data Table on Field crops - Market size and forecast 2024-2029 ($ million)
- Exhibits100: Chart on Field crops - Year-over-year growth 2024-2029 (%)
- Exhibits101: Data Table on Field crops - Year-over-year growth 2024-2029 (%)
- Exhibits102: Chart on Vegetable crops - Market size and forecast 2024-2029 ($ million)
- Exhibits103: Data Table on Vegetable crops - Market size and forecast 2024-2029 ($ million)
- Exhibits104: Chart on Vegetable crops - Year-over-year growth 2024-2029 (%)
- Exhibits105: Data Table on Vegetable crops - Year-over-year growth 2024-2029 (%)
- Exhibits106: Chart on Others - Market size and forecast 2024-2029 ($ million)
- Exhibits107: Data Table on Others - Market size and forecast 2024-2029 ($ million)
- Exhibits108: Chart on Others - Year-over-year growth 2024-2029 (%)
- Exhibits109: Data Table on Others - Year-over-year growth 2024-2029 (%)
- Exhibits110: Market opportunity by Crop Type ($ million)
- Exhibits111: Data Table on Market opportunity by Crop Type ($ million)
- Exhibits112: Analysis of price sensitivity, lifecycle, customer purchase basket, adoption rates, and purchase criteria
- Exhibits113: Chart on Market share By Geographical Landscape 2024-2029 (%)
- Exhibits114: Data Table on Market share By Geographical Landscape 2024-2029 (%)
- Exhibits115: Chart on Geographic comparison
- Exhibits116: Data Table on Geographic comparison
- Exhibits117: Chart on APAC - Market size and forecast 2024-2029 ($ million)
- Exhibits118: Data Table on APAC - Market size and forecast 2024-2029 ($ million)
- Exhibits119: Chart on APAC - Year-over-year growth 2024-2029 (%)
- Exhibits120: Data Table on APAC - Year-over-year growth 2024-2029 (%)
- Exhibits121: Chart on Europe - Market size and forecast 2024-2029 ($ million)
- Exhibits122: Data Table on Europe - Market size and forecast 2024-2029 ($ million)
- Exhibits123: Chart on Europe - Year-over-year growth 2024-2029 (%)
- Exhibits124: Data Table on Europe - Year-over-year growth 2024-2029 (%)
- Exhibits125: Chart on North America - Market size and forecast 2024-2029 ($ million)
- Exhibits126: Data Table on North America - Market size and forecast 2024-2029 ($ million)
- Exhibits127: Chart on North America - Year-over-year growth 2024-2029 (%)
- Exhibits128: Data Table on North America - Year-over-year growth 2024-2029 (%)
- Exhibits129: Chart on South America - Market size and forecast 2024-2029 ($ million)
- Exhibits130: Data Table on South America - Market size and forecast 2024-2029 ($ million)
- Exhibits131: Chart on South America - Year-over-year growth 2024-2029 (%)
- Exhibits132: Data Table on South America - Year-over-year growth 2024-2029 (%)
- Exhibits133: Chart on Middle East and Africa - Market size and forecast 2024-2029 ($ million)
- Exhibits134: Data Table on Middle East and Africa - Market size and forecast 2024-2029 ($ million)
- Exhibits135: Chart on Middle East and Africa - Year-over-year growth 2024-2029 (%)
- Exhibits136: Data Table on Middle East and Africa - Year-over-year growth 2024-2029 (%)
- Exhibits137: Chart on US - Market size and forecast 2024-2029 ($ million)
- Exhibits138: Data Table on US - Market size and forecast 2024-2029 ($ million)
- Exhibits139: Chart on US - Year-over-year growth 2024-2029 (%)
- Exhibits140: Data Table on US - Year-over-year growth 2024-2029 (%)
- Exhibits141: Chart on China - Market size and forecast 2024-2029 ($ million)
- Exhibits142: Data Table on China - Market size and forecast 2024-2029 ($ million)
- Exhibits143: Chart on China - Year-over-year growth 2024-2029 (%)
- Exhibits144: Data Table on China - Year-over-year growth 2024-2029 (%)
- Exhibits145: Chart on Japan - Market size and forecast 2024-2029 ($ million)
- Exhibits146: Data Table on Japan - Market size and forecast 2024-2029 ($ million)
- Exhibits147: Chart on Japan - Year-over-year growth 2024-2029 (%)
- Exhibits148: Data Table on Japan - Year-over-year growth 2024-2029 (%)
- Exhibits149: Chart on India - Market size and forecast 2024-2029 ($ million)
- Exhibits150: Data Table on India - Market size and forecast 2024-2029 ($ million)
- Exhibits151: Chart on India - Year-over-year growth 2024-2029 (%)
- Exhibits152: Data Table on India - Year-over-year growth 2024-2029 (%)
- Exhibits153: Chart on Canada - Market size and forecast 2024-2029 ($ million)
- Exhibits154: Data Table on Canada - Market size and forecast 2024-2029 ($ million)
- Exhibits155: Chart on Canada - Year-over-year growth 2024-2029 (%)
- Exhibits156: Data Table on Canada - Year-over-year growth 2024-2029 (%)
- Exhibits157: Chart on UK - Market size and forecast 2024-2029 ($ million)
- Exhibits158: Data Table on UK - Market size and forecast 2024-2029 ($ million)
- Exhibits159: Chart on UK - Year-over-year growth 2024-2029 (%)
- Exhibits160: Data Table on UK - Year-over-year growth 2024-2029 (%)
- Exhibits161: Chart on Germany - Market size and forecast 2024-2029 ($ million)
- Exhibits162: Data Table on Germany - Market size and forecast 2024-2029 ($ million)
- Exhibits163: Chart on Germany - Year-over-year growth 2024-2029 (%)
- Exhibits164: Data Table on Germany - Year-over-year growth 2024-2029 (%)
- Exhibits165: Chart on South Korea - Market size and forecast 2024-2029 ($ million)
- Exhibits166: Data Table on South Korea - Market size and forecast 2024-2029 ($ million)
- Exhibits167: Chart on South Korea - Year-over-year growth 2024-2029 (%)
- Exhibits168: Data Table on South Korea - Year-over-year growth 2024-2029 (%)
- Exhibits169: Chart on France - Market size and forecast 2024-2029 ($ million)
- Exhibits170: Data Table on France - Market size and forecast 2024-2029 ($ million)
- Exhibits171: Chart on France - Year-over-year growth 2024-2029 (%)
- Exhibits172: Data Table on France - Year-over-year growth 2024-2029 (%)
- Exhibits173: Chart on Italy - Market size and forecast 2024-2029 ($ million)
- Exhibits174: Data Table on Italy - Market size and forecast 2024-2029 ($ million)
- Exhibits175: Chart on Italy - Year-over-year growth 2024-2029 (%)
- Exhibits176: Data Table on Italy - Year-over-year growth 2024-2029 (%)
- Exhibits177: Market opportunity By Geographical Landscape ($ million)
- Exhibits178: Data Tables on Market opportunity By Geographical Landscape ($ million)
- Exhibits179: Impact of drivers and challenges in 2024 and 2029
- Exhibits180: Overview on criticality of inputs and factors of differentiation
- Exhibits181: Overview on factors of disruption
- Exhibits182: Impact of key risks on business
- Exhibits183: Companies covered
- Exhibits184: Company ranking index
- Exhibits185: Matrix on companies position and classification
- Exhibits186: DIG Corp. - Overview
- Exhibits187: DIG Corp. - Product / Service
- Exhibits188: DIG Corp. - Key offerings
- Exhibits189: SWOT
- Exhibits190: DripWorks Inc. - Overview
- Exhibits191: DripWorks Inc. - Product / Service
- Exhibits192: DripWorks Inc. - Key offerings
- Exhibits193: SWOT
- Exhibits194: Golden Key Middle East FZE - Overview
- Exhibits195: Golden Key Middle East FZE - Product / Service
- Exhibits196: Golden Key Middle East FZE - Key offerings
- Exhibits197: SWOT
- Exhibits198: Hunter Industries Inc. - Overview
- Exhibits199: Hunter Industries Inc. - Product / Service
- Exhibits200: Hunter Industries Inc. - Key offerings
- Exhibits201: SWOT
- Exhibits202: Husqvarna AB - Overview
- Exhibits203: Husqvarna AB - Business segments
- Exhibits204: Husqvarna AB - Key offerings
- Exhibits205: Husqvarna AB - Segment focus
- Exhibits206: SWOT
- Exhibits207: Irritec SpA - Overview
- Exhibits208: Irritec SpA - Product / Service
- Exhibits209: Irritec SpA - Key offerings
- Exhibits210: SWOT
- Exhibits211: Jain Irrigation Systems Ltd. - Overview
- Exhibits212: Jain Irrigation Systems Ltd. - Business segments
- Exhibits213: Jain Irrigation Systems Ltd. - Key offerings
- Exhibits214: Jain Irrigation Systems Ltd. - Segment focus
- Exhibits215: SWOT
- Exhibits216: Lindsay Corp. - Overview
- Exhibits217: Lindsay Corp. - Business segments
- Exhibits218: Lindsay Corp. - Key offerings
- Exhibits219: Lindsay Corp. - Segment focus
- Exhibits220: SWOT
- Exhibits221: Mahindra and Mahindra Ltd. - Overview
- Exhibits222: Mahindra and Mahindra Ltd. - Business segments
- Exhibits223: Mahindra and Mahindra Ltd. - Key news
- Exhibits224: Mahindra and Mahindra Ltd. - Key offerings
- Exhibits225: Mahindra and Mahindra Ltd. - Segment focus
- Exhibits226: SWOT
- Exhibits227: Nelson Irrigation Corp. - Overview
- Exhibits228: Nelson Irrigation Corp. - Product / Service
- Exhibits229: Nelson Irrigation Corp. - Key offerings
- Exhibits230: SWOT
- Exhibits231: Netafim Ltd. - Overview
- Exhibits232: Netafim Ltd. - Product / Service
- Exhibits233: Netafim Ltd. - Key offerings
- Exhibits234: SWOT
- Exhibits235: Rain Bird Corp. - Overview
- Exhibits236: Rain Bird Corp. - Product / Service
- Exhibits237: Rain Bird Corp. - Key offerings
- Exhibits238: SWOT
- Exhibits239: Rivulis Irrigation Ltd. - Overview
- Exhibits240: Rivulis Irrigation Ltd. - Product / Service
- Exhibits241: Rivulis Irrigation Ltd. - Key offerings
- Exhibits242: SWOT
- Exhibits243: The Toro Co. - Overview
- Exhibits244: The Toro Co. - Business segments
- Exhibits245: The Toro Co. - Key news
- Exhibits246: The Toro Co. - Key offerings
- Exhibits247: The Toro Co. - Segment focus
- Exhibits248: SWOT
- Exhibits249: Valmont Industries Inc. - Overview
- Exhibits250: Valmont Industries Inc. - Business segments
- Exhibits251: Valmont Industries Inc. - Key offerings
- Exhibits252: Valmont Industries Inc. - Segment focus
- Exhibits253: SWOT
- Exhibits254: Inclusions checklist
- Exhibits255: Exclusions checklist
- Exhibits256: Currency conversion rates for US$
- Exhibits257: Research methodology
- Exhibits258: Information sources
- Exhibits259: Data validation
- Exhibits260: Validation techniques employed for market sizing
- Exhibits261: Data synthesis
- Exhibits262: 360 degree market analysis
- Exhibits263: List of abbreviations
The drip irrigation systems market is forecasted to grow by USD 3935.6 million during 2024-2029, accelerating at a CAGR of 10.1% during the forecast period. The report on the drip irrigation systems market provides a holistic analysis, market size and forecast, trends, growth drivers, and challenges, as well as vendor analysis covering around 25 vendors.
The report offers an up-to-date analysis regarding the current market scenario, the latest trends and drivers, and the overall market environment. The market is driven by increase in government initiatives supporting sustainable agriculture practices, benefits offered by drip irrigation systems, and growing preference for certified drip irrigation systems.
| Market Scope | |
|---|---|
| Base Year | 2025 |
| End Year | 2029 |
| Series Year | 2025-2029 |
| Growth Momentum | Accelerate |
| YOY 2025 | 9.3% |
| CAGR | 10.1% |
| Incremental Value | $3935.6 mn |
The study was conducted using an objective combination of primary and secondary information including inputs from key participants in the industry. The report contains a comprehensive market size data, segment with regional analysis and vendor landscape in addition to an analysis of the key companies. Reports have historic and forecast data.
Technavio's drip irrigation systems market is segmented as below:
By End-user
- Agriculture
- Others
By Type
- Inline
- Online
By Technology
- Automation technologies
- Smart watering controllers
- IOT-based systems
- Digital flow meters
By Crop Type
- Fruits and nuts
- Field crops
- Vegetable crops
- Others
By Geographical Landscape
- APAC
- Europe
- North America
- South America
- Middle East and Africa
This study identifies the rising demand for automated features in drip irrigation systems as one of the prime reasons driving the drip irrigation systems market growth during the next few years. Also, growing adoption of greenhouse irrigation system and increasing technological innovations in drip irrigation systems will lead to sizable demand in the market.
The report on the drip irrigation systems market covers the following areas:
- Drip Irrigation Systems Market sizing
- Drip Irrigation Systems Market forecast
- Drip Irrigation Systems Market industry analysis
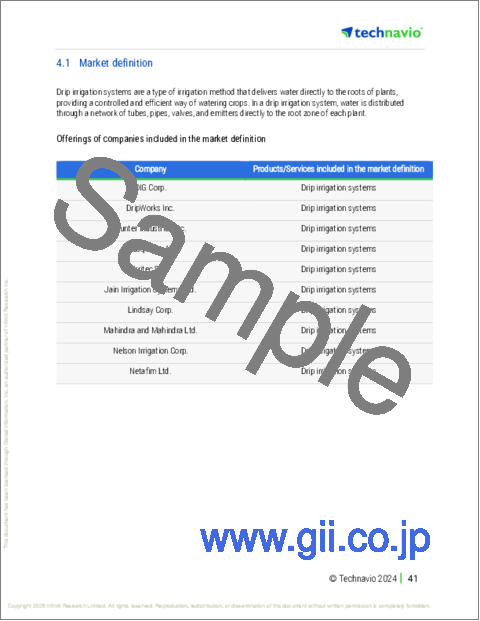
The robust vendor analysis is designed to help clients improve their market position, and in line with this, this report provides a detailed analysis of several leading drip irrigation systems market vendors that include AGRODRIP S.A., Astha Polymers Pvt. Ltd., BC Hardscapes, LLC, DIG Corp., DripWorks Inc., Golden Key Middle East FZE, Hunter Industries Inc., Husqvarna AB, Irritec SpA, Jain Irrigation Systems Ltd., KSNM DRIP, Lindsay Corp., Mahindra and Mahindra Ltd., Nelson Irrigation Corp., Netafim Ltd., NORMA Group SE, Rain Bird Corp., Rivulis Irrigation Ltd., The Toro Co., and Valmont Industries Inc.. Also, the drip irrigation systems market analysis report includes information on upcoming trends and challenges that will influence market growth. This is to help companies strategize and leverage all forthcoming growth opportunities.
The publisher presents a detailed picture of the market by the way of study, synthesis, and summation of data from multiple sources by an analysis of key parameters such as profit, pricing, competition, and promotions. It presents various market facets by identifying the key industry influencers. The data presented is comprehensive, reliable, and a result of extensive primary and secondary research. The market research reports provide a complete competitive landscape and an in-depth vendor selection methodology and analysis using qualitative and quantitative research to forecast accurate market growth.
Table of Contents
1 Executive Summary
- 1.1 Market overview
- Executive Summary - Chart on Market Overview
- Executive Summary - Data Table on Market Overview
- Executive Summary - Chart on Global Market Characteristics
- Executive Summary - Chart on Market By Geographical Landscape
- Executive Summary - Chart on Market Segmentation by End-user
- Executive Summary - Chart on Market Segmentation by Type
- Executive Summary - Chart on Market Segmentation by Technology
- Executive Summary - Chart on Market Segmentation by Crop Type
- Executive Summary - Chart on Incremental Growth
- Executive Summary - Data Table on Incremental Growth
- Executive Summary - Chart on Company Market Positioning
2 Technavio Analysis
- 2.1 Analysis of price sensitivity, lifecycle, customer purchase basket, adoption rates, and purchase criteria
- Analysis of price sensitivity, lifecycle, customer purchase basket, adoption rates, and purchase criteria
- 2.2 Criticality of inputs and Factors of differentiation
- Overview on criticality of inputs and factors of differentiation
- 2.3 Factors of disruption
- Overview on factors of disruption
- 2.4 Impact of drivers and challenges
- Impact of drivers and challenges in 2024 and 2029
3 Market Landscape
- 3.1 Market ecosystem
- Parent Market
- Data Table on - Parent Market
- 3.2 Market characteristics
- Market characteristics analysis
- 3.3 Value chain analysis
- Value chain analysis
4 Market Sizing
- 4.1 Market definition
- Offerings of companies included in the market definition
- 4.2 Market segment analysis
- Market segments
- 4.3 Market size 2024
- 4.4 Market outlook: Forecast for 2024-2029
- Chart on Global - Market size and forecast 2024-2029 ($ million)
- Data Table on Global - Market size and forecast 2024-2029 ($ million)
- Chart on Global Market: Year-over-year growth 2024-2029 (%)
- Data Table on Global Market: Year-over-year growth 2024-2029 (%)
5 Historic Market Size
- 5.1 Global Drip Irrigation Systems Market 2019 - 2023
- Historic Market Size - Data Table on Global Drip Irrigation Systems Market 2019 - 2023 ($ million)
- 5.2 End-user segment analysis 2019 - 2023
- Historic Market Size - End-user Segment 2019 - 2023 ($ million)
- 5.3 Type segment analysis 2019 - 2023
- Historic Market Size - Type Segment 2019 - 2023 ($ million)
- 5.4 Technology segment analysis 2019 - 2023
- Historic Market Size - Technology Segment 2019 - 2023 ($ million)
- 5.5 Crop Type segment analysis 2019 - 2023
- Historic Market Size - Crop Type Segment 2019 - 2023 ($ million)
- 5.6 Geography segment analysis 2019 - 2023
- Historic Market Size - Geography Segment 2019 - 2023 ($ million)
- 5.7 Country segment analysis 2019 - 2023
- Historic Market Size - Country Segment 2019 - 2023 ($ million)
6 Qualitative Analysis
- 6.1 AI Impact on Global Drip Irrigation Systems Market
7 Five Forces Analysis
- 7.1 Five forces summary
- Five forces analysis - Comparison between 2024 and 2029
- 7.2 Bargaining power of buyers
- Bargaining power of buyers - Impact of key factors 2024 and 2029
- 7.3 Bargaining power of suppliers
- Bargaining power of suppliers - Impact of key factors in 2024 and 2029
- 7.4 Threat of new entrants
- Threat of new entrants - Impact of key factors in 2024 and 2029
- 7.5 Threat of substitutes
- Threat of substitutes - Impact of key factors in 2024 and 2029
- 7.6 Threat of rivalry
- Threat of rivalry - Impact of key factors in 2024 and 2029
- 7.7 Market condition
- Chart on Market condition - Five forces 2024 and 2029
8 Market Segmentation by End-user
- 8.1 Market segments
- Chart on End-user - Market share 2024-2029 (%)
- Data Table on End-user - Market share 2024-2029 (%)
- 8.2 Comparison by End-user
- Chart on Comparison by End-user
- Data Table on Comparison by End-user
- 8.3 Agriculture - Market size and forecast 2024-2029
- Chart on Agriculture - Market size and forecast 2024-2029 ($ million)
- Data Table on Agriculture - Market size and forecast 2024-2029 ($ million)
- Chart on Agriculture - Year-over-year growth 2024-2029 (%)
- Data Table on Agriculture - Year-over-year growth 2024-2029 (%)
- 8.4 Others - Market size and forecast 2024-2029
- Chart on Others - Market size and forecast 2024-2029 ($ million)
- Data Table on Others - Market size and forecast 2024-2029 ($ million)
- Chart on Others - Year-over-year growth 2024-2029 (%)
- Data Table on Others - Year-over-year growth 2024-2029 (%)
- 8.5 Market opportunity by End-user
- Market opportunity by End-user ($ million)
- Data Table on Market opportunity by End-user ($ million)
9 Market Segmentation by Type
- 9.1 Market segments
- Chart on Type - Market share 2024-2029 (%)
- Data Table on Type - Market share 2024-2029 (%)
- 9.2 Comparison by Type
- Chart on Comparison by Type
- Data Table on Comparison by Type
- 9.3 Inline - Market size and forecast 2024-2029
- Chart on Inline - Market size and forecast 2024-2029 ($ million)
- Data Table on Inline - Market size and forecast 2024-2029 ($ million)
- Chart on Inline - Year-over-year growth 2024-2029 (%)
- Data Table on Inline - Year-over-year growth 2024-2029 (%)
- 9.4 Online - Market size and forecast 2024-2029
- Chart on Online - Market size and forecast 2024-2029 ($ million)
- Data Table on Online - Market size and forecast 2024-2029 ($ million)
- Chart on Online - Year-over-year growth 2024-2029 (%)
- Data Table on Online - Year-over-year growth 2024-2029 (%)
- 9.5 Market opportunity by Type
- Market opportunity by Type ($ million)
- Data Table on Market opportunity by Type ($ million)
10 Market Segmentation by Technology
- 10.1 Market segments
- Chart on Technology - Market share 2024-2029 (%)
- Data Table on Technology - Market share 2024-2029 (%)
- 10.2 Comparison by Technology
- Chart on Comparison by Technology
- Data Table on Comparison by Technology
- 10.3 Automation technologies - Market size and forecast 2024-2029
- Chart on Automation technologies - Market size and forecast 2024-2029 ($ million)
- Data Table on Automation technologies - Market size and forecast 2024-2029 ($ million)
- Chart on Automation technologies - Year-over-year growth 2024-2029 (%)
- Data Table on Automation technologies - Year-over-year growth 2024-2029 (%)
- 10.4 Smart watering controllers - Market size and forecast 2024-2029
- Chart on Smart watering controllers - Market size and forecast 2024-2029 ($ million)
- Data Table on Smart watering controllers - Market size and forecast 2024-2029 ($ million)
- Chart on Smart watering controllers - Year-over-year growth 2024-2029 (%)
- Data Table on Smart watering controllers - Year-over-year growth 2024-2029 (%)
- 10.5 IoT-based systems - Market size and forecast 2024-2029
- Chart on IoT-based systems - Market size and forecast 2024-2029 ($ million)
- Data Table on IoT-based systems - Market size and forecast 2024-2029 ($ million)
- Chart on IoT-based systems - Year-over-year growth 2024-2029 (%)
- Data Table on IoT-based systems - Year-over-year growth 2024-2029 (%)
- 10.6 Digital flow meters - Market size and forecast 2024-2029
- Chart on Digital flow meters - Market size and forecast 2024-2029 ($ million)
- Data Table on Digital flow meters - Market size and forecast 2024-2029 ($ million)
- Chart on Digital flow meters - Year-over-year growth 2024-2029 (%)
- Data Table on Digital flow meters - Year-over-year growth 2024-2029 (%)
- 10.7 Market opportunity by Technology
- Market opportunity by Technology ($ million)
- Data Table on Market opportunity by Technology ($ million)
11 Market Segmentation by Crop Type
- 11.1 Market segments
- Chart on Crop Type - Market share 2024-2029 (%)
- Data Table on Crop Type - Market share 2024-2029 (%)
- 11.2 Comparison by Crop Type
- Chart on Comparison by Crop Type
- Data Table on Comparison by Crop Type
- 11.3 Fruits and nuts - Market size and forecast 2024-2029
- Chart on Fruits and nuts - Market size and forecast 2024-2029 ($ million)
- Data Table on Fruits and nuts - Market size and forecast 2024-2029 ($ million)
- Chart on Fruits and nuts - Year-over-year growth 2024-2029 (%)
- Data Table on Fruits and nuts - Year-over-year growth 2024-2029 (%)
- 11.4 Field crops - Market size and forecast 2024-2029
- Chart on Field crops - Market size and forecast 2024-2029 ($ million)
- Data Table on Field crops - Market size and forecast 2024-2029 ($ million)
- Chart on Field crops - Year-over-year growth 2024-2029 (%)
- Data Table on Field crops - Year-over-year growth 2024-2029 (%)
- 11.5 Vegetable crops - Market size and forecast 2024-2029
- Chart on Vegetable crops - Market size and forecast 2024-2029 ($ million)
- Data Table on Vegetable crops - Market size and forecast 2024-2029 ($ million)
- Chart on Vegetable crops - Year-over-year growth 2024-2029 (%)
- Data Table on Vegetable crops - Year-over-year growth 2024-2029 (%)
- 11.6 Others - Market size and forecast 2024-2029
- Chart on Others - Market size and forecast 2024-2029 ($ million)
- Data Table on Others - Market size and forecast 2024-2029 ($ million)
- Chart on Others - Year-over-year growth 2024-2029 (%)
- Data Table on Others - Year-over-year growth 2024-2029 (%)
- 11.7 Market opportunity by Crop Type
- Market opportunity by Crop Type ($ million)
- Data Table on Market opportunity by Crop Type ($ million)
12 Customer Landscape
- 12.1 Customer landscape overview
- Analysis of price sensitivity, lifecycle, customer purchase basket, adoption rates, and purchase criteria
13 Geographic Landscape
- 13.1 Geographic segmentation
- Chart on Market share By Geographical Landscape 2024-2029 (%)
- Data Table on Market share By Geographical Landscape 2024-2029 (%)
- 13.2 Geographic comparison
- Chart on Geographic comparison
- Data Table on Geographic comparison
- 13.3 APAC - Market size and forecast 2024-2029
- Chart on APAC - Market size and forecast 2024-2029 ($ million)
- Data Table on APAC - Market size and forecast 2024-2029 ($ million)
- Chart on APAC - Year-over-year growth 2024-2029 (%)
- Data Table on APAC - Year-over-year growth 2024-2029 (%)
- 13.4 Europe - Market size and forecast 2024-2029
- Chart on Europe - Market size and forecast 2024-2029 ($ million)
- Data Table on Europe - Market size and forecast 2024-2029 ($ million)
- Chart on Europe - Year-over-year growth 2024-2029 (%)
- Data Table on Europe - Year-over-year growth 2024-2029 (%)
- 13.5 North America - Market size and forecast 2024-2029
- Chart on North America - Market size and forecast 2024-2029 ($ million)
- Data Table on North America - Market size and forecast 2024-2029 ($ million)
- Chart on North America - Year-over-year growth 2024-2029 (%)
- Data Table on North America - Year-over-year growth 2024-2029 (%)
- 13.6 South America - Market size and forecast 2024-2029
- Chart on South America - Market size and forecast 2024-2029 ($ million)
- Data Table on South America - Market size and forecast 2024-2029 ($ million)
- Chart on South America - Year-over-year growth 2024-2029 (%)
- Data Table on South America - Year-over-year growth 2024-2029 (%)
- 13.7 Middle East and Africa - Market size and forecast 2024-2029
- Chart on Middle East and Africa - Market size and forecast 2024-2029 ($ million)
- Data Table on Middle East and Africa - Market size and forecast 2024-2029 ($ million)
- Chart on Middle East and Africa - Year-over-year growth 2024-2029 (%)
- Data Table on Middle East and Africa - Year-over-year growth 2024-2029 (%)
- 13.8 US - Market size and forecast 2024-2029
- Chart on US - Market size and forecast 2024-2029 ($ million)
- Data Table on US - Market size and forecast 2024-2029 ($ million)
- Chart on US - Year-over-year growth 2024-2029 (%)
- Data Table on US - Year-over-year growth 2024-2029 (%)
- 13.9 China - Market size and forecast 2024-2029
- Chart on China - Market size and forecast 2024-2029 ($ million)
- Data Table on China - Market size and forecast 2024-2029 ($ million)
- Chart on China - Year-over-year growth 2024-2029 (%)
- Data Table on China - Year-over-year growth 2024-2029 (%)
- 13.10 Japan - Market size and forecast 2024-2029
- Chart on Japan - Market size and forecast 2024-2029 ($ million)
- Data Table on Japan - Market size and forecast 2024-2029 ($ million)
- Chart on Japan - Year-over-year growth 2024-2029 (%)
- Data Table on Japan - Year-over-year growth 2024-2029 (%)
- 13.11 India - Market size and forecast 2024-2029
- Chart on India - Market size and forecast 2024-2029 ($ million)
- Data Table on India - Market size and forecast 2024-2029 ($ million)
- Chart on India - Year-over-year growth 2024-2029 (%)
- Data Table on India - Year-over-year growth 2024-2029 (%)
- 13.12 Canada - Market size and forecast 2024-2029
- Chart on Canada - Market size and forecast 2024-2029 ($ million)
- Data Table on Canada - Market size and forecast 2024-2029 ($ million)
- Chart on Canada - Year-over-year growth 2024-2029 (%)
- Data Table on Canada - Year-over-year growth 2024-2029 (%)
- 13.13 UK - Market size and forecast 2024-2029
- Chart on UK - Market size and forecast 2024-2029 ($ million)
- Data Table on UK - Market size and forecast 2024-2029 ($ million)
- Chart on UK - Year-over-year growth 2024-2029 (%)
- Data Table on UK - Year-over-year growth 2024-2029 (%)
- 13.14 Germany - Market size and forecast 2024-2029
- Chart on Germany - Market size and forecast 2024-2029 ($ million)
- Data Table on Germany - Market size and forecast 2024-2029 ($ million)
- Chart on Germany - Year-over-year growth 2024-2029 (%)
- Data Table on Germany - Year-over-year growth 2024-2029 (%)
- 13.15 South Korea - Market size and forecast 2024-2029
- Chart on South Korea - Market size and forecast 2024-2029 ($ million)
- Data Table on South Korea - Market size and forecast 2024-2029 ($ million)
- Chart on South Korea - Year-over-year growth 2024-2029 (%)
- Data Table on South Korea - Year-over-year growth 2024-2029 (%)
- 13.16 France - Market size and forecast 2024-2029
- Chart on France - Market size and forecast 2024-2029 ($ million)
- Data Table on France - Market size and forecast 2024-2029 ($ million)
- Chart on France - Year-over-year growth 2024-2029 (%)
- Data Table on France - Year-over-year growth 2024-2029 (%)
- 13.17 Italy - Market size and forecast 2024-2029
- Chart on Italy - Market size and forecast 2024-2029 ($ million)
- Data Table on Italy - Market size and forecast 2024-2029 ($ million)
- Chart on Italy - Year-over-year growth 2024-2029 (%)
- Data Table on Italy - Year-over-year growth 2024-2029 (%)
- 13.18 Market opportunity By Geographical Landscape
- Market opportunity By Geographical Landscape ($ million)
- Data Tables on Market opportunity By Geographical Landscape ($ million)
14 Drivers, Challenges, and Opportunity/Restraints
- 14.1 Market drivers
- 14.2 Market challenges
- 14.3 Impact of drivers and challenges
- Impact of drivers and challenges in 2024 and 2029
- 14.4 Market opportunities/restraints
15 Competitive Landscape
- 15.1 Overview
- 15.2 Competitive Landscape
- Overview on criticality of inputs and factors of differentiation
- 15.3 Landscape disruption
- Overview on factors of disruption
- 15.4 Industry risks
- Impact of key risks on business
16 Competitive Analysis
- 16.1 Companies profiled
- Companies covered
- 16.2 Company ranking index
- Company ranking index
- 16.3 Market positioning of companies
- Matrix on companies position and classification
- 16.4 DIG Corp.
- DIG Corp. - Overview
- DIG Corp. - Product / Service
- DIG Corp. - Key offerings
- SWOT
- 16.5 DripWorks Inc.
- DripWorks Inc. - Overview
- DripWorks Inc. - Product / Service
- DripWorks Inc. - Key offerings
- SWOT
- 16.6 Golden Key Middle East FZE
- Golden Key Middle East FZE - Overview
- Golden Key Middle East FZE - Product / Service
- Golden Key Middle East FZE - Key offerings
- SWOT
- 16.7 Hunter Industries Inc.
- Hunter Industries Inc. - Overview
- Hunter Industries Inc. - Product / Service
- Hunter Industries Inc. - Key offerings
- SWOT
- 16.8 Husqvarna AB
- Husqvarna AB - Overview
- Husqvarna AB - Business segments
- Husqvarna AB - Key offerings
- Husqvarna AB - Segment focus
- SWOT
- 16.9 Irritec SpA
- Irritec SpA - Overview
- Irritec SpA - Product / Service
- Irritec SpA - Key offerings
- SWOT
- 16.10 Jain Irrigation Systems Ltd.
- Jain Irrigation Systems Ltd. - Overview
- Jain Irrigation Systems Ltd. - Business segments
- Jain Irrigation Systems Ltd. - Key offerings
- Jain Irrigation Systems Ltd. - Segment focus
- SWOT
- 16.11 Lindsay Corp.
- Lindsay Corp. - Overview
- Lindsay Corp. - Business segments
- Lindsay Corp. - Key offerings
- Lindsay Corp. - Segment focus
- SWOT
- 16.12 Mahindra and Mahindra Ltd.
- Mahindra and Mahindra Ltd. - Overview
- Mahindra and Mahindra Ltd. - Business segments
- Mahindra and Mahindra Ltd. - Key news
- Mahindra and Mahindra Ltd. - Key offerings
- Mahindra and Mahindra Ltd. - Segment focus
- SWOT
- 16.13 Nelson Irrigation Corp.
- Nelson Irrigation Corp. - Overview
- Nelson Irrigation Corp. - Product / Service
- Nelson Irrigation Corp. - Key offerings
- SWOT
- 16.14 Netafim Ltd.
- Netafim Ltd. - Overview
- Netafim Ltd. - Product / Service
- Netafim Ltd. - Key offerings
- SWOT
- 16.15 Rain Bird Corp.
- Rain Bird Corp. - Overview
- Rain Bird Corp. - Product / Service
- Rain Bird Corp. - Key offerings
- SWOT
- 16.16 Rivulis Irrigation Ltd.
- Rivulis Irrigation Ltd. - Overview
- Rivulis Irrigation Ltd. - Product / Service
- Rivulis Irrigation Ltd. - Key offerings
- SWOT
- 16.17 The Toro Co.
- The Toro Co. - Overview
- The Toro Co. - Business segments
- The Toro Co. - Key news
- The Toro Co. - Key offerings
- The Toro Co. - Segment focus
- SWOT
- 16.18 Valmont Industries Inc.
- Valmont Industries Inc. - Overview
- Valmont Industries Inc. - Business segments
- Valmont Industries Inc. - Key offerings
- Valmont Industries Inc. - Segment focus
- SWOT
17 Appendix
- 17.1 Scope of the report
- 17.2 Inclusions and exclusions checklist
- Inclusions checklist
- Exclusions checklist
- 17.3 Currency conversion rates for US$
- Currency conversion rates for US$
- 17.4 Research methodology
- Research methodology
- 17.5 Data procurement
- Information sources
- 17.6 Data validation
- Data validation
- 17.7 Validation techniques employed for market sizing
- Validation techniques employed for market sizing
- 17.8 Data synthesis
- Data synthesis
- 17.9 360 degree market analysis
- 360 degree market analysis
- 17.10 List of abbreviations
- List of abbreviations

