
ドリップトレー市場の機会、成長促進要因、産業動向分析、2025年~2034年の予測
Drip Trays Market Opportunity, Growth Drivers, Industry Trend Analysis, and Forecast 2025 - 2034- 発行日
- ページ情報
- 英文 180 Pages
- 納期
- 2~3営業日
- 商品コード
- 1708156
- カスタマイズ可能 お客様のご希望に応じて、既存データの加工や未掲載情報(例:国別セグメント)の追加などの対応が可能です。詳細はお問い合わせください。
- 翻訳ツール提供対象 PDF対応AI翻訳ツールの無料貸し出しサービスのご利用が可能です
概要
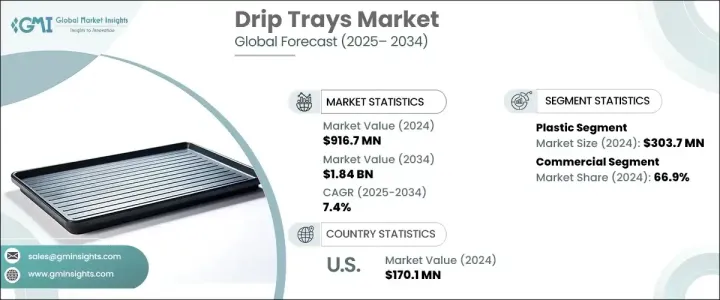
ドリップトレーの世界市場は、2024年に9億1,670万米ドルに達し、2025年から2034年にかけてCAGR 7.4%で成長すると予測されています。
この市場拡大の原動力となっているのは、素材とデザインの継続的な進歩であり、ドリップトレーをより耐久性が高く、効率的で、商業・産業用途に適したものにしています。環境に優しいソリューションへのシフトが市場の成長をさらに後押ししており、メーカーはアルミニウムや高密度ポリエチレン(HDPE)などの持続可能で高性能な素材に注力しています。こうした技術革新は、多様な業界のニーズに応える軽量で耐腐食性、長寿命のドリップトレイの開発に貢献しています。
多業種にわたり職場の安全性と流出封じ込めが重視されるようになったことで、企業は先進的なドリップトレーのソリューションを採用するようになっています。特に自動車、食品加工、製造業など、厳格な規制遵守を必要とする業界では、カスタマイズされた特殊な設計に対する需要が高まっています。企業は、環境リスクを最小限に抑え、業務効率を高めるために、効率的で費用対効果の高い封じ込めソリューションを求めています。さらに、技術の進歩により、ドリップトレーに自動漏出検知機能と漏出防止機能が導入され、機能性とエンドユーザーへの訴求力が向上しています。
| 市場範囲 | |
|---|---|
| 開始年 | 2024 |
| 予測年 | 2025-2034 |
| 開始金額 | 9億1,670万米ドル |
| 予測金額 | 18億4,000万米ドル |
| CAGR | 7.4% |
プラスチックセグメントは2024年に3億370万米ドルを生み出し、市場での存在感の強さを浮き彫りにしています。プラスチック製ドリップトレイは、費用対効果、汎用性、軽量性により広く好まれています。この素材固有の化学薬品や劣化に対する耐性は、自動車、製造、食品加工などのセクターにとって理想的な選択肢となっています。さらに、持続可能性を重視する業界の高まりは、再生プラスチックやバイオプラスチックの技術革新に拍車をかけ、環境に配慮したソリューションの可能性を広げています。規制の圧力が高まり、企業がより環境に優しい代替品を求める中、メーカーは研究開発に投資し、持続可能性の目標に沿った、耐久性があり、無害で、再利用可能なプラスチック製ドリップトレーを開発しています。
2024年の市場シェアは商業部門が66.9%と圧倒的で、さまざまな業界で封じ込めソリューションのニーズが高まっていることを強調しています。食品加工、自動車、製造分野の企業は、安全性、規制遵守、業務効率を高めるためにドリップトレーを採用しています。材料科学と製品設計の継続的な進歩により、これらのソリューションはこぼれや漏れを防止する上でより効果的になっており、その結果、職場における危険や環境負債が減少しています。企業が安全性と費用対効果の高い流出管理を優先していることから、ドリップトレー市場では業務用セクターが支配的な地位を維持すると予想されます。
米国のドリップトレー市場は2024年に1億7,010万米ドルと評価され、業界全体にわたる厳しい環境規制と安全プロトコルに支えられています。同市場は、特定の産業要件に合わせたカスタマイズドリップトレイの採用が増加していることから、着実な成長を遂げています。耐腐食性や軽量オプションなどの材料技術の革新が製品の魅力を高め、需要を牽引しています。企業はコンプライアンス基準を満たし、業務効率を向上させるため、高品質で耐久性のあるドリップトレーへの投資を増やしており、米国はドリップトレーの世界市場拡大に大きく貢献しています。
目次
第1章 調査手法と調査範囲
第2章 エグゼクティブサマリー
第3章 業界洞察
- エコシステム分析
- バリューチェーンに影響を与える要因。
- 利益率分析
- ディスラプション
- 将来の展望
- メーカー
- 流通業者
- サプライヤーの状況
- 利益率分析
- 主要ニュース
- 規制状況
- 影響要因
- 促進要因
- 労働安全および環境規制に対する意識の高まり
- 自動車産業や製造業などからの需要の高まり
- 素材の革新と環境に優しい設計
- 業界の潜在的リスク&課題
- 市場競争激化
- 原材料価格の変動
- 促進要因
- 潜在成長力の分析
- 技術概要
- ポーター分析
- PESTEL分析
第4章 競合情勢
- イントロダクション
- 企業シェア分析
- 競合のポジショニング・マトリックス
- 戦略展望マトリックス
第5章 市場推計・予測:材料タイプ別、2021年~2034年
- 主要動向
- プラスチック
- 金属
- ステンレス
- アルミニウム
- その他
- ガラス繊維
- その他(ゴム、複合材など)
第6章 市場推計・予測:デザイン別、2021年~2034年
- 主要動向
- フラット
- 格子状
- スタッキング可能
- その他(埋め込み型など)
第7章 市場規模推計・予測:サイズ別、2021年~2034年
- 主要動向
- 標準サイズ
- カスタムサイズ
- モジュラーシステム
第8章 市場推計・予測:最終用途別、2021年~2034年
- 主要動向
- 産業
- 工作機械
- 生産設備
- 化学プラント
- 石油・ガス
- 食品加工
- ユーティリティ
- その他(電子部品など)
- 商業
- レストラン&カフェ
- ホテル&ホスピタリティ
- 小売店
- オフィスビル
- 施設
- 病院
- その他(政府施設など)
- 住宅
第9章 市場推計・予測:流通チャネル別、2021年~2034年
- 主要動向
- 直接販売
- 間接販売
第10章 市場推計・予測:地域別、2021年~2034年
- 主要動向
- 北米
- 米国
- カナダ
- 欧州
- 英国
- ドイツ
- フランス
- イタリア
- スペイン
- アジア太平洋
- 中国
- 日本
- インド
- 韓国
- オーストラリア
- マレーシア
- インドネシア
- ラテンアメリカ
- ブラジル
- メキシコ
- 中東・アフリカ
- UAE
- サウジアラビア
- 南アフリカ
第11章 企業プロファイル
- Brewfitt
- DENIOS
- Drrader Manufacturing
- Eagle Manufacturing
- Haws
- Justrite
- MFG Tray
- Micro Matic
- New Pig
- Raffeiner GmbH
- Riverside Sheet Metal &Fabrications
- Short Run Pro
- SP Bel-Art
- Weber
- WirthCo Engineering
目次
The Global Drip Trays Market reached USD 916.7 million in 2024 and is projected to grow at a CAGR of 7.4% between 2025 and 2034. This expansion is driven by continuous advancements in material and design, making drip trays more durable, efficient, and suited for commercial and industrial applications. The shift toward eco-friendly solutions is further fueling market growth, with manufacturers focusing on sustainable and high-performance materials such as aluminum and High-Density Polyethylene (HDPE). These innovations contribute to the development of lightweight, corrosion-resistant, and long-lasting drip trays that cater to diverse industry needs.
A rising emphasis on workplace safety and spill containment across multiple industries is pushing businesses to adopt advanced drip tray solutions. The demand for customized and specialized designs is increasing, particularly in industries that require stringent regulatory compliance, such as automotive, food processing, and manufacturing. Companies are seeking efficient and cost-effective containment solutions to minimize environmental risks and enhance operational efficiency. Furthermore, technological advancements have introduced automated leak detection and spill prevention features in drip trays, improving their functionality and appeal to end users.
| Market Scope | |
|---|---|
| Start Year | 2024 |
| Forecast Year | 2025-2034 |
| Start Value | $916.7 million |
| Forecast Value | $1.84 billion |
| CAGR | 7.4% |
The plastic segment generated USD 303.7 million in 2024, highlighting its strong presence in the market. Plastic drip trays are widely preferred due to their cost-effectiveness, versatility, and lightweight nature, which enhances mobility and adaptability in different settings. The material's inherent resistance to chemicals and degradation makes it an ideal choice for sectors such as automotive, manufacturing, and food processing. Additionally, the industry's growing focus on sustainability has spurred innovations in recycled plastics and bioplastics, expanding opportunities for environmentally conscious solutions. As regulatory pressures mount and businesses seek greener alternatives, manufacturers are investing in research and development to create durable, non-toxic, and reusable plastic drip trays that align with sustainability goals.
The commercial sector held a commanding 66.9% market share in 2024, emphasizing the increasing need for containment solutions across various industries. Businesses in the food processing, automotive, and manufacturing sectors are adopting drip trays to enhance safety, regulatory compliance, and operational efficiency. The ongoing advancements in material science and product design are making these solutions more effective in preventing spills and leaks, thus reducing workplace hazards and environmental liabilities. As companies prioritize safety and cost-effective spill management, the commercial sector is expected to remain a dominant force in the drip trays market.
The U.S. drip trays market was valued at USD 170.1 million in 2024, supported by stringent environmental regulations and safety protocols across industries. The market is experiencing steady growth due to the rising adoption of customized drip trays tailored to specific industry requirements. Innovations in material technology, such as corrosion-resistant and lightweight options, are enhancing product appeal and driving demand. Companies are increasingly investing in high-quality, durable drip trays to meet compliance standards and improve operational efficiencies, making the U.S. a key contributor to the global drip trays market expansion.
Table of Contents
Chapter 1 Methodology & Scope
- 1.1 Market scope & definitions
- 1.2 Base estimates & calculations
- 1.3 Forecast calculations.
- 1.4 Data sources
- 1.4.1 Primary
- 1.4.2 Secondary
- 1.4.2.1 Paid sources
- 1.4.2.2 Public sources
Chapter 2 Executive Summary
- 2.1 Industry synopsis, 2021-2034
Chapter 3 Industry Insights
- 3.1 Industry ecosystem analysis
- 3.1.1 Factor affecting the value chain.
- 3.1.2 Profit margin analysis.
- 3.1.3 Disruptions
- 3.1.4 Future outlook
- 3.1.5 Manufacturers
- 3.1.6 Distributors
- 3.2 Supplier landscape
- 3.3 Profit margin analysis
- 3.4 Key news & initiatives
- 3.5 Regulatory landscape
- 3.6 Impact forces
- 3.6.1 Growth drivers
- 3.6.1.1 Increasing awareness of workplace safety and environmental regulations
- 3.6.1.2 Rising demand from industries such as automotive and manufacturing
- 3.6.1.3 Innovation in materials and eco-friendly designs
- 3.6.2 Industry pitfalls & challenges
- 3.6.2.1 High competition among market players
- 3.6.2.2 Fluctuating raw material prices
- 3.6.1 Growth drivers
- 3.7 Growth potential analysis
- 3.8 Technology overview
- 3.9 Porter's analysis
- 3.10 PESTEL analysis
Chapter 4 Competitive Landscape, 2024
- 4.1 Introduction
- 4.2 Company market share analysis
- 4.3 Competitive positioning matrix
- 4.4 Strategic outlook matrix
Chapter 5 Market Estimates & Forecast, By Material Type, 2021-2034 (USD Million) (Thousand Units)
- 5.1 Key trends
- 5.2 Plastic
- 5.3 Metal
- 5.3.1 Stainless steel
- 5.3.2 Aluminum
- 5.3.3 Others
- 5.4 Fiberglass
- 5.5 Others (Rubber, Composite, etc.)
Chapter 6 Market Estimates & Forecast, By Design, 2021-2034 (USD Million) (Thousand Units)
- 6.1 Key trends
- 6.2 Flat
- 6.3 Grated
- 6.4 Stackable
- 6.5 Others (Recessed, etc.)
Chapter 7 Market Estimates & Forecast, By Size, 2021-2034 (USD Million) (Thousand Units)
- 7.1 Key trends
- 7.2 Standard sizes
- 7.3 Custom sizes
- 7.4 Modular systems
Chapter 8 Market Estimates & Forecast, By End Use, 2021-2034 (USD Million) (Thousand Units)
- 8.1 Key trends
- 8.2 Industrial
- 8.2.1 Machine tools
- 8.2.2 Production equipment
- 8.2.3 Chemical plants
- 8.2.4 Oil & gas
- 8.2.5 Food processing
- 8.2.6 Utilities
- 8.2.7 Others (Electronic component, etc.)
- 8.3 Commercial
- 8.3.1 Restaurants & cafes
- 8.3.2 Hotels & hospitality
- 8.3.3 Retail stores
- 8.3.4 Office buildings
- 8.3.5 Institutional
- 8.3.6 Hospitals
- 8.3.7 Others (Government facilities, etc.)
- 8.4 Residential
Chapter 9 Market Estimates & Forecast, By Distribution Channel, 2021-2034 (USD Million) (Thousand Units)
- 9.1 Key trends
- 9.2 Direct sales
- 9.3 Indirect sales
Chapter 10 Market Estimates & Forecast, By Region, 2021-2034 (USD Million) (Thousand Units)
- 10.1 Key trends
- 10.2 North America
- 10.2.1 U.S.
- 10.2.2 Canada
- 10.3 Europe
- 10.3.1 UK
- 10.3.2 Germany
- 10.3.3 France
- 10.3.4 Italy
- 10.3.5 Spain
- 10.4 Asia Pacific
- 10.4.1 China
- 10.4.2 Japan
- 10.4.3 India
- 10.4.4 South Korea
- 10.4.5 Australia
- 10.4.6 Malaysia
- 10.4.7 Indonesia
- 10.5 Latin America
- 10.5.1 Brazil
- 10.5.2 Mexico
- 10.6 MEA
- 10.6.1 UAE
- 10.6.2 Saudi Arabia
- 10.6.3 South Africa
Chapter 11 Company Profiles
- 11.1 Brewfitt
- 11.2 DENIOS
- 11.3 Drrader Manufacturing
- 11.4 Eagle Manufacturing
- 11.5 Haws
- 11.6 Justrite
- 11.7 MFG Tray
- 11.8 Micro Matic
- 11.9 New Pig
- 11.10 Raffeiner GmbH
- 11.11 Riverside Sheet Metal & Fabrications
- 11.12 Short Run Pro
- 11.13 SP Bel-Art
- 11.14 Weber
- 11.15 WirthCo Engineering
- 発行日
- 発行
- Global Market Insights Inc.
- ページ情報
- 英文 180 Pages
- 納期
- 2~3営業日