|
|
市場調査レポート
商品コード
1626765
人口健康管理の世界市場 2025-2029年Global Population Health Management Market 2025-2029 |
||||||

|
|||||||
カスタマイズ可能
|
|||||||


| 人口健康管理の世界市場 2025-2029年 |
|
出版日: 2024年12月24日
発行: TechNavio
ページ情報: 英文 186 Pages
納期: 即納可能
|

全表示
- 概要
- 図表
- 目次
人口健康管理市場 2025-2029年
人口健康管理市場は2024-2029年に194億米ドル、予測期間中のCAGRは10.7%で成長すると予測されます。当レポートでは、人口健康管理市場の全体的な分析、市場規模・予測、動向、成長促進要因、課題、約25のベンダーを網羅したベンダー分析などを掲載しています。
現在の市場シナリオ、最新動向と促進要因、市場環境全体に関する最新分析を提供しています。市場は、ヘルスケアの導入の増加、専門病院やマルチチェーン病院の増加、慢性疾患の罹患率の増加によって牽引されています。
| 市場範囲 | |
|---|---|
| 基準年 | 2025 |
| 終了年 | 2029 |
| 予測期間 | 2025-2029 |
| 成長モメンタム | 加速 |
| 前年比2025年 | 9.7% |
| CAGR | 10.7% |
| 増分額 | 194億米ドル |
本調査では、個別化医療への注目の高まりが、今後数年間の人口健康管理市場の成長を牽引する主要因の1つであると分析しています。また、健康保険料の増加やビッグデータ分析の利用拡大も、市場の大きな需要につながります。
目次
第1章 エグゼクティブサマリー
- 市場概要
第2章 Technavio別分析
- 価格・ライフサイクル・顧客購入バスケット・採用率・購入基準の分析
- インプットの重要性と差別化の要因
- 混乱の要因
- 促進要因と課題の影響
第3章 市場情勢
- 市場エコシステム
- 市場の特徴
- バリューチェーン分析
第4章 市場規模
- 市場の定義
- 市場セグメント分析
- 市場規模 2024
- 市場の見通し 2024-2029
第5章 市場規模実績
- 人口健康管理の世界市場 2019-2023
- コンポーネント別セグメント分析 2019-2023
- エンドユーザー別セグメント分析 2019-2023
- 地域別セグメント分析 2019-2023
- 国別セグメント分析 2019-2023
第6章 定性分析
- AIの影響人口健康管理の世界市場
第7章 ファイブフォース分析
- ファイブフォースの要約
- 買い手の交渉力
- 供給企業の交渉力
- 新規参入業者の脅威
- 代替品の脅威
- 競争の脅威
- 市況
第8章 市場セグメンテーション:コンポーネント別
- 市場セグメント
- 比較:コンポーネント別
- ソフトウェア:市場規模と予測 2024-2029
- サービス:市場規模と予測 2024-2029
- 市場機会:コンポーネント別
第9章 市場セグメンテーション:エンドユーザー別
- 市場セグメント
- 比較:エンドユーザー別
- 大企業:市場規模と予測 2024-2029
- 中小企業:市場規模と予測 2024-2029
- 市場機会:エンドユーザー別
第10章 顧客情勢
- 顧客情勢の概要
第11章 地域別情勢
- 地域別セグメンテーション
- 地域別比較
- 北米:市場規模と予測 2024-2029
- 欧州:市場規模と予測 2024-2029
- アジア:市場規模と予測 2024-2029
- 世界のその他の地域:市場規模と予測 2024-2029
- 米国:市場規模と予測 2024-2029
- カナダ:市場規模と予測 2024-2029
- 英国:市場規模と予測 2024-2029
- 日本:市場規模と予測 2024-2029
- 中国:市場規模と予測 2024-2029
- インド:市場規模と予測 2024-2029
- ドイツ:市場規模と予測 2024-2029
- 韓国:市場規模と予測 2024-2029
- フランス:市場規模と予測 2024-2029
- イタリア:市場規模と予測 2024-2029
- 市場機会:地域情勢別
第12章 促進要因・課題・機会・抑制要因
- 市場促進要因
- 市場の課題
- 促進要因と課題の影響
- 市場の機会・抑制要因
第13章 競合情勢
- 概要
- 競合情勢
- 混乱の状況
- 業界のリスク
第14章 競合分析
- 企業プロファイル
- 企業ランキング指数
- 企業の市場ポジショニング
- ALLSCRIPTS HEALTHCARE SOLUTIONS INC.
- Arcadia Solutions LLC
- eClinicalWorks LLC
- HealthEC LLC
- i2i Systems Inc.
- Innovaccer Inc.
- International Business Machines Corp.
- Koninklijke Philips NV
- Lightbeam Health Solutions
- McKesson Corp.
- NextGen Healthcare Inc.
- Oracle Corp
- Press Ganey Associates LLC
- Tenet Healthcare Corp.
- ZeOmega Inc.
第15章 付録
Exhibits:
- Exhibits1: Executive Summary - Chart on Market Overview
- Exhibits2: Executive Summary - Data Table on Market Overview
- Exhibits3: Executive Summary - Chart on Global Market Characteristics
- Exhibits4: Executive Summary - Chart on Market By Geographical Landscape
- Exhibits5: Executive Summary - Chart on Market Segmentation by Component
- Exhibits6: Executive Summary - Chart on Market Segmentation by End-user
- Exhibits7: Executive Summary - Chart on Incremental Growth
- Exhibits8: Executive Summary - Data Table on Incremental Growth
- Exhibits9: Executive Summary - Chart on Company Market Positioning
- Exhibits10: Analysis of price sensitivity, lifecycle, customer purchase basket, adoption rates, and purchase criteria
- Exhibits11: Overview on criticality of inputs and factors of differentiation
- Exhibits12: Overview on factors of disruption
- Exhibits13: Impact of drivers and challenges in 2024 and 2029
- Exhibits14: Parent Market
- Exhibits15: Data Table on - Parent Market
- Exhibits16: Market characteristics analysis
- Exhibits17: Value chain analysis
- Exhibits18: Offerings of companies included in the market definition
- Exhibits19: Market segments
- Exhibits20: Chart on Global - Market size and forecast 2024-2029 ($ billion)
- Exhibits21: Data Table on Global - Market size and forecast 2024-2029 ($ billion)
- Exhibits22: Chart on Global Market: Year-over-year growth 2024-2029 (%)
- Exhibits23: Data Table on Global Market: Year-over-year growth 2024-2029 (%)
- Exhibits24: Historic Market Size - Data Table on Global Population Health Management Market 2019 - 2023 ($ billion)
- Exhibits25: Historic Market Size - Component Segment 2019 - 2023 ($ billion)
- Exhibits26: Historic Market Size - End-user Segment 2019 - 2023 ($ billion)
- Exhibits27: Historic Market Size - Geography Segment 2019 - 2023 ($ billion)
- Exhibits28: Historic Market Size - Country Segment 2019 - 2023 ($ billion)
- Exhibits29: Five forces analysis - Comparison between 2024 and 2029
- Exhibits30: Bargaining power of buyers - Impact of key factors 2024 and 2029
- Exhibits31: Bargaining power of suppliers - Impact of key factors in 2024 and 2029
- Exhibits32: Threat of new entrants - Impact of key factors in 2024 and 2029
- Exhibits33: Threat of substitutes - Impact of key factors in 2024 and 2029
- Exhibits34: Threat of rivalry - Impact of key factors in 2024 and 2029
- Exhibits35: Chart on Market condition - Five forces 2024 and 2029
- Exhibits36: Chart on Component - Market share 2024-2029 (%)
- Exhibits37: Data Table on Component - Market share 2024-2029 (%)
- Exhibits38: Chart on Comparison by Component
- Exhibits39: Data Table on Comparison by Component
- Exhibits40: Chart on Software - Market size and forecast 2024-2029 ($ billion)
- Exhibits41: Data Table on Software - Market size and forecast 2024-2029 ($ billion)
- Exhibits42: Chart on Software - Year-over-year growth 2024-2029 (%)
- Exhibits43: Data Table on Software - Year-over-year growth 2024-2029 (%)
- Exhibits44: Chart on Services - Market size and forecast 2024-2029 ($ billion)
- Exhibits45: Data Table on Services - Market size and forecast 2024-2029 ($ billion)
- Exhibits46: Chart on Services - Year-over-year growth 2024-2029 (%)
- Exhibits47: Data Table on Services - Year-over-year growth 2024-2029 (%)
- Exhibits48: Market opportunity by Component ($ billion)
- Exhibits49: Data Table on Market opportunity by Component ($ billion)
- Exhibits50: Chart on End-user - Market share 2024-2029 (%)
- Exhibits51: Data Table on End-user - Market share 2024-2029 (%)
- Exhibits52: Chart on Comparison by End-user
- Exhibits53: Data Table on Comparison by End-user
- Exhibits54: Chart on Large enterprises - Market size and forecast 2024-2029 ($ billion)
- Exhibits55: Data Table on Large enterprises - Market size and forecast 2024-2029 ($ billion)
- Exhibits56: Chart on Large enterprises - Year-over-year growth 2024-2029 (%)
- Exhibits57: Data Table on Large enterprises - Year-over-year growth 2024-2029 (%)
- Exhibits58: Chart on SMEs - Market size and forecast 2024-2029 ($ billion)
- Exhibits59: Data Table on SMEs - Market size and forecast 2024-2029 ($ billion)
- Exhibits60: Chart on SMEs - Year-over-year growth 2024-2029 (%)
- Exhibits61: Data Table on SMEs - Year-over-year growth 2024-2029 (%)
- Exhibits62: Market opportunity by End-user ($ billion)
- Exhibits63: Data Table on Market opportunity by End-user ($ billion)
- Exhibits64: Analysis of price sensitivity, lifecycle, customer purchase basket, adoption rates, and purchase criteria
- Exhibits65: Chart on Market share By Geographical Landscape 2024-2029 (%)
- Exhibits66: Data Table on Market share By Geographical Landscape 2024-2029 (%)
- Exhibits67: Chart on Geographic comparison
- Exhibits68: Data Table on Geographic comparison
- Exhibits69: Chart on North America - Market size and forecast 2024-2029 ($ billion)
- Exhibits70: Data Table on North America - Market size and forecast 2024-2029 ($ billion)
- Exhibits71: Chart on North America - Year-over-year growth 2024-2029 (%)
- Exhibits72: Data Table on North America - Year-over-year growth 2024-2029 (%)
- Exhibits73: Chart on Europe - Market size and forecast 2024-2029 ($ billion)
- Exhibits74: Data Table on Europe - Market size and forecast 2024-2029 ($ billion)
- Exhibits75: Chart on Europe - Year-over-year growth 2024-2029 (%)
- Exhibits76: Data Table on Europe - Year-over-year growth 2024-2029 (%)
- Exhibits77: Chart on Asia - Market size and forecast 2024-2029 ($ billion)
- Exhibits78: Data Table on Asia - Market size and forecast 2024-2029 ($ billion)
- Exhibits79: Chart on Asia - Year-over-year growth 2024-2029 (%)
- Exhibits80: Data Table on Asia - Year-over-year growth 2024-2029 (%)
- Exhibits81: Chart on Rest of World (ROW) - Market size and forecast 2024-2029 ($ billion)
- Exhibits82: Data Table on Rest of World (ROW) - Market size and forecast 2024-2029 ($ billion)
- Exhibits83: Chart on Rest of World (ROW) - Year-over-year growth 2024-2029 (%)
- Exhibits84: Data Table on Rest of World (ROW) - Year-over-year growth 2024-2029 (%)
- Exhibits85: Chart on US - Market size and forecast 2024-2029 ($ billion)
- Exhibits86: Data Table on US - Market size and forecast 2024-2029 ($ billion)
- Exhibits87: Chart on US - Year-over-year growth 2024-2029 (%)
- Exhibits88: Data Table on US - Year-over-year growth 2024-2029 (%)
- Exhibits89: Chart on Canada - Market size and forecast 2024-2029 ($ billion)
- Exhibits90: Data Table on Canada - Market size and forecast 2024-2029 ($ billion)
- Exhibits91: Chart on Canada - Year-over-year growth 2024-2029 (%)
- Exhibits92: Data Table on Canada - Year-over-year growth 2024-2029 (%)
- Exhibits93: Chart on UK - Market size and forecast 2024-2029 ($ billion)
- Exhibits94: Data Table on UK - Market size and forecast 2024-2029 ($ billion)
- Exhibits95: Chart on UK - Year-over-year growth 2024-2029 (%)
- Exhibits96: Data Table on UK - Year-over-year growth 2024-2029 (%)
- Exhibits97: Chart on Japan - Market size and forecast 2024-2029 ($ billion)
- Exhibits98: Data Table on Japan - Market size and forecast 2024-2029 ($ billion)
- Exhibits99: Chart on Japan - Year-over-year growth 2024-2029 (%)
- Exhibits100: Data Table on Japan - Year-over-year growth 2024-2029 (%)
- Exhibits101: Chart on China - Market size and forecast 2024-2029 ($ billion)
- Exhibits102: Data Table on China - Market size and forecast 2024-2029 ($ billion)
- Exhibits103: Chart on China - Year-over-year growth 2024-2029 (%)
- Exhibits104: Data Table on China - Year-over-year growth 2024-2029 (%)
- Exhibits105: Chart on India - Market size and forecast 2024-2029 ($ billion)
- Exhibits106: Data Table on India - Market size and forecast 2024-2029 ($ billion)
- Exhibits107: Chart on India - Year-over-year growth 2024-2029 (%)
- Exhibits108: Data Table on India - Year-over-year growth 2024-2029 (%)
- Exhibits109: Chart on Germany - Market size and forecast 2024-2029 ($ billion)
- Exhibits110: Data Table on Germany - Market size and forecast 2024-2029 ($ billion)
- Exhibits111: Chart on Germany - Year-over-year growth 2024-2029 (%)
- Exhibits112: Data Table on Germany - Year-over-year growth 2024-2029 (%)
- Exhibits113: Chart on South Korea - Market size and forecast 2024-2029 ($ billion)
- Exhibits114: Data Table on South Korea - Market size and forecast 2024-2029 ($ billion)
- Exhibits115: Chart on South Korea - Year-over-year growth 2024-2029 (%)
- Exhibits116: Data Table on South Korea - Year-over-year growth 2024-2029 (%)
- Exhibits117: Chart on France - Market size and forecast 2024-2029 ($ billion)
- Exhibits118: Data Table on France - Market size and forecast 2024-2029 ($ billion)
- Exhibits119: Chart on France - Year-over-year growth 2024-2029 (%)
- Exhibits120: Data Table on France - Year-over-year growth 2024-2029 (%)
- Exhibits121: Chart on Italy - Market size and forecast 2024-2029 ($ billion)
- Exhibits122: Data Table on Italy - Market size and forecast 2024-2029 ($ billion)
- Exhibits123: Chart on Italy - Year-over-year growth 2024-2029 (%)
- Exhibits124: Data Table on Italy - Year-over-year growth 2024-2029 (%)
- Exhibits125: Market opportunity By Geographical Landscape ($ billion)
- Exhibits126: Data Tables on Market opportunity By Geographical Landscape ($ billion)
- Exhibits127: Impact of drivers and challenges in 2024 and 2029
- Exhibits128: Overview on criticality of inputs and factors of differentiation
- Exhibits129: Overview on factors of disruption
- Exhibits130: Impact of key risks on business
- Exhibits131: Companies covered
- Exhibits132: Company ranking index
- Exhibits133: Matrix on companies position and classification
- Exhibits134: ALLSCRIPTS HEALTHCARE SOLUTIONS INC. - Overview
- Exhibits135: ALLSCRIPTS HEALTHCARE SOLUTIONS INC. - Product / Service
- Exhibits136: ALLSCRIPTS HEALTHCARE SOLUTIONS INC. - Key offerings
- Exhibits137: SWOT
- Exhibits138: Arcadia Solutions LLC - Overview
- Exhibits139: Arcadia Solutions LLC - Product / Service
- Exhibits140: Arcadia Solutions LLC - Key offerings
- Exhibits141: SWOT
- Exhibits142: eClinicalWorks LLC - Overview
- Exhibits143: eClinicalWorks LLC - Product / Service
- Exhibits144: eClinicalWorks LLC - Key offerings
- Exhibits145: SWOT
- Exhibits146: HealthEC LLC - Overview
- Exhibits147: HealthEC LLC - Product / Service
- Exhibits148: HealthEC LLC - Key offerings
- Exhibits149: SWOT
- Exhibits150: i2i Systems Inc. - Overview
- Exhibits151: i2i Systems Inc. - Product / Service
- Exhibits152: i2i Systems Inc. - Key offerings
- Exhibits153: SWOT
- Exhibits154: Innovaccer Inc. - Overview
- Exhibits155: Innovaccer Inc. - Product / Service
- Exhibits156: Innovaccer Inc. - Key offerings
- Exhibits157: SWOT
- Exhibits158: International Business Machines Corp. - Overview
- Exhibits159: International Business Machines Corp. - Business segments
- Exhibits160: International Business Machines Corp. - Key news
- Exhibits161: International Business Machines Corp. - Key offerings
- Exhibits162: International Business Machines Corp. - Segment focus
- Exhibits163: SWOT
- Exhibits164: Koninklijke Philips NV - Overview
- Exhibits165: Koninklijke Philips NV - Business segments
- Exhibits166: Koninklijke Philips NV - Key news
- Exhibits167: Koninklijke Philips NV - Key offerings
- Exhibits168: Koninklijke Philips NV - Segment focus
- Exhibits169: SWOT
- Exhibits170: Lightbeam Health Solutions - Overview
- Exhibits171: Lightbeam Health Solutions - Product / Service
- Exhibits172: Lightbeam Health Solutions - Key offerings
- Exhibits173: SWOT
- Exhibits174: McKesson Corp. - Overview
- Exhibits175: McKesson Corp. - Business segments
- Exhibits176: McKesson Corp. - Key news
- Exhibits177: McKesson Corp. - Key offerings
- Exhibits178: McKesson Corp. - Segment focus
- Exhibits179: SWOT
- Exhibits180: NextGen Healthcare Inc. - Overview
- Exhibits181: NextGen Healthcare Inc. - Product / Service
- Exhibits182: NextGen Healthcare Inc. - Key news
- Exhibits183: NextGen Healthcare Inc. - Key offerings
- Exhibits184: SWOT
- Exhibits185: Oracle Corp - Overview
- Exhibits186: Oracle Corp - Business segments
- Exhibits187: Oracle Corp - Key news
- Exhibits188: Oracle Corp - Key offerings
- Exhibits189: Oracle Corp - Segment focus
- Exhibits190: SWOT
- Exhibits191: Press Ganey Associates LLC - Overview
- Exhibits192: Press Ganey Associates LLC - Product / Service
- Exhibits193: Press Ganey Associates LLC - Key offerings
- Exhibits194: SWOT
- Exhibits195: Tenet Healthcare Corp. - Overview
- Exhibits196: Tenet Healthcare Corp. - Business segments
- Exhibits197: Tenet Healthcare Corp. - Key offerings
- Exhibits198: Tenet Healthcare Corp. - Segment focus
- Exhibits199: SWOT
- Exhibits200: ZeOmega Inc. - Overview
- Exhibits201: ZeOmega Inc. - Product / Service
- Exhibits202: ZeOmega Inc. - Key offerings
- Exhibits203: SWOT
- Exhibits204: Inclusions checklist
- Exhibits205: Exclusions checklist
- Exhibits206: Currency conversion rates for US$
- Exhibits207: Research methodology
- Exhibits208: Information sources
- Exhibits209: Data validation
- Exhibits210: Validation techniques employed for market sizing
- Exhibits211: Data synthesis
- Exhibits212: 360 degree market analysis
- Exhibits213: List of abbreviations
Population Health Management Market 2025-2029
The population health management market is forecasted to grow by USD 19.40 bn during 2024-2029, accelerating at a CAGR of 10.7% during the forecast period. The report on the population health management market provides a holistic analysis, market size and forecast, trends, growth drivers, and challenges, as well as vendor analysis covering around 25 vendors.
The report offers an up-to-date analysis regarding the current market scenario, the latest trends and drivers, and the overall market environment. The market is driven by rising adoption of healthcare it, increasing number of specialty and multi-chain hospitals, and growing incidence of chronic disorders.
| Market Scope | |
|---|---|
| Base Year | 2025 |
| End Year | 2029 |
| Series Year | 2025-2029 |
| Growth Momentum | Accelerate |
| YOY 2025 | 9.7% |
| CAGR | 10.7% |
| Incremental Value | $19.40 bn |
Technavio's population health management market is segmented as below:
By Component
- Software
- Services
By End-user
- Large enterprises
- SMEs
By Geographical Landscape
- North America
- Europe
- Asia
- Rest of World (ROW)
This study identifies the rising focus on personalized medicine as one of the prime reasons driving the population health management market growth during the next few years. Also, increasing health insurance premiums and growing use of big data analytics will lead to sizable demand in the market.
The report on the population health management market covers the following areas:
- Population Health Management Market sizing
- Population Health Management Market forecast
- Population Health Management Market industry analysis
The robust vendor analysis is designed to help clients improve their market position, and in line with this, this report provides a detailed analysis of several leading population health management market vendors that include ALLSCRIPTS HEALTHCARE SOLUTIONS INC., Arcadia Solutions LLC, athenahealth Inc., Cotiviti Inc., eClinicalWorks LLC, Health Catalyst Inc., HealthEC LLC, i2i Systems Inc., Innovaccer Inc., International Business Machines Corp., Koninklijke Philips NV, Lightbeam Health Solutions, McKesson Corp., NextGen Healthcare Inc., Omnicell Inc., Oracle Corp, Press Ganey Associates LLC, Siemens AG, Tenet Healthcare Corp., and ZeOmega Inc.. Also, the population health management market analysis report includes information on upcoming trends and challenges that will influence market growth. This is to help companies strategize and leverage all forthcoming growth opportunities.
The study was conducted using an objective combination of primary and secondary information including inputs from key participants in the industry. The report contains a comprehensive market and vendor landscape in addition to an analysis of the key vendors.
The publisher presents a detailed picture of the market by the way of study, synthesis, and summation of data from multiple sources by an analysis of key parameters such as profit, pricing, competition, and promotions. It presents various market facets by identifying the key industry influencers. The data presented is comprehensive, reliable, and a result of extensive primary and secondary research. The market research reports provide a complete competitive landscape and an in-depth vendor selection methodology and analysis using qualitative and quantitative research to forecast accurate market growth.
Table of Contents
1 Executive Summary
- 1.1 Market overview
- Executive Summary - Chart on Market Overview
- Executive Summary - Data Table on Market Overview
- Executive Summary - Chart on Global Market Characteristics
- Executive Summary - Chart on Market By Geographical Landscape
- Executive Summary - Chart on Market Segmentation by Component
- Executive Summary - Chart on Market Segmentation by End-user
- Executive Summary - Chart on Incremental Growth
- Executive Summary - Data Table on Incremental Growth
- Executive Summary - Chart on Company Market Positioning
2 Technavio Analysis
- 2.1 Analysis of price sensitivity, lifecycle, customer purchase basket, adoption rates, and purchase criteria
- Analysis of price sensitivity, lifecycle, customer purchase basket, adoption rates, and purchase criteria
- 2.2 Criticality of inputs and Factors of differentiation
- Overview on criticality of inputs and factors of differentiation
- 2.3 Factors of disruption
- Overview on factors of disruption
- 2.4 Impact of drivers and challenges
- Impact of drivers and challenges in 2024 and 2029
3 Market Landscape
- 3.1 Market ecosystem
- Parent Market
- Data Table on - Parent Market
- 3.2 Market characteristics
- Market characteristics analysis
- 3.3 Value chain analysis
- Value chain analysis
4 Market Sizing
- 4.1 Market definition
- Offerings of companies included in the market definition
- 4.2 Market segment analysis
- Market segments
- 4.3 Market size 2024
- 4.4 Market outlook: Forecast for 2024-2029
- Chart on Global - Market size and forecast 2024-2029 ($ billion)
- Data Table on Global - Market size and forecast 2024-2029 ($ billion)
- Chart on Global Market: Year-over-year growth 2024-2029 (%)
- Data Table on Global Market: Year-over-year growth 2024-2029 (%)
5 Historic Market Size
- 5.1 Global Population Health Management Market 2019 - 2023
- Historic Market Size - Data Table on Global Population Health Management Market 2019 - 2023 ($ billion)
- 5.2 Component segment analysis 2019 - 2023
- Historic Market Size - Component Segment 2019 - 2023 ($ billion)
- 5.3 End-user segment analysis 2019 - 2023
- Historic Market Size - End-user Segment 2019 - 2023 ($ billion)
- 5.4 Geography segment analysis 2019 - 2023
- Historic Market Size - Geography Segment 2019 - 2023 ($ billion)
- 5.5 Country segment analysis 2019 - 2023
- Historic Market Size - Country Segment 2019 - 2023 ($ billion)
6 Qualitative Analysis
- 6.1 The impact of AI in Global Population Health Management Market
7 Five Forces Analysis
- 7.1 Five forces summary
- Five forces analysis - Comparison between 2024 and 2029
- 7.2 Bargaining power of buyers
- Bargaining power of buyers - Impact of key factors 2024 and 2029
- 7.3 Bargaining power of suppliers
- Bargaining power of suppliers - Impact of key factors in 2024 and 2029
- 7.4 Threat of new entrants
- Threat of new entrants - Impact of key factors in 2024 and 2029
- 7.5 Threat of substitutes
- Threat of substitutes - Impact of key factors in 2024 and 2029
- 7.6 Threat of rivalry
- Threat of rivalry - Impact of key factors in 2024 and 2029
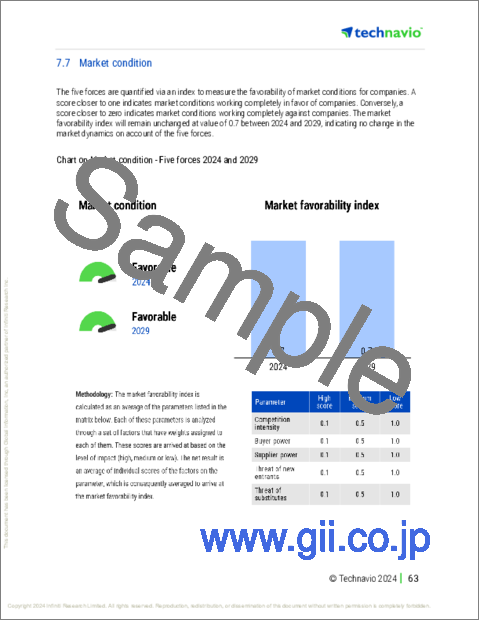
- 7.7 Market condition
- Chart on Market condition - Five forces 2024 and 2029
8 Market Segmentation by Component
- 8.1 Market segments
- Chart on Component - Market share 2024-2029 (%)
- Data Table on Component - Market share 2024-2029 (%)
- 8.2 Comparison by Component
- Chart on Comparison by Component
- Data Table on Comparison by Component
- 8.3 Software - Market size and forecast 2024-2029
- Chart on Software - Market size and forecast 2024-2029 ($ billion)
- Data Table on Software - Market size and forecast 2024-2029 ($ billion)
- Chart on Software - Year-over-year growth 2024-2029 (%)
- Data Table on Software - Year-over-year growth 2024-2029 (%)
- 8.4 Services - Market size and forecast 2024-2029
- Chart on Services - Market size and forecast 2024-2029 ($ billion)
- Data Table on Services - Market size and forecast 2024-2029 ($ billion)
- Chart on Services - Year-over-year growth 2024-2029 (%)
- Data Table on Services - Year-over-year growth 2024-2029 (%)
- 8.5 Market opportunity by Component
- Market opportunity by Component ($ billion)
- Data Table on Market opportunity by Component ($ billion)
9 Market Segmentation by End-user
- 9.1 Market segments
- Chart on End-user - Market share 2024-2029 (%)
- Data Table on End-user - Market share 2024-2029 (%)
- 9.2 Comparison by End-user
- Chart on Comparison by End-user
- Data Table on Comparison by End-user
- 9.3 Large enterprises - Market size and forecast 2024-2029
- Chart on Large enterprises - Market size and forecast 2024-2029 ($ billion)
- Data Table on Large enterprises - Market size and forecast 2024-2029 ($ billion)
- Chart on Large enterprises - Year-over-year growth 2024-2029 (%)
- Data Table on Large enterprises - Year-over-year growth 2024-2029 (%)
- 9.4 SMEs - Market size and forecast 2024-2029
- Chart on SMEs - Market size and forecast 2024-2029 ($ billion)
- Data Table on SMEs - Market size and forecast 2024-2029 ($ billion)
- Chart on SMEs - Year-over-year growth 2024-2029 (%)
- Data Table on SMEs - Year-over-year growth 2024-2029 (%)
- 9.5 Market opportunity by End-user
- Market opportunity by End-user ($ billion)
- Data Table on Market opportunity by End-user ($ billion)
10 Customer Landscape
- 10.1 Customer landscape overview
- Analysis of price sensitivity, lifecycle, customer purchase basket, adoption rates, and purchase criteria
11 Geographic Landscape
- 11.1 Geographic segmentation
- Chart on Market share By Geographical Landscape 2024-2029 (%)
- Data Table on Market share By Geographical Landscape 2024-2029 (%)
- 11.2 Geographic comparison
- Chart on Geographic comparison
- Data Table on Geographic comparison
- 11.3 North America - Market size and forecast 2024-2029
- Chart on North America - Market size and forecast 2024-2029 ($ billion)
- Data Table on North America - Market size and forecast 2024-2029 ($ billion)
- Chart on North America - Year-over-year growth 2024-2029 (%)
- Data Table on North America - Year-over-year growth 2024-2029 (%)
- 11.4 Europe - Market size and forecast 2024-2029
- Chart on Europe - Market size and forecast 2024-2029 ($ billion)
- Data Table on Europe - Market size and forecast 2024-2029 ($ billion)
- Chart on Europe - Year-over-year growth 2024-2029 (%)
- Data Table on Europe - Year-over-year growth 2024-2029 (%)
- 11.5 Asia - Market size and forecast 2024-2029
- Chart on Asia - Market size and forecast 2024-2029 ($ billion)
- Data Table on Asia - Market size and forecast 2024-2029 ($ billion)
- Chart on Asia - Year-over-year growth 2024-2029 (%)
- Data Table on Asia - Year-over-year growth 2024-2029 (%)
- 11.6 Rest of World (ROW) - Market size and forecast 2024-2029
- Chart on Rest of World (ROW) - Market size and forecast 2024-2029 ($ billion)
- Data Table on Rest of World (ROW) - Market size and forecast 2024-2029 ($ billion)
- Chart on Rest of World (ROW) - Year-over-year growth 2024-2029 (%)
- Data Table on Rest of World (ROW) - Year-over-year growth 2024-2029 (%)
- 11.7 US - Market size and forecast 2024-2029
- Chart on US - Market size and forecast 2024-2029 ($ billion)
- Data Table on US - Market size and forecast 2024-2029 ($ billion)
- Chart on US - Year-over-year growth 2024-2029 (%)
- Data Table on US - Year-over-year growth 2024-2029 (%)
- 11.8 Canada - Market size and forecast 2024-2029
- Chart on Canada - Market size and forecast 2024-2029 ($ billion)
- Data Table on Canada - Market size and forecast 2024-2029 ($ billion)
- Chart on Canada - Year-over-year growth 2024-2029 (%)
- Data Table on Canada - Year-over-year growth 2024-2029 (%)
- 11.9 UK - Market size and forecast 2024-2029
- Chart on UK - Market size and forecast 2024-2029 ($ billion)
- Data Table on UK - Market size and forecast 2024-2029 ($ billion)
- Chart on UK - Year-over-year growth 2024-2029 (%)
- Data Table on UK - Year-over-year growth 2024-2029 (%)
- 11.10 Japan - Market size and forecast 2024-2029
- Chart on Japan - Market size and forecast 2024-2029 ($ billion)
- Data Table on Japan - Market size and forecast 2024-2029 ($ billion)
- Chart on Japan - Year-over-year growth 2024-2029 (%)
- Data Table on Japan - Year-over-year growth 2024-2029 (%)
- 11.11 China - Market size and forecast 2024-2029
- Chart on China - Market size and forecast 2024-2029 ($ billion)
- Data Table on China - Market size and forecast 2024-2029 ($ billion)
- Chart on China - Year-over-year growth 2024-2029 (%)
- Data Table on China - Year-over-year growth 2024-2029 (%)
- 11.12 India - Market size and forecast 2024-2029
- Chart on India - Market size and forecast 2024-2029 ($ billion)
- Data Table on India - Market size and forecast 2024-2029 ($ billion)
- Chart on India - Year-over-year growth 2024-2029 (%)
- Data Table on India - Year-over-year growth 2024-2029 (%)
- 11.13 Germany - Market size and forecast 2024-2029
- Chart on Germany - Market size and forecast 2024-2029 ($ billion)
- Data Table on Germany - Market size and forecast 2024-2029 ($ billion)
- Chart on Germany - Year-over-year growth 2024-2029 (%)
- Data Table on Germany - Year-over-year growth 2024-2029 (%)
- 11.14 South Korea - Market size and forecast 2024-2029
- Chart on South Korea - Market size and forecast 2024-2029 ($ billion)
- Data Table on South Korea - Market size and forecast 2024-2029 ($ billion)
- Chart on South Korea - Year-over-year growth 2024-2029 (%)
- Data Table on South Korea - Year-over-year growth 2024-2029 (%)
- 11.15 France - Market size and forecast 2024-2029
- Chart on France - Market size and forecast 2024-2029 ($ billion)
- Data Table on France - Market size and forecast 2024-2029 ($ billion)
- Chart on France - Year-over-year growth 2024-2029 (%)
- Data Table on France - Year-over-year growth 2024-2029 (%)
- 11.16 Italy - Market size and forecast 2024-2029
- Chart on Italy - Market size and forecast 2024-2029 ($ billion)
- Data Table on Italy - Market size and forecast 2024-2029 ($ billion)
- Chart on Italy - Year-over-year growth 2024-2029 (%)
- Data Table on Italy - Year-over-year growth 2024-2029 (%)
- 11.17 Market opportunity By Geographical Landscape
- Market opportunity By Geographical Landscape ($ billion)
- Data Tables on Market opportunity By Geographical Landscape ($ billion)
12 Drivers, Challenges, and Opportunity/Restraints
- 12.1 Market drivers
- 12.2 Market challenges
- 12.3 Impact of drivers and challenges
- Impact of drivers and challenges in 2024 and 2029
- 12.4 Market opportunities/restraints
13 Competitive Landscape
- 13.1 Overview
- 13.2 Competitive Landscape
- Overview on criticality of inputs and factors of differentiation
- 13.3 Landscape disruption
- Overview on factors of disruption
- 13.4 Industry risks
- Impact of key risks on business
14 Competitive Analysis
- 14.1 Companies profiled
- Companies covered
- 14.2 Company ranking index
- Company ranking index
- 14.3 Market positioning of companies
- Matrix on companies position and classification
- 14.4 ALLSCRIPTS HEALTHCARE SOLUTIONS INC.
- ALLSCRIPTS HEALTHCARE SOLUTIONS INC. - Overview
- ALLSCRIPTS HEALTHCARE SOLUTIONS INC. - Product / Service
- ALLSCRIPTS HEALTHCARE SOLUTIONS INC. - Key offerings
- SWOT
- 14.5 Arcadia Solutions LLC
- Arcadia Solutions LLC - Overview
- Arcadia Solutions LLC - Product / Service
- Arcadia Solutions LLC - Key offerings
- SWOT
- 14.6 eClinicalWorks LLC
- eClinicalWorks LLC - Overview
- eClinicalWorks LLC - Product / Service
- eClinicalWorks LLC - Key offerings
- SWOT
- 14.7 HealthEC LLC
- HealthEC LLC - Overview
- HealthEC LLC - Product / Service
- HealthEC LLC - Key offerings
- SWOT
- 14.8 i2i Systems Inc.
- i2i Systems Inc. - Overview
- i2i Systems Inc. - Product / Service
- i2i Systems Inc. - Key offerings
- SWOT
- 14.9 Innovaccer Inc.
- Innovaccer Inc. - Overview
- Innovaccer Inc. - Product / Service
- Innovaccer Inc. - Key offerings
- SWOT
- 14.10 International Business Machines Corp.
- International Business Machines Corp. - Overview
- International Business Machines Corp. - Business segments
- International Business Machines Corp. - Key news
- International Business Machines Corp. - Key offerings
- International Business Machines Corp. - Segment focus
- SWOT
- 14.11 Koninklijke Philips NV
- Koninklijke Philips NV - Overview
- Koninklijke Philips NV - Business segments
- Koninklijke Philips NV - Key news
- Koninklijke Philips NV - Key offerings
- Koninklijke Philips NV - Segment focus
- SWOT
- 14.12 Lightbeam Health Solutions
- Lightbeam Health Solutions - Overview
- Lightbeam Health Solutions - Product / Service
- Lightbeam Health Solutions - Key offerings
- SWOT
- 14.13 McKesson Corp.
- McKesson Corp. - Overview
- McKesson Corp. - Business segments
- McKesson Corp. - Key news
- McKesson Corp. - Key offerings
- McKesson Corp. - Segment focus
- SWOT
- 14.14 NextGen Healthcare Inc.
- NextGen Healthcare Inc. - Overview
- NextGen Healthcare Inc. - Product / Service
- NextGen Healthcare Inc. - Key news
- NextGen Healthcare Inc. - Key offerings
- SWOT
- 14.15 Oracle Corp
- Oracle Corp - Overview
- Oracle Corp - Business segments
- Oracle Corp - Key news
- Oracle Corp - Key offerings
- Oracle Corp - Segment focus
- SWOT
- 14.16 Press Ganey Associates LLC
- Press Ganey Associates LLC - Overview
- Press Ganey Associates LLC - Product / Service
- Press Ganey Associates LLC - Key offerings
- SWOT
- 14.17 Tenet Healthcare Corp.
- Tenet Healthcare Corp. - Overview
- Tenet Healthcare Corp. - Business segments
- Tenet Healthcare Corp. - Key offerings
- Tenet Healthcare Corp. - Segment focus
- SWOT
- 14.18 ZeOmega Inc.
- ZeOmega Inc. - Overview
- ZeOmega Inc. - Product / Service
- ZeOmega Inc. - Key offerings
- SWOT
15 Appendix
- 15.1 Scope of the report
- 15.2 Inclusions and exclusions checklist
- Inclusions checklist
- Exclusions checklist
- 15.3 Currency conversion rates for US$
- Currency conversion rates for US$
- 15.4 Research methodology
- Research methodology
- 15.5 Data procurement
- Information sources
- 15.6 Data validation
- Data validation
- 15.7 Validation techniques employed for market sizing
- Validation techniques employed for market sizing
- 15.8 Data synthesis
- Data synthesis
- 15.9 360 degree market analysis
- 360 degree market analysis
- 15.10 List of abbreviations
- List of abbreviations

