|
|
市場調査レポート
商品コード
1685595
UAVの世界市場 2025~2029年Global UAV Market 2025-2029 |
||||||
|
|||||||
カスタマイズ可能
|
|||||||


| UAVの世界市場 2025~2029年 |
|
出版日: 2025年03月14日
発行: TechNavio
ページ情報: 英文 220 Pages
納期: 即納可能
|

全表示
- 概要
- 図表
- 目次
UAV市場は2024-2029年に375億2,830万米ドル、予測期間中のCAGRは15.1%で成長すると予測されます。
当レポートでは、UAV市場の全体的な分析、市場規模・予測、動向、成長促進要因、課題、約25のベンダーを網羅したベンダー分析などを掲載しています。
現在の市場シナリオ、最新動向と促進要因、市場環境全体に関する最新分析を提供しています。市場は、無人技術に対する防衛費の増加、戦闘機に代わる低コスト、小型化されたEO/IRシステムの出現によって牽引されています。
| 市場範囲 | |
|---|---|
| 基準年 | 2025 |
| 終了年 | 2029 |
| 予測期間 | 2025-2029 |
| 成長モメンタム | 加速 |
| 前年比2025年 | 10.9% |
| CAGR | 15.1% |
| 増分額 | 375億2,830万米ドル |
本調査は、業界の主要参加者からのインプットを含め、一次情報と二次情報を客観的に組み合わせて実施しました。レポートには、主要企業の分析に加え、包括的な市場規模データ、地域分析によるセグメント、ベンダー情勢が含まれています。レポートには過去データと予測データがあります。
本調査では、UAVの代替推進技術の開発が、今後数年間のUAV市場の成長を促進する主要な理由の1つであると特定しています。また、コンポジットベースのランディングギア設計への嗜好や自律型UAVへのAIの採用増加も、市場の大きな需要につながるでしょう。
目次
第1章 エグゼクティブサマリー
- 市場概要
第2章 Technavio分析
- 価格・ライフサイクル・顧客購入バスケット・採用率・購入基準の分析
- インプットの重要性と差別化の要因
- 混乱の要因
- 促進要因と課題の影響
第3章 市場情勢
- 市場エコシステム
- 市場の特徴
- バリューチェーン分析
第4章 市場規模
- 市場の定義
- 市場セグメント分析
- 市場規模 2024
- 市場の見通し 2024-2029
第5章 市場規模実績
- UAVの世界市場 2019-2023
- タイプ別セグメント分析 2019-2023
- 用途別セグメント分析 2019-2023
- クラスタイプ別セグメント分析 2019-2023
- 地域別セグメント分析 2019-2023
- 国別セグメント分析 2019-2023
第6章 定性分析
- AIの影響:UAVの世界市場
第7章 ファイブフォース分析
- ファイブフォースの要約
- 買い手の交渉力
- 供給企業の交渉力
- 新規参入業者の脅威
- 代替品の脅威
- 競争の脅威
- 市況
第8章 市場セグメンテーション:タイプ別
- 市場セグメント
- 比較:タイプ別
- 回転翼:市場規模と予測 2024-2029
- 固定翼:市場規模と予測 2024-2029
- ハイブリッド:市場規模と予測 2024-2029
- 市場機会:タイプ別
第9章 市場セグメンテーション:用途別
- 市場セグメント
- 比較:用途別
- 防衛と国土安全保障:市場規模と予測 2024-2029
- 商業および民事:市場規模と予測 2024-2029
- 市場機会:用途別
第10章 市場セグメンテーション:クラスタイプ別
- 市場セグメント
- 比較:クラスタイプ別
- 小型UAV:市場規模と予測 2024-2029
- 戦術的UAV:市場規模と予測 2024-2029
- ミニUAV:市場規模と予測 2024-2029
- マイクロUAV:市場規模と予測 2024-2029
- 市場機会:クラスタイプ別
第11章 顧客情勢
- 顧客情勢の概要
第12章 地域別情勢
- 地域別セグメンテーション
- 地域別比較
- アジア太平洋:市場規模と予測 2024-2029
- 北米:市場規模と予測 2024-2029
- 欧州:市場規模と予測 2024-2029
- 中東・アフリカ:市場規模と予測 2024-2029
- 南米:市場規模と予測 2024-2029
- 米国:市場規模と予測 2024-2029
- 中国:市場規模と予測 2024-2029
- 日本:市場規模と予測 2024-2029
- カナダ:市場規模と予測 2024-2029
- インド:市場規模と予測 2024-2029
- 韓国:市場規模と予測 2024-2029
- オーストラリア:市場規模と予測 2024-2029
- ドイツ:市場規模と予測 2024-2029
- メキシコ:市場規模と予測 2024-2029
- 英国:市場規模と予測 2024-2029
- 市場機会:地域情勢別
第13章 促進要因・課題・機会・抑制要因
- 市場促進要因
- 市場の課題
- 促進要因と課題の影響
- 市場の機会・抑制要因
第14章 競合情勢
- 概要
- 競合情勢
- 混乱の状況
- 業界のリスク
第15章 競合分析
- 企業プロファイル
- 企業ランキング指数
- 企業の市場ポジショニング
- AeroVironment Inc.
- BAE Systems Plc
- Draganfly Inc.
- Dynamatic Technologies
- Elbit Systems Ltd.
- Field Group AS
- General Atomics
- Israel Aerospace Industries Ltd.
- Lockheed Martin Corp.
- Northrop Grumman Corp.
- Parrot Drones SAS
- Rafael Advanced Defense Systems Ltd.
- RTX Corp.
- Textron Inc.
- Thales Group
第16章 付録
Exhibits:
- Exhibits1: Executive Summary - Chart on Market Overview
- Exhibits2: Executive Summary - Data Table on Market Overview
- Exhibits3: Executive Summary - Chart on Global Market Characteristics
- Exhibits4: Executive Summary - Chart on Market By Geographical Landscape
- Exhibits5: Executive Summary - Chart on Market Segmentation by Type
- Exhibits6: Executive Summary - Chart on Market Segmentation by Application
- Exhibits7: Executive Summary - Chart on Market Segmentation by Class Type
- Exhibits8: Executive Summary - Chart on Incremental Growth
- Exhibits9: Executive Summary - Data Table on Incremental Growth
- Exhibits10: Executive Summary - Chart on Company Market Positioning
- Exhibits11: Analysis of price sensitivity, lifecycle, customer purchase basket, adoption rates, and purchase criteria
- Exhibits12: Overview on criticality of inputs and factors of differentiation
- Exhibits13: Overview on factors of disruption
- Exhibits14: Impact of drivers and challenges in 2024 and 2029
- Exhibits15: Parent Market
- Exhibits16: Data Table on - Parent Market
- Exhibits17: Market characteristics analysis
- Exhibits18: Value chain analysis
- Exhibits19: Offerings of companies included in the market definition
- Exhibits20: Market segments
- Exhibits21: Chart on Global - Market size and forecast 2024-2029 ($ million)
- Exhibits22: Data Table on Global - Market size and forecast 2024-2029 ($ million)
- Exhibits23: Chart on Global Market: Year-over-year growth 2024-2029 (%)
- Exhibits24: Data Table on Global Market: Year-over-year growth 2024-2029 (%)
- Exhibits25: Historic Market Size - Data Table on Global UAV Market 2019 - 2023 ($ million)
- Exhibits26: Historic Market Size - Type Segment 2019 - 2023 ($ million)
- Exhibits27: Historic Market Size - Application Segment 2019 - 2023 ($ million)
- Exhibits28: Historic Market Size - Class Type Segment 2019 - 2023 ($ million)
- Exhibits29: Historic Market Size - Geography Segment 2019 - 2023 ($ million)
- Exhibits30: Historic Market Size - Country Segment 2019 - 2023 ($ million)
- Exhibits31: Five forces analysis - Comparison between 2024 and 2029
- Exhibits32: Bargaining power of buyers - Impact of key factors 2024 and 2029
- Exhibits33: Bargaining power of suppliers - Impact of key factors in 2024 and 2029
- Exhibits34: Threat of new entrants - Impact of key factors in 2024 and 2029
- Exhibits35: Threat of substitutes - Impact of key factors in 2024 and 2029
- Exhibits36: Threat of rivalry - Impact of key factors in 2024 and 2029
- Exhibits37: Chart on Market condition - Five forces 2024 and 2029
- Exhibits38: Chart on Type - Market share 2024-2029 (%)
- Exhibits39: Data Table on Type - Market share 2024-2029 (%)
- Exhibits40: Chart on Comparison by Type
- Exhibits41: Data Table on Comparison by Type
- Exhibits42: Chart on Rotary wing - Market size and forecast 2024-2029 ($ million)
- Exhibits43: Data Table on Rotary wing - Market size and forecast 2024-2029 ($ million)
- Exhibits44: Chart on Rotary wing - Year-over-year growth 2024-2029 (%)
- Exhibits45: Data Table on Rotary wing - Year-over-year growth 2024-2029 (%)
- Exhibits46: Chart on Fixed wing - Market size and forecast 2024-2029 ($ million)
- Exhibits47: Data Table on Fixed wing - Market size and forecast 2024-2029 ($ million)
- Exhibits48: Chart on Fixed wing - Year-over-year growth 2024-2029 (%)
- Exhibits49: Data Table on Fixed wing - Year-over-year growth 2024-2029 (%)
- Exhibits50: Chart on Hybrid - Market size and forecast 2024-2029 ($ million)
- Exhibits51: Data Table on Hybrid - Market size and forecast 2024-2029 ($ million)
- Exhibits52: Chart on Hybrid - Year-over-year growth 2024-2029 (%)
- Exhibits53: Data Table on Hybrid - Year-over-year growth 2024-2029 (%)
- Exhibits54: Market opportunity by Type ($ million)
- Exhibits55: Data Table on Market opportunity by Type ($ million)
- Exhibits56: Chart on Application - Market share 2024-2029 (%)
- Exhibits57: Data Table on Application - Market share 2024-2029 (%)
- Exhibits58: Chart on Comparison by Application
- Exhibits59: Data Table on Comparison by Application
- Exhibits60: Chart on Defense and homeland security - Market size and forecast 2024-2029 ($ million)
- Exhibits61: Data Table on Defense and homeland security - Market size and forecast 2024-2029 ($ million)
- Exhibits62: Chart on Defense and homeland security - Year-over-year growth 2024-2029 (%)
- Exhibits63: Data Table on Defense and homeland security - Year-over-year growth 2024-2029 (%)
- Exhibits64: Chart on Commercial and civil - Market size and forecast 2024-2029 ($ million)
- Exhibits65: Data Table on Commercial and civil - Market size and forecast 2024-2029 ($ million)
- Exhibits66: Chart on Commercial and civil - Year-over-year growth 2024-2029 (%)
- Exhibits67: Data Table on Commercial and civil - Year-over-year growth 2024-2029 (%)
- Exhibits68: Market opportunity by Application ($ million)
- Exhibits69: Data Table on Market opportunity by Application ($ million)
- Exhibits70: Chart on Class Type - Market share 2024-2029 (%)
- Exhibits71: Data Table on Class Type - Market share 2024-2029 (%)
- Exhibits72: Chart on Comparison by Class Type
- Exhibits73: Data Table on Comparison by Class Type
- Exhibits74: Chart on Small UAVs - Market size and forecast 2024-2029 ($ million)
- Exhibits75: Data Table on Small UAVs - Market size and forecast 2024-2029 ($ million)
- Exhibits76: Chart on Small UAVs - Year-over-year growth 2024-2029 (%)
- Exhibits77: Data Table on Small UAVs - Year-over-year growth 2024-2029 (%)
- Exhibits78: Chart on Tactical UAVs - Market size and forecast 2024-2029 ($ million)
- Exhibits79: Data Table on Tactical UAVs - Market size and forecast 2024-2029 ($ million)
- Exhibits80: Chart on Tactical UAVs - Year-over-year growth 2024-2029 (%)
- Exhibits81: Data Table on Tactical UAVs - Year-over-year growth 2024-2029 (%)
- Exhibits82: Chart on Mini UAVs - Market size and forecast 2024-2029 ($ million)
- Exhibits83: Data Table on Mini UAVs - Market size and forecast 2024-2029 ($ million)
- Exhibits84: Chart on Mini UAVs - Year-over-year growth 2024-2029 (%)
- Exhibits85: Data Table on Mini UAVs - Year-over-year growth 2024-2029 (%)
- Exhibits86: Chart on Micro UAVs - Market size and forecast 2024-2029 ($ million)
- Exhibits87: Data Table on Micro UAVs - Market size and forecast 2024-2029 ($ million)
- Exhibits88: Chart on Micro UAVs - Year-over-year growth 2024-2029 (%)
- Exhibits89: Data Table on Micro UAVs - Year-over-year growth 2024-2029 (%)
- Exhibits90: Market opportunity by Class Type ($ million)
- Exhibits91: Data Table on Market opportunity by Class Type ($ million)
- Exhibits92: Analysis of price sensitivity, lifecycle, customer purchase basket, adoption rates, and purchase criteria
- Exhibits93: Chart on Market share By Geographical Landscape 2024-2029 (%)
- Exhibits94: Data Table on Market share By Geographical Landscape 2024-2029 (%)
- Exhibits95: Chart on Geographic comparison
- Exhibits96: Data Table on Geographic comparison
- Exhibits97: Chart on APAC - Market size and forecast 2024-2029 ($ million)
- Exhibits98: Data Table on APAC - Market size and forecast 2024-2029 ($ million)
- Exhibits99: Chart on APAC - Year-over-year growth 2024-2029 (%)
- Exhibits100: Data Table on APAC - Year-over-year growth 2024-2029 (%)
- Exhibits101: Chart on North America - Market size and forecast 2024-2029 ($ million)
- Exhibits102: Data Table on North America - Market size and forecast 2024-2029 ($ million)
- Exhibits103: Chart on North America - Year-over-year growth 2024-2029 (%)
- Exhibits104: Data Table on North America - Year-over-year growth 2024-2029 (%)
- Exhibits105: Chart on Europe - Market size and forecast 2024-2029 ($ million)
- Exhibits106: Data Table on Europe - Market size and forecast 2024-2029 ($ million)
- Exhibits107: Chart on Europe - Year-over-year growth 2024-2029 (%)
- Exhibits108: Data Table on Europe - Year-over-year growth 2024-2029 (%)
- Exhibits109: Chart on Middle East and Africa - Market size and forecast 2024-2029 ($ million)
- Exhibits110: Data Table on Middle East and Africa - Market size and forecast 2024-2029 ($ million)
- Exhibits111: Chart on Middle East and Africa - Year-over-year growth 2024-2029 (%)
- Exhibits112: Data Table on Middle East and Africa - Year-over-year growth 2024-2029 (%)
- Exhibits113: Chart on South America - Market size and forecast 2024-2029 ($ million)
- Exhibits114: Data Table on South America - Market size and forecast 2024-2029 ($ million)
- Exhibits115: Chart on South America - Year-over-year growth 2024-2029 (%)
- Exhibits116: Data Table on South America - Year-over-year growth 2024-2029 (%)
- Exhibits117: Chart on US - Market size and forecast 2024-2029 ($ million)
- Exhibits118: Data Table on US - Market size and forecast 2024-2029 ($ million)
- Exhibits119: Chart on US - Year-over-year growth 2024-2029 (%)
- Exhibits120: Data Table on US - Year-over-year growth 2024-2029 (%)
- Exhibits121: Chart on China - Market size and forecast 2024-2029 ($ million)
- Exhibits122: Data Table on China - Market size and forecast 2024-2029 ($ million)
- Exhibits123: Chart on China - Year-over-year growth 2024-2029 (%)
- Exhibits124: Data Table on China - Year-over-year growth 2024-2029 (%)
- Exhibits125: Chart on Japan - Market size and forecast 2024-2029 ($ million)
- Exhibits126: Data Table on Japan - Market size and forecast 2024-2029 ($ million)
- Exhibits127: Chart on Japan - Year-over-year growth 2024-2029 (%)
- Exhibits128: Data Table on Japan - Year-over-year growth 2024-2029 (%)
- Exhibits129: Chart on Canada - Market size and forecast 2024-2029 ($ million)
- Exhibits130: Data Table on Canada - Market size and forecast 2024-2029 ($ million)
- Exhibits131: Chart on Canada - Year-over-year growth 2024-2029 (%)
- Exhibits132: Data Table on Canada - Year-over-year growth 2024-2029 (%)
- Exhibits133: Chart on India - Market size and forecast 2024-2029 ($ million)
- Exhibits134: Data Table on India - Market size and forecast 2024-2029 ($ million)
- Exhibits135: Chart on India - Year-over-year growth 2024-2029 (%)
- Exhibits136: Data Table on India - Year-over-year growth 2024-2029 (%)
- Exhibits137: Chart on South Korea - Market size and forecast 2024-2029 ($ million)
- Exhibits138: Data Table on South Korea - Market size and forecast 2024-2029 ($ million)
- Exhibits139: Chart on South Korea - Year-over-year growth 2024-2029 (%)
- Exhibits140: Data Table on South Korea - Year-over-year growth 2024-2029 (%)
- Exhibits141: Chart on Australia - Market size and forecast 2024-2029 ($ million)
- Exhibits142: Data Table on Australia - Market size and forecast 2024-2029 ($ million)
- Exhibits143: Chart on Australia - Year-over-year growth 2024-2029 (%)
- Exhibits144: Data Table on Australia - Year-over-year growth 2024-2029 (%)
- Exhibits145: Chart on Germany - Market size and forecast 2024-2029 ($ million)
- Exhibits146: Data Table on Germany - Market size and forecast 2024-2029 ($ million)
- Exhibits147: Chart on Germany - Year-over-year growth 2024-2029 (%)
- Exhibits148: Data Table on Germany - Year-over-year growth 2024-2029 (%)
- Exhibits149: Chart on Mexico - Market size and forecast 2024-2029 ($ million)
- Exhibits150: Data Table on Mexico - Market size and forecast 2024-2029 ($ million)
- Exhibits151: Chart on Mexico - Year-over-year growth 2024-2029 (%)
- Exhibits152: Data Table on Mexico - Year-over-year growth 2024-2029 (%)
- Exhibits153: Chart on UK - Market size and forecast 2024-2029 ($ million)
- Exhibits154: Data Table on UK - Market size and forecast 2024-2029 ($ million)
- Exhibits155: Chart on UK - Year-over-year growth 2024-2029 (%)
- Exhibits156: Data Table on UK - Year-over-year growth 2024-2029 (%)
- Exhibits157: Market opportunity By Geographical Landscape ($ million)
- Exhibits158: Data Tables on Market opportunity By Geographical Landscape ($ million)
- Exhibits159: Impact of drivers and challenges in 2024 and 2029
- Exhibits160: Overview on criticality of inputs and factors of differentiation
- Exhibits161: Overview on factors of disruption
- Exhibits162: Impact of key risks on business
- Exhibits163: Companies covered
- Exhibits164: Company ranking index
- Exhibits165: Matrix on companies position and classification
- Exhibits166: AeroVironment Inc. - Overview
- Exhibits167: AeroVironment Inc. - Business segments
- Exhibits168: AeroVironment Inc. - Key news
- Exhibits169: AeroVironment Inc. - Key offerings
- Exhibits170: AeroVironment Inc. - Segment focus
- Exhibits171: SWOT
- Exhibits172: BAE Systems Plc - Overview
- Exhibits173: BAE Systems Plc - Business segments
- Exhibits174: BAE Systems Plc - Key news
- Exhibits175: BAE Systems Plc - Key offerings
- Exhibits176: BAE Systems Plc - Segment focus
- Exhibits177: SWOT
- Exhibits178: Draganfly Inc. - Overview
- Exhibits179: Draganfly Inc. - Business segments
- Exhibits180: Draganfly Inc. - Key offerings
- Exhibits181: Draganfly Inc. - Segment focus
- Exhibits182: SWOT
- Exhibits183: Dynamatic Technologies - Overview
- Exhibits184: Dynamatic Technologies - Product / Service
- Exhibits185: Dynamatic Technologies - Key offerings
- Exhibits186: SWOT
- Exhibits187: Elbit Systems Ltd. - Overview
- Exhibits188: Elbit Systems Ltd. - Product / Service
- Exhibits189: Elbit Systems Ltd. - Key news
- Exhibits190: Elbit Systems Ltd. - Key offerings
- Exhibits191: SWOT
- Exhibits192: Field Group AS - Overview
- Exhibits193: Field Group AS - Product / Service
- Exhibits194: Field Group AS - Key offerings
- Exhibits195: SWOT
- Exhibits196: General Atomics - Overview
- Exhibits197: General Atomics - Product / Service
- Exhibits198: General Atomics - Key offerings
- Exhibits199: SWOT
- Exhibits200: Israel Aerospace Industries Ltd. - Overview
- Exhibits201: Israel Aerospace Industries Ltd. - Product / Service
- Exhibits202: Israel Aerospace Industries Ltd. - Key news
- Exhibits203: Israel Aerospace Industries Ltd. - Key offerings
- Exhibits204: SWOT
- Exhibits205: Lockheed Martin Corp. - Overview
- Exhibits206: Lockheed Martin Corp. - Business segments
- Exhibits207: Lockheed Martin Corp. - Key news
- Exhibits208: Lockheed Martin Corp. - Key offerings
- Exhibits209: Lockheed Martin Corp. - Segment focus
- Exhibits210: SWOT
- Exhibits211: Northrop Grumman Corp. - Overview
- Exhibits212: Northrop Grumman Corp. - Business segments
- Exhibits213: Northrop Grumman Corp. - Key news
- Exhibits214: Northrop Grumman Corp. - Key offerings
- Exhibits215: Northrop Grumman Corp. - Segment focus
- Exhibits216: SWOT
- Exhibits217: Parrot Drones SAS - Overview
- Exhibits218: Parrot Drones SAS - Product / Service
- Exhibits219: Parrot Drones SAS - Key offerings
- Exhibits220: SWOT
- Exhibits221: Rafael Advanced Defense Systems Ltd. - Overview
- Exhibits222: Rafael Advanced Defense Systems Ltd. - Product / Service
- Exhibits223: Rafael Advanced Defense Systems Ltd. - Key offerings
- Exhibits224: SWOT
- Exhibits225: RTX Corp. - Overview
- Exhibits226: RTX Corp. - Business segments
- Exhibits227: RTX Corp. - Key news
- Exhibits228: RTX Corp. - Key offerings
- Exhibits229: RTX Corp. - Segment focus
- Exhibits230: SWOT
- Exhibits231: Textron Inc. - Overview
- Exhibits232: Textron Inc. - Business segments
- Exhibits233: Textron Inc. - Key offerings
- Exhibits234: Textron Inc. - Segment focus
- Exhibits235: SWOT
- Exhibits236: Thales Group - Overview
- Exhibits237: Thales Group - Business segments
- Exhibits238: Thales Group - Key news
- Exhibits239: Thales Group - Key offerings
- Exhibits240: Thales Group - Segment focus
- Exhibits241: SWOT
- Exhibits242: Inclusions checklist
- Exhibits243: Exclusions checklist
- Exhibits244: Currency conversion rates for US$
- Exhibits245: Research methodology
- Exhibits246: Information sources
- Exhibits247: Data validation
- Exhibits248: Validation techniques employed for market sizing
- Exhibits249: Data synthesis
- Exhibits250: 360 degree market analysis
- Exhibits251: List of abbreviations
The UAV market is forecasted to grow by USD 37528.3 million during 2024-2029, accelerating at a CAGR of 15.1% during the forecast period. The report on the UAV market provides a holistic analysis, market size and forecast, trends, growth drivers, and challenges, as well as vendor analysis covering around 25 vendors.
The report offers an up-to-date analysis regarding the current market scenario, the latest trends and drivers, and the overall market environment. The market is driven by increasing defense spending on unmanned technologies, low-cost alternative to fighter jets, and emergence of miniaturized EO/IR systems.
| Market Scope | |
|---|---|
| Base Year | 2025 |
| End Year | 2029 |
| Series Year | 2025-2029 |
| Growth Momentum | Accelerate |
| YOY 2025 | 10.9% |
| CAGR | 15.1% |
| Incremental Value | $37528.3 mn |
The study was conducted using an objective combination of primary and secondary information including inputs from key participants in the industry. The report contains a comprehensive market size data, segment with regional analysis and vendor landscape in addition to an analysis of the key companies. Reports have historic and forecast data.
Technavio's UAV market is segmented as below:
By Type
- Rotary wing
- Fixed wing
- Hybrid
By Application
- Defense and homeland security
- Commercial and civil
By Class Type
- Small UAVs
- Tactical UAVs
- Mini UAVs
- Micro UAVs
By Geographical Landscape
- APAC
- North America
- Europe
- Middle East and Africa
- South America
This study identifies the development of alternate propulsion technologies for UAV as one of the prime reasons driving the UAV market growth during the next few years. Also, preference for composite-based landing gear design and increasing adoption of AI for autonomous UAVs will lead to sizable demand in the market.
The report on the UAV market covers the following areas:
- UAV Market sizing
- UAV Market forecast
- UAV Market industry analysis
The robust vendor analysis is designed to help clients improve their market position, and in line with this, this report provides a detailed analysis of several leading UAV market vendors that include AeroVironment Inc., BAE Systems PLC, DELAIR SAS, Draganfly Inc., Dynamatic Technologies, Elbit Systems Ltd., Field Group AS, General Atomics, Israel Aerospace Industries Ltd., Leonardo Spa, Lockheed Martin Corp., Northrop Grumman Corp., Parrot Drones SAS, Rafael Advanced Defense Systems Ltd., RTX Corp., SZ DJI Technology Co. Ltd., Textron Inc., Thales Group, The Boeing Co., and Turkish Aerospace Industries Inc.. Also, the UAV market analysis report includes information on upcoming trends and challenges that will influence market growth. This is to help companies strategize and leverage all forthcoming growth opportunities.
The publisher presents a detailed picture of the market by the way of study, synthesis, and summation of data from multiple sources by an analysis of key parameters such as profit, pricing, competition, and promotions. It presents various market facets by identifying the key industry influencers. The data presented is comprehensive, reliable, and a result of extensive primary and secondary research. The market research reports provide a complete competitive landscape and an in-depth vendor selection methodology and analysis using qualitative and quantitative research to forecast accurate market growth.
Table of Contents
1 Executive Summary
- 1.1 Market overview
- Executive Summary - Chart on Market Overview
- Executive Summary - Data Table on Market Overview
- Executive Summary - Chart on Global Market Characteristics
- Executive Summary - Chart on Market By Geographical Landscape
- Executive Summary - Chart on Market Segmentation by Type
- Executive Summary - Chart on Market Segmentation by Application
- Executive Summary - Chart on Market Segmentation by Class Type
- Executive Summary - Chart on Incremental Growth
- Executive Summary - Data Table on Incremental Growth
- Executive Summary - Chart on Company Market Positioning
2 Technavio Analysis
- 2.1 Analysis of price sensitivity, lifecycle, customer purchase basket, adoption rates, and purchase criteria
- Analysis of price sensitivity, lifecycle, customer purchase basket, adoption rates, and purchase criteria
- 2.2 Criticality of inputs and Factors of differentiation
- Overview on criticality of inputs and factors of differentiation
- 2.3 Factors of disruption
- Overview on factors of disruption
- 2.4 Impact of drivers and challenges
- Impact of drivers and challenges in 2024 and 2029
3 Market Landscape
- 3.1 Market ecosystem
- Parent Market
- Data Table on - Parent Market
- 3.2 Market characteristics
- Market characteristics analysis
- 3.3 Value chain analysis
- Value chain analysis
4 Market Sizing
- 4.1 Market definition
- Offerings of companies included in the market definition
- 4.2 Market segment analysis
- Market segments
- 4.3 Market size 2024
- 4.4 Market outlook: Forecast for 2024-2029
- Chart on Global - Market size and forecast 2024-2029 ($ million)
- Data Table on Global - Market size and forecast 2024-2029 ($ million)
- Chart on Global Market: Year-over-year growth 2024-2029 (%)
- Data Table on Global Market: Year-over-year growth 2024-2029 (%)
5 Historic Market Size
- 5.1 Global UAV Market 2019 - 2023
- Historic Market Size - Data Table on Global UAV Market 2019 - 2023 ($ million)
- 5.2 Type segment analysis 2019 - 2023
- Historic Market Size - Type Segment 2019 - 2023 ($ million)
- 5.3 Application segment analysis 2019 - 2023
- Historic Market Size - Application Segment 2019 - 2023 ($ million)
- 5.4 Class Type segment analysis 2019 - 2023
- Historic Market Size - Class Type Segment 2019 - 2023 ($ million)
- 5.5 Geography segment analysis 2019 - 2023
- Historic Market Size - Geography Segment 2019 - 2023 ($ million)
- 5.6 Country segment analysis 2019 - 2023
- Historic Market Size - Country Segment 2019 - 2023 ($ million)
6 Qualitative Analysis
- 6.1 Impact of AI on the global UAV market
7 Five Forces Analysis
- 7.1 Five forces summary
- Five forces analysis - Comparison between 2024 and 2029
- 7.2 Bargaining power of buyers
- Bargaining power of buyers - Impact of key factors 2024 and 2029
- 7.3 Bargaining power of suppliers
- Bargaining power of suppliers - Impact of key factors in 2024 and 2029
- 7.4 Threat of new entrants
- Threat of new entrants - Impact of key factors in 2024 and 2029
- 7.5 Threat of substitutes
- Threat of substitutes - Impact of key factors in 2024 and 2029
- 7.6 Threat of rivalry
- Threat of rivalry - Impact of key factors in 2024 and 2029
- 7.7 Market condition
- Chart on Market condition - Five forces 2024 and 2029
8 Market Segmentation by Type
- 8.1 Market segments
- Chart on Type - Market share 2024-2029 (%)
- Data Table on Type - Market share 2024-2029 (%)
- 8.2 Comparison by Type
- Chart on Comparison by Type
- Data Table on Comparison by Type
- 8.3 Rotary wing - Market size and forecast 2024-2029
- Chart on Rotary wing - Market size and forecast 2024-2029 ($ million)
- Data Table on Rotary wing - Market size and forecast 2024-2029 ($ million)
- Chart on Rotary wing - Year-over-year growth 2024-2029 (%)
- Data Table on Rotary wing - Year-over-year growth 2024-2029 (%)
- 8.4 Fixed wing - Market size and forecast 2024-2029
- Chart on Fixed wing - Market size and forecast 2024-2029 ($ million)
- Data Table on Fixed wing - Market size and forecast 2024-2029 ($ million)
- Chart on Fixed wing - Year-over-year growth 2024-2029 (%)
- Data Table on Fixed wing - Year-over-year growth 2024-2029 (%)
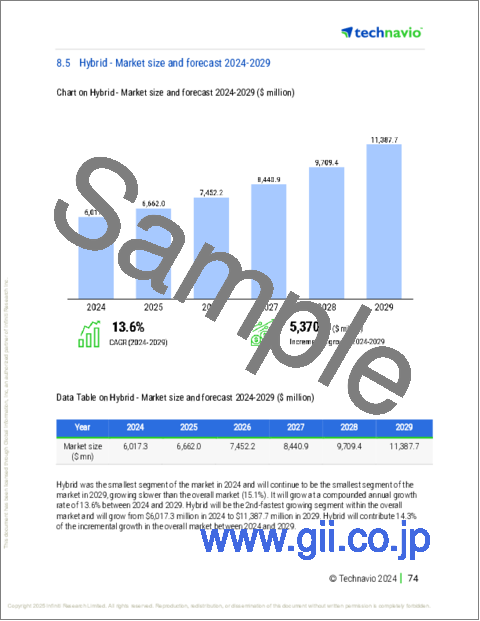
- 8.5 Hybrid - Market size and forecast 2024-2029
- Chart on Hybrid - Market size and forecast 2024-2029 ($ million)
- Data Table on Hybrid - Market size and forecast 2024-2029 ($ million)
- Chart on Hybrid - Year-over-year growth 2024-2029 (%)
- Data Table on Hybrid - Year-over-year growth 2024-2029 (%)
- 8.6 Market opportunity by Type
- Market opportunity by Type ($ million)
- Data Table on Market opportunity by Type ($ million)
9 Market Segmentation by Application
- 9.1 Market segments
- Chart on Application - Market share 2024-2029 (%)
- Data Table on Application - Market share 2024-2029 (%)
- 9.2 Comparison by Application
- Chart on Comparison by Application
- Data Table on Comparison by Application
- 9.3 Defense and homeland security - Market size and forecast 2024-2029
- Chart on Defense and homeland security - Market size and forecast 2024-2029 ($ million)
- Data Table on Defense and homeland security - Market size and forecast 2024-2029 ($ million)
- Chart on Defense and homeland security - Year-over-year growth 2024-2029 (%)
- Data Table on Defense and homeland security - Year-over-year growth 2024-2029 (%)
- 9.4 Commercial and civil - Market size and forecast 2024-2029
- Chart on Commercial and civil - Market size and forecast 2024-2029 ($ million)
- Data Table on Commercial and civil - Market size and forecast 2024-2029 ($ million)
- Chart on Commercial and civil - Year-over-year growth 2024-2029 (%)
- Data Table on Commercial and civil - Year-over-year growth 2024-2029 (%)
- 9.5 Market opportunity by Application
- Market opportunity by Application ($ million)
- Data Table on Market opportunity by Application ($ million)
10 Market Segmentation by Class Type
- 10.1 Market segments
- Chart on Class Type - Market share 2024-2029 (%)
- Data Table on Class Type - Market share 2024-2029 (%)
- 10.2 Comparison by Class Type
- Chart on Comparison by Class Type
- Data Table on Comparison by Class Type
- 10.3 Small UAVs - Market size and forecast 2024-2029
- Chart on Small UAVs - Market size and forecast 2024-2029 ($ million)
- Data Table on Small UAVs - Market size and forecast 2024-2029 ($ million)
- Chart on Small UAVs - Year-over-year growth 2024-2029 (%)
- Data Table on Small UAVs - Year-over-year growth 2024-2029 (%)
- 10.4 Tactical UAVs - Market size and forecast 2024-2029
- Chart on Tactical UAVs - Market size and forecast 2024-2029 ($ million)
- Data Table on Tactical UAVs - Market size and forecast 2024-2029 ($ million)
- Chart on Tactical UAVs - Year-over-year growth 2024-2029 (%)
- Data Table on Tactical UAVs - Year-over-year growth 2024-2029 (%)
- 10.5 Mini UAVs - Market size and forecast 2024-2029
- Chart on Mini UAVs - Market size and forecast 2024-2029 ($ million)
- Data Table on Mini UAVs - Market size and forecast 2024-2029 ($ million)
- Chart on Mini UAVs - Year-over-year growth 2024-2029 (%)
- Data Table on Mini UAVs - Year-over-year growth 2024-2029 (%)
- 10.6 Micro UAVs - Market size and forecast 2024-2029
- Chart on Micro UAVs - Market size and forecast 2024-2029 ($ million)
- Data Table on Micro UAVs - Market size and forecast 2024-2029 ($ million)
- Chart on Micro UAVs - Year-over-year growth 2024-2029 (%)
- Data Table on Micro UAVs - Year-over-year growth 2024-2029 (%)
- 10.7 Market opportunity by Class Type
- Market opportunity by Class Type ($ million)
- Data Table on Market opportunity by Class Type ($ million)
11 Customer Landscape
- 11.1 Customer landscape overview
- Analysis of price sensitivity, lifecycle, customer purchase basket, adoption rates, and purchase criteria
12 Geographic Landscape
- 12.1 Geographic segmentation
- Chart on Market share By Geographical Landscape 2024-2029 (%)
- Data Table on Market share By Geographical Landscape 2024-2029 (%)
- 12.2 Geographic comparison
- Chart on Geographic comparison
- Data Table on Geographic comparison
- 12.3 APAC - Market size and forecast 2024-2029
- Chart on APAC - Market size and forecast 2024-2029 ($ million)
- Data Table on APAC - Market size and forecast 2024-2029 ($ million)
- Chart on APAC - Year-over-year growth 2024-2029 (%)
- Data Table on APAC - Year-over-year growth 2024-2029 (%)
- 12.4 North America - Market size and forecast 2024-2029
- Chart on North America - Market size and forecast 2024-2029 ($ million)
- Data Table on North America - Market size and forecast 2024-2029 ($ million)
- Chart on North America - Year-over-year growth 2024-2029 (%)
- Data Table on North America - Year-over-year growth 2024-2029 (%)
- 12.5 Europe - Market size and forecast 2024-2029
- Chart on Europe - Market size and forecast 2024-2029 ($ million)
- Data Table on Europe - Market size and forecast 2024-2029 ($ million)
- Chart on Europe - Year-over-year growth 2024-2029 (%)
- Data Table on Europe - Year-over-year growth 2024-2029 (%)
- 12.6 Middle East and Africa - Market size and forecast 2024-2029
- Chart on Middle East and Africa - Market size and forecast 2024-2029 ($ million)
- Data Table on Middle East and Africa - Market size and forecast 2024-2029 ($ million)
- Chart on Middle East and Africa - Year-over-year growth 2024-2029 (%)
- Data Table on Middle East and Africa - Year-over-year growth 2024-2029 (%)
- 12.7 South America - Market size and forecast 2024-2029
- Chart on South America - Market size and forecast 2024-2029 ($ million)
- Data Table on South America - Market size and forecast 2024-2029 ($ million)
- Chart on South America - Year-over-year growth 2024-2029 (%)
- Data Table on South America - Year-over-year growth 2024-2029 (%)
- 12.8 US - Market size and forecast 2024-2029
- Chart on US - Market size and forecast 2024-2029 ($ million)
- Data Table on US - Market size and forecast 2024-2029 ($ million)
- Chart on US - Year-over-year growth 2024-2029 (%)
- Data Table on US - Year-over-year growth 2024-2029 (%)
- 12.9 China - Market size and forecast 2024-2029
- Chart on China - Market size and forecast 2024-2029 ($ million)
- Data Table on China - Market size and forecast 2024-2029 ($ million)
- Chart on China - Year-over-year growth 2024-2029 (%)
- Data Table on China - Year-over-year growth 2024-2029 (%)
- 12.10 Japan - Market size and forecast 2024-2029
- Chart on Japan - Market size and forecast 2024-2029 ($ million)
- Data Table on Japan - Market size and forecast 2024-2029 ($ million)
- Chart on Japan - Year-over-year growth 2024-2029 (%)
- Data Table on Japan - Year-over-year growth 2024-2029 (%)
- 12.11 Canada - Market size and forecast 2024-2029
- Chart on Canada - Market size and forecast 2024-2029 ($ million)
- Data Table on Canada - Market size and forecast 2024-2029 ($ million)
- Chart on Canada - Year-over-year growth 2024-2029 (%)
- Data Table on Canada - Year-over-year growth 2024-2029 (%)
- 12.12 India - Market size and forecast 2024-2029
- Chart on India - Market size and forecast 2024-2029 ($ million)
- Data Table on India - Market size and forecast 2024-2029 ($ million)
- Chart on India - Year-over-year growth 2024-2029 (%)
- Data Table on India - Year-over-year growth 2024-2029 (%)
- 12.13 South Korea - Market size and forecast 2024-2029
- Chart on South Korea - Market size and forecast 2024-2029 ($ million)
- Data Table on South Korea - Market size and forecast 2024-2029 ($ million)
- Chart on South Korea - Year-over-year growth 2024-2029 (%)
- Data Table on South Korea - Year-over-year growth 2024-2029 (%)
- 12.14 Australia - Market size and forecast 2024-2029
- Chart on Australia - Market size and forecast 2024-2029 ($ million)
- Data Table on Australia - Market size and forecast 2024-2029 ($ million)
- Chart on Australia - Year-over-year growth 2024-2029 (%)
- Data Table on Australia - Year-over-year growth 2024-2029 (%)
- 12.15 Germany - Market size and forecast 2024-2029
- Chart on Germany - Market size and forecast 2024-2029 ($ million)
- Data Table on Germany - Market size and forecast 2024-2029 ($ million)
- Chart on Germany - Year-over-year growth 2024-2029 (%)
- Data Table on Germany - Year-over-year growth 2024-2029 (%)
- 12.16 Mexico - Market size and forecast 2024-2029
- Chart on Mexico - Market size and forecast 2024-2029 ($ million)
- Data Table on Mexico - Market size and forecast 2024-2029 ($ million)
- Chart on Mexico - Year-over-year growth 2024-2029 (%)
- Data Table on Mexico - Year-over-year growth 2024-2029 (%)
- 12.17 UK - Market size and forecast 2024-2029
- Chart on UK - Market size and forecast 2024-2029 ($ million)
- Data Table on UK - Market size and forecast 2024-2029 ($ million)
- Chart on UK - Year-over-year growth 2024-2029 (%)
- Data Table on UK - Year-over-year growth 2024-2029 (%)
- 12.18 Market opportunity By Geographical Landscape
- Market opportunity By Geographical Landscape ($ million)
- Data Tables on Market opportunity By Geographical Landscape ($ million)
13 Drivers, Challenges, and Opportunity/Restraints
- 13.1 Market drivers
- 13.2 Market challenges
- 13.3 Impact of drivers and challenges
- Impact of drivers and challenges in 2024 and 2029
- 13.4 Market opportunities/restraints
14 Competitive Landscape
- 14.1 Overview
- 14.2 Competitive Landscape
- Overview on criticality of inputs and factors of differentiation
- 14.3 Landscape disruption
- Overview on factors of disruption
- 14.4 Industry risks
- Impact of key risks on business
15 Competitive Analysis
- 15.1 Companies profiled
- Companies covered
- 15.2 Company ranking index
- Company ranking index
- 15.3 Market positioning of companies
- Matrix on companies position and classification
- 15.4 AeroVironment Inc.
- AeroVironment Inc. - Overview
- AeroVironment Inc. - Business segments
- AeroVironment Inc. - Key news
- AeroVironment Inc. - Key offerings
- AeroVironment Inc. - Segment focus
- SWOT
- 15.5 BAE Systems Plc
- BAE Systems Plc - Overview
- BAE Systems Plc - Business segments
- BAE Systems Plc - Key news
- BAE Systems Plc - Key offerings
- BAE Systems Plc - Segment focus
- SWOT
- 15.6 Draganfly Inc.
- Draganfly Inc. - Overview
- Draganfly Inc. - Business segments
- Draganfly Inc. - Key offerings
- Draganfly Inc. - Segment focus
- SWOT
- 15.7 Dynamatic Technologies
- Dynamatic Technologies - Overview
- Dynamatic Technologies - Product / Service
- Dynamatic Technologies - Key offerings
- SWOT
- 15.8 Elbit Systems Ltd.
- Elbit Systems Ltd. - Overview
- Elbit Systems Ltd. - Product / Service
- Elbit Systems Ltd. - Key news
- Elbit Systems Ltd. - Key offerings
- SWOT
- 15.9 Field Group AS
- Field Group AS - Overview
- Field Group AS - Product / Service
- Field Group AS - Key offerings
- SWOT
- 15.10 General Atomics
- General Atomics - Overview
- General Atomics - Product / Service
- General Atomics - Key offerings
- SWOT
- 15.11 Israel Aerospace Industries Ltd.
- Israel Aerospace Industries Ltd. - Overview
- Israel Aerospace Industries Ltd. - Product / Service
- Israel Aerospace Industries Ltd. - Key news
- Israel Aerospace Industries Ltd. - Key offerings
- SWOT
- 15.12 Lockheed Martin Corp.
- Lockheed Martin Corp. - Overview
- Lockheed Martin Corp. - Business segments
- Lockheed Martin Corp. - Key news
- Lockheed Martin Corp. - Key offerings
- Lockheed Martin Corp. - Segment focus
- SWOT
- 15.13 Northrop Grumman Corp.
- Northrop Grumman Corp. - Overview
- Northrop Grumman Corp. - Business segments
- Northrop Grumman Corp. - Key news
- Northrop Grumman Corp. - Key offerings
- Northrop Grumman Corp. - Segment focus
- SWOT
- 15.14 Parrot Drones SAS
- Parrot Drones SAS - Overview
- Parrot Drones SAS - Product / Service
- Parrot Drones SAS - Key offerings
- SWOT
- 15.15 Rafael Advanced Defense Systems Ltd.
- Rafael Advanced Defense Systems Ltd. - Overview
- Rafael Advanced Defense Systems Ltd. - Product / Service
- Rafael Advanced Defense Systems Ltd. - Key offerings
- SWOT
- 15.16 RTX Corp.
- RTX Corp. - Overview
- RTX Corp. - Business segments
- RTX Corp. - Key news
- RTX Corp. - Key offerings
- RTX Corp. - Segment focus
- SWOT
- 15.17 Textron Inc.
- Textron Inc. - Overview
- Textron Inc. - Business segments
- Textron Inc. - Key offerings
- Textron Inc. - Segment focus
- SWOT
- 15.18 Thales Group
- Thales Group - Overview
- Thales Group - Business segments
- Thales Group - Key news
- Thales Group - Key offerings
- Thales Group - Segment focus
- SWOT
16 Appendix
- 16.1 Scope of the report
- 16.2 Inclusions and exclusions checklist
- Inclusions checklist
- Exclusions checklist
- 16.3 Currency conversion rates for US$
- Currency conversion rates for US$
- 16.4 Research methodology
- Research methodology
- 16.5 Data procurement
- Information sources
- 16.6 Data validation
- Data validation
- 16.7 Validation techniques employed for market sizing
- Validation techniques employed for market sizing
- 16.8 Data synthesis
- Data synthesis
- 16.9 360 degree market analysis
- 360 degree market analysis
- 16.10 List of abbreviations
- List of abbreviations

