|
|
市場調査レポート
商品コード
1693059
電力産業向け導電体の世界市場 2025~2029年Global Electrical Conductors Market for Power Industry 2025-2029 |
||||||

|
|||||||
カスタマイズ可能
|
|||||||


| 電力産業向け導電体の世界市場 2025~2029年 |
|
出版日: 2025年03月21日
発行: TechNavio
ページ情報: 英文 243 Pages
納期: 即納可能
|

全表示
- 概要
- 図表
- 目次
電力産業向け導電体市場は、2024-2029年に148億3,110万米ドル、予測期間中のCAGRは6.9%で成長すると予測されています。
当レポートでは、電力産業向け導電体の全体的な分析、市場規模・予測、動向、成長促進要因、課題、約25のベンダーを網羅したベンダー分析などを掲載しています。
現在の市場シナリオ、最新動向と促進要因、市場環境全体に関する最新分析を提供しています。市場は、トランスミッションと配電への投資の増加、洋上風力エネルギーの成長、再生可能エネルギープロジェクトへの投資の増加によって牽引されています。
| 市場範囲 | |
|---|---|
| 基準年 | 2025 |
| 終了年 | 2029 |
| 予測期間 | 2025-2029 |
| 成長モメンタム | 加速 |
| 前年比2025年 | 6.3% |
| CAGR | 6.9% |
| 増分額 | 148億3,110万米ドル |
本調査は、業界の主要参加者からのインプットを含め、一次情報と二次情報を客観的に組み合わせて実施しました。レポートには、主要企業の分析に加え、包括的な市場規模データ、地域分析によるセグメント、ベンダー情勢が含まれています。レポートには過去データと予測データがあります。
本調査では、今後数年間の電力産業向け導電体の成長を促進する主な理由の1つとして、電力ケーブルの販売増加を挙げています。また、スマートグリッドの開発と風力発電容量の増加が市場の大きな需要につながります。
目次
第1章 エグゼクティブサマリー
- 市場概要
第2章 Technavio分析
- 価格・ライフサイクル・顧客購入バスケット・採用率・購入基準の分析
- インプットの重要性と差別化の要因
- 混乱の要因
- 促進要因と課題の影響
第3章 市場情勢
- 市場エコシステム
- 市場の特徴
- バリューチェーン分析
第4章 市場規模
- 市場の定義
- 市場セグメント分析
- 市場規模 2024
- 市場の見通し 2024-2029
第5章 市場規模実績
- 電力産業向け導電体の世界市場 2019-2023
- 用途別セグメント分析 2019-2023
- タイプ別セグメント分析 2019-2023
- エンドユーザー別セグメント分析 2019-2023
- 素材別セグメント分析 2019-2023
- 地域別セグメント分析 2019-2023
- 国別セグメント分析 2019-2023
第6章 定性分析
- AIの影響:電力産業向け導電体の世界市場
第7章 ファイブフォース分析
- ファイブフォースの要約
- 買い手の交渉力
- 供給企業の交渉力
- 新規参入業者の脅威
- 代替品の脅威
- 競争の脅威
- 市況
第8章 市場セグメンテーション:用途別
- 市場セグメント
- 比較:用途別
- 電力伝達:市場規模と予測 2024-2029
- 電力分配:市場規模と予測 2024-2029
- その他:市場規模と予測 2024-2029
- 市場機会:用途別
第9章 市場セグメンテーション:タイプ別
- 市場セグメント
- 比較:タイプ別
- 電力ケーブル:市場規模と予測 2024-2029
- 変圧器:市場規模と予測 2024-2029
- バスバー:市場規模と予測 2024-2029
- 海底電力ケーブル:市場規模と予測 2024-2029
- 市場機会:タイプ別
第10章 市場セグメンテーション:エンドユーザー別
- 市場セグメント
- 比較:エンドユーザー別
- ユーティリティ:市場規模と予測 2024-2029
- 産業:市場規模と予測 2024-2029
- 商業用:市場規模と予測 2024-2029
- 住宅用:市場規模と予測 2024-2029
- 市場機会:エンドユーザー別
第11章 市場セグメンテーション:素材別
- 市場セグメント
- 比較:素材別
- 銅導体:市場規模と予測 2024-2029
- アルミニウム導体:市場規模と予測 2024-2029
- その他:市場規模と予測 2024-2029
- 市場機会:素材別
第12章 顧客情勢
- 顧客情勢の概要
第13章 地域別情勢
- 地域別セグメンテーション
- 地域別比較
- アジア太平洋:市場規模と予測 2024-2029
- 欧州:市場規模と予測 2024-2029
- 北米:市場規模と予測 2024-2029
- 南米:市場規模と予測 2024-2029
- 中東・アフリカ:市場規模と予測 2024-2029
- 米国:市場規模と予測 2024-2029
- 中国:市場規模と予測 2024-2029
- インド:市場規模と予測 2024-2029
- ドイツ:市場規模と予測 2024-2029
- 日本:市場規模と予測 2024-2029
- フランス:市場規模と予測 2024-2029
- カナダ:市場規模と予測 2024-2029
- 英国:市場規模と予測 2024-2029
- イタリア:市場規模と予測 2024-2029
- スペイン:市場規模と予測 2024-2029
- 市場機会:地域情勢別
第14章 促進要因・課題・機会・抑制要因
- 市場促進要因
- 市場の課題
- 促進要因と課題の影響
- 市場の機会・抑制要因
第15章 競合情勢
- 概要
- 競合情勢
- 混乱の状況
- 業界のリスク
第16章 競合分析
- 企業プロファイル
- 企業ランキング指数
- 企業の市場ポジショニング
- Apar Industries Ltd.
- Cabelte SA
- CTC Global Inc.
- Diamond Power Infrastructure Ltd.
- Furukawa Electric Co. Ltd.
- Gupta Power Infrastructure Ltd.
- Hi tech Conductors(p)Ltd.
- KEI Industries Ltd.
- Lamifil NV
- Nexans SA
- Prysmian SpA
- Sterlite Power Transmission Ltd.
- Sumitomo Electric Industries Ltd.
- Taihan Cable and Solution Co. Ltd.
第17章 付録
Exhibits:
- Exhibits1: Executive Summary - Chart on Market Overview
- Exhibits2: Executive Summary - Data Table on Market Overview
- Exhibits3: Executive Summary - Chart on Global Market Characteristics
- Exhibits4: Executive Summary - Chart on Market By Geographical Landscape
- Exhibits5: Executive Summary - Chart on Market Segmentation by Application
- Exhibits6: Executive Summary - Chart on Market Segmentation by Type
- Exhibits7: Executive Summary - Chart on Market Segmentation by End-user
- Exhibits8: Executive Summary - Chart on Market Segmentation by Material
- Exhibits9: Executive Summary - Chart on Incremental Growth
- Exhibits10: Executive Summary - Data Table on Incremental Growth
- Exhibits11: Executive Summary - Chart on Company Market Positioning
- Exhibits12: Analysis of price sensitivity, lifecycle, customer purchase basket, adoption rates, and purchase criteria
- Exhibits13: Overview on criticality of inputs and factors of differentiation
- Exhibits14: Overview on factors of disruption
- Exhibits15: Impact of drivers and challenges in 2024 and 2029
- Exhibits16: Parent Market
- Exhibits17: Data Table on - Parent Market
- Exhibits18: Market characteristics analysis
- Exhibits19: Value chain analysis
- Exhibits20: Offerings of companies included in the market definition
- Exhibits21: Market segments
- Exhibits22: Chart on Global - Market size and forecast 2024-2029 ($ million)
- Exhibits23: Data Table on Global - Market size and forecast 2024-2029 ($ million)
- Exhibits24: Chart on Global Market: Year-over-year growth 2024-2029 (%)
- Exhibits25: Data Table on Global Market: Year-over-year growth 2024-2029 (%)
- Exhibits26: Historic Market Size - Data Table on Global Electrical Conductors Market For Power Industry 2019 - 2023 ($ million)
- Exhibits27: Historic Market Size - Application Segment 2019 - 2023 ($ million)
- Exhibits28: Historic Market Size - Type Segment 2019 - 2023 ($ million)
- Exhibits29: Historic Market Size - End-user Segment 2019 - 2023 ($ million)
- Exhibits30: Historic Market Size - Material Segment 2019 - 2023 ($ million)
- Exhibits31: Historic Market Size - Geography Segment 2019 - 2023 ($ million)
- Exhibits32: Historic Market Size - Country Segment 2019 - 2023 ($ million)
- Exhibits33: Five forces analysis - Comparison between 2024 and 2029
- Exhibits34: Bargaining power of buyers - Impact of key factors 2024 and 2029
- Exhibits35: Bargaining power of suppliers - Impact of key factors in 2024 and 2029
- Exhibits36: Threat of new entrants - Impact of key factors in 2024 and 2029
- Exhibits37: Threat of substitutes - Impact of key factors in 2024 and 2029
- Exhibits38: Threat of rivalry - Impact of key factors in 2024 and 2029
- Exhibits39: Chart on Market condition - Five forces 2024 and 2029
- Exhibits40: Chart on Application - Market share 2024-2029 (%)
- Exhibits41: Data Table on Application - Market share 2024-2029 (%)
- Exhibits42: Chart on Comparison by Application
- Exhibits43: Data Table on Comparison by Application
- Exhibits44: Chart on Power transmission - Market size and forecast 2024-2029 ($ million)
- Exhibits45: Data Table on Power transmission - Market size and forecast 2024-2029 ($ million)
- Exhibits46: Chart on Power transmission - Year-over-year growth 2024-2029 (%)
- Exhibits47: Data Table on Power transmission - Year-over-year growth 2024-2029 (%)
- Exhibits48: Chart on Power distribution - Market size and forecast 2024-2029 ($ million)
- Exhibits49: Data Table on Power distribution - Market size and forecast 2024-2029 ($ million)
- Exhibits50: Chart on Power distribution - Year-over-year growth 2024-2029 (%)
- Exhibits51: Data Table on Power distribution - Year-over-year growth 2024-2029 (%)
- Exhibits52: Chart on Others - Market size and forecast 2024-2029 ($ million)
- Exhibits53: Data Table on Others - Market size and forecast 2024-2029 ($ million)
- Exhibits54: Chart on Others - Year-over-year growth 2024-2029 (%)
- Exhibits55: Data Table on Others - Year-over-year growth 2024-2029 (%)
- Exhibits56: Market opportunity by Application ($ million)
- Exhibits57: Data Table on Market opportunity by Application ($ million)
- Exhibits58: Chart on Type - Market share 2024-2029 (%)
- Exhibits59: Data Table on Type - Market share 2024-2029 (%)
- Exhibits60: Chart on Comparison by Type
- Exhibits61: Data Table on Comparison by Type
- Exhibits62: Chart on Power cables - Market size and forecast 2024-2029 ($ million)
- Exhibits63: Data Table on Power cables - Market size and forecast 2024-2029 ($ million)
- Exhibits64: Chart on Power cables - Year-over-year growth 2024-2029 (%)
- Exhibits65: Data Table on Power cables - Year-over-year growth 2024-2029 (%)
- Exhibits66: Chart on Transformer - Market size and forecast 2024-2029 ($ million)
- Exhibits67: Data Table on Transformer - Market size and forecast 2024-2029 ($ million)
- Exhibits68: Chart on Transformer - Year-over-year growth 2024-2029 (%)
- Exhibits69: Data Table on Transformer - Year-over-year growth 2024-2029 (%)
- Exhibits70: Chart on Busbar - Market size and forecast 2024-2029 ($ million)
- Exhibits71: Data Table on Busbar - Market size and forecast 2024-2029 ($ million)
- Exhibits72: Chart on Busbar - Year-over-year growth 2024-2029 (%)
- Exhibits73: Data Table on Busbar - Year-over-year growth 2024-2029 (%)
- Exhibits74: Chart on Submarine power cables - Market size and forecast 2024-2029 ($ million)
- Exhibits75: Data Table on Submarine power cables - Market size and forecast 2024-2029 ($ million)
- Exhibits76: Chart on Submarine power cables - Year-over-year growth 2024-2029 (%)
- Exhibits77: Data Table on Submarine power cables - Year-over-year growth 2024-2029 (%)
- Exhibits78: Market opportunity by Type ($ million)
- Exhibits79: Data Table on Market opportunity by Type ($ million)
- Exhibits80: Chart on End-user - Market share 2024-2029 (%)
- Exhibits81: Data Table on End-user - Market share 2024-2029 (%)
- Exhibits82: Chart on Comparison by End-user
- Exhibits83: Data Table on Comparison by End-user
- Exhibits84: Chart on Utilities - Market size and forecast 2024-2029 ($ million)
- Exhibits85: Data Table on Utilities - Market size and forecast 2024-2029 ($ million)
- Exhibits86: Chart on Utilities - Year-over-year growth 2024-2029 (%)
- Exhibits87: Data Table on Utilities - Year-over-year growth 2024-2029 (%)
- Exhibits88: Chart on Industrial - Market size and forecast 2024-2029 ($ million)
- Exhibits89: Data Table on Industrial - Market size and forecast 2024-2029 ($ million)
- Exhibits90: Chart on Industrial - Year-over-year growth 2024-2029 (%)
- Exhibits91: Data Table on Industrial - Year-over-year growth 2024-2029 (%)
- Exhibits92: Chart on Commercial - Market size and forecast 2024-2029 ($ million)
- Exhibits93: Data Table on Commercial - Market size and forecast 2024-2029 ($ million)
- Exhibits94: Chart on Commercial - Year-over-year growth 2024-2029 (%)
- Exhibits95: Data Table on Commercial - Year-over-year growth 2024-2029 (%)
- Exhibits96: Chart on Residential - Market size and forecast 2024-2029 ($ million)
- Exhibits97: Data Table on Residential - Market size and forecast 2024-2029 ($ million)
- Exhibits98: Chart on Residential - Year-over-year growth 2024-2029 (%)
- Exhibits99: Data Table on Residential - Year-over-year growth 2024-2029 (%)
- Exhibits100: Market opportunity by End-user ($ million)
- Exhibits101: Data Table on Market opportunity by End-user ($ million)
- Exhibits102: Chart on Material - Market share 2024-2029 (%)
- Exhibits103: Data Table on Material - Market share 2024-2029 (%)
- Exhibits104: Chart on Comparison by Material
- Exhibits105: Data Table on Comparison by Material
- Exhibits106: Chart on Copper conductors - Market size and forecast 2024-2029 ($ million)
- Exhibits107: Data Table on Copper conductors - Market size and forecast 2024-2029 ($ million)
- Exhibits108: Chart on Copper conductors - Year-over-year growth 2024-2029 (%)
- Exhibits109: Data Table on Copper conductors - Year-over-year growth 2024-2029 (%)
- Exhibits110: Chart on Aluminum conductors - Market size and forecast 2024-2029 ($ million)
- Exhibits111: Data Table on Aluminum conductors - Market size and forecast 2024-2029 ($ million)
- Exhibits112: Chart on Aluminum conductors - Year-over-year growth 2024-2029 (%)
- Exhibits113: Data Table on Aluminum conductors - Year-over-year growth 2024-2029 (%)
- Exhibits114: Chart on Others - Market size and forecast 2024-2029 ($ million)
- Exhibits115: Data Table on Others - Market size and forecast 2024-2029 ($ million)
- Exhibits116: Chart on Others - Year-over-year growth 2024-2029 (%)
- Exhibits117: Data Table on Others - Year-over-year growth 2024-2029 (%)
- Exhibits118: Market opportunity by Material ($ million)
- Exhibits119: Data Table on Market opportunity by Material ($ million)
- Exhibits120: Analysis of price sensitivity, lifecycle, customer purchase basket, adoption rates, and purchase criteria
- Exhibits121: Chart on Market share By Geographical Landscape 2024-2029 (%)
- Exhibits122: Data Table on Market share By Geographical Landscape 2024-2029 (%)
- Exhibits123: Chart on Geographic comparison
- Exhibits124: Data Table on Geographic comparison
- Exhibits125: Chart on APAC - Market size and forecast 2024-2029 ($ million)
- Exhibits126: Data Table on APAC - Market size and forecast 2024-2029 ($ million)
- Exhibits127: Chart on APAC - Year-over-year growth 2024-2029 (%)
- Exhibits128: Data Table on APAC - Year-over-year growth 2024-2029 (%)
- Exhibits129: Chart on Europe - Market size and forecast 2024-2029 ($ million)
- Exhibits130: Data Table on Europe - Market size and forecast 2024-2029 ($ million)
- Exhibits131: Chart on Europe - Year-over-year growth 2024-2029 (%)
- Exhibits132: Data Table on Europe - Year-over-year growth 2024-2029 (%)
- Exhibits133: Chart on North America - Market size and forecast 2024-2029 ($ million)
- Exhibits134: Data Table on North America - Market size and forecast 2024-2029 ($ million)
- Exhibits135: Chart on North America - Year-over-year growth 2024-2029 (%)
- Exhibits136: Data Table on North America - Year-over-year growth 2024-2029 (%)
- Exhibits137: Chart on South America - Market size and forecast 2024-2029 ($ million)
- Exhibits138: Data Table on South America - Market size and forecast 2024-2029 ($ million)
- Exhibits139: Chart on South America - Year-over-year growth 2024-2029 (%)
- Exhibits140: Data Table on South America - Year-over-year growth 2024-2029 (%)
- Exhibits141: Chart on Middle East and Africa - Market size and forecast 2024-2029 ($ million)
- Exhibits142: Data Table on Middle East and Africa - Market size and forecast 2024-2029 ($ million)
- Exhibits143: Chart on Middle East and Africa - Year-over-year growth 2024-2029 (%)
- Exhibits144: Data Table on Middle East and Africa - Year-over-year growth 2024-2029 (%)
- Exhibits145: Chart on US - Market size and forecast 2024-2029 ($ million)
- Exhibits146: Data Table on US - Market size and forecast 2024-2029 ($ million)
- Exhibits147: Chart on US - Year-over-year growth 2024-2029 (%)
- Exhibits148: Data Table on US - Year-over-year growth 2024-2029 (%)
- Exhibits149: Chart on China - Market size and forecast 2024-2029 ($ million)
- Exhibits150: Data Table on China - Market size and forecast 2024-2029 ($ million)
- Exhibits151: Chart on China - Year-over-year growth 2024-2029 (%)
- Exhibits152: Data Table on China - Year-over-year growth 2024-2029 (%)
- Exhibits153: Chart on India - Market size and forecast 2024-2029 ($ million)
- Exhibits154: Data Table on India - Market size and forecast 2024-2029 ($ million)
- Exhibits155: Chart on India - Year-over-year growth 2024-2029 (%)
- Exhibits156: Data Table on India - Year-over-year growth 2024-2029 (%)
- Exhibits157: Chart on Germany - Market size and forecast 2024-2029 ($ million)
- Exhibits158: Data Table on Germany - Market size and forecast 2024-2029 ($ million)
- Exhibits159: Chart on Germany - Year-over-year growth 2024-2029 (%)
- Exhibits160: Data Table on Germany - Year-over-year growth 2024-2029 (%)
- Exhibits161: Chart on Japan - Market size and forecast 2024-2029 ($ million)
- Exhibits162: Data Table on Japan - Market size and forecast 2024-2029 ($ million)
- Exhibits163: Chart on Japan - Year-over-year growth 2024-2029 (%)
- Exhibits164: Data Table on Japan - Year-over-year growth 2024-2029 (%)
- Exhibits165: Chart on France - Market size and forecast 2024-2029 ($ million)
- Exhibits166: Data Table on France - Market size and forecast 2024-2029 ($ million)
- Exhibits167: Chart on France - Year-over-year growth 2024-2029 (%)
- Exhibits168: Data Table on France - Year-over-year growth 2024-2029 (%)
- Exhibits169: Chart on Canada - Market size and forecast 2024-2029 ($ million)
- Exhibits170: Data Table on Canada - Market size and forecast 2024-2029 ($ million)
- Exhibits171: Chart on Canada - Year-over-year growth 2024-2029 (%)
- Exhibits172: Data Table on Canada - Year-over-year growth 2024-2029 (%)
- Exhibits173: Chart on UK - Market size and forecast 2024-2029 ($ million)
- Exhibits174: Data Table on UK - Market size and forecast 2024-2029 ($ million)
- Exhibits175: Chart on UK - Year-over-year growth 2024-2029 (%)
- Exhibits176: Data Table on UK - Year-over-year growth 2024-2029 (%)
- Exhibits177: Chart on Italy - Market size and forecast 2024-2029 ($ million)
- Exhibits178: Data Table on Italy - Market size and forecast 2024-2029 ($ million)
- Exhibits179: Chart on Italy - Year-over-year growth 2024-2029 (%)
- Exhibits180: Data Table on Italy - Year-over-year growth 2024-2029 (%)
- Exhibits181: Chart on Spain - Market size and forecast 2024-2029 ($ million)
- Exhibits182: Data Table on Spain - Market size and forecast 2024-2029 ($ million)
- Exhibits183: Chart on Spain - Year-over-year growth 2024-2029 (%)
- Exhibits184: Data Table on Spain - Year-over-year growth 2024-2029 (%)
- Exhibits185: Market opportunity By Geographical Landscape ($ million)
- Exhibits186: Data Tables on Market opportunity By Geographical Landscape ($ million)
- Exhibits187: Impact of drivers and challenges in 2024 and 2029
- Exhibits188: Overview on criticality of inputs and factors of differentiation
- Exhibits189: Overview on factors of disruption
- Exhibits190: Impact of key risks on business
- Exhibits191: Companies covered
- Exhibits192: Company ranking index
- Exhibits193: Matrix on companies position and classification
- Exhibits194: 3M Co. - Overview
- Exhibits195: 3M Co. - Business segments
- Exhibits196: 3M Co. - Key news
- Exhibits197: 3M Co. - Key offerings
- Exhibits198: 3M Co. - Segment focus
- Exhibits199: SWOT
- Exhibits200: Apar Industries Ltd. - Overview
- Exhibits201: Apar Industries Ltd. - Business segments
- Exhibits202: Apar Industries Ltd. - Key offerings
- Exhibits203: Apar Industries Ltd. - Segment focus
- Exhibits204: SWOT
- Exhibits205: Cabelte SA - Overview
- Exhibits206: Cabelte SA - Product / Service
- Exhibits207: Cabelte SA - Key offerings
- Exhibits208: SWOT
- Exhibits209: CTC Global Inc. - Overview
- Exhibits210: CTC Global Inc. - Product / Service
- Exhibits211: CTC Global Inc. - Key offerings
- Exhibits212: SWOT
- Exhibits213: Diamond Power Infrastructure Ltd. - Overview
- Exhibits214: Diamond Power Infrastructure Ltd. - Product / Service
- Exhibits215: Diamond Power Infrastructure Ltd. - Key offerings
- Exhibits216: SWOT
- Exhibits217: Furukawa Electric Co. Ltd. - Overview
- Exhibits218: Furukawa Electric Co. Ltd. - Business segments
- Exhibits219: Furukawa Electric Co. Ltd. - Key offerings
- Exhibits220: Furukawa Electric Co. Ltd. - Segment focus
- Exhibits221: SWOT
- Exhibits222: Gupta Power Infrastructure Ltd. - Overview
- Exhibits223: Gupta Power Infrastructure Ltd. - Product / Service
- Exhibits224: Gupta Power Infrastructure Ltd. - Key offerings
- Exhibits225: SWOT
- Exhibits226: Hi tech Conductors (p) Ltd. - Overview
- Exhibits227: Hi tech Conductors (p) Ltd. - Product / Service
- Exhibits228: Hi tech Conductors (p) Ltd. - Key offerings
- Exhibits229: SWOT
- Exhibits230: KEI Industries Ltd. - Overview
- Exhibits231: KEI Industries Ltd. - Business segments
- Exhibits232: KEI Industries Ltd. - Key offerings
- Exhibits233: KEI Industries Ltd. - Segment focus
- Exhibits234: SWOT
- Exhibits235: Lamifil NV - Overview
- Exhibits236: Lamifil NV - Product / Service
- Exhibits237: Lamifil NV - Key offerings
- Exhibits238: SWOT
- Exhibits239: Nexans SA - Overview
- Exhibits240: Nexans SA - Business segments
- Exhibits241: Nexans SA - Key news
- Exhibits242: Nexans SA - Key offerings
- Exhibits243: Nexans SA - Segment focus
- Exhibits244: SWOT
- Exhibits245: Prysmian SpA - Overview
- Exhibits246: Prysmian SpA - Business segments
- Exhibits247: Prysmian SpA - Key news
- Exhibits248: Prysmian SpA - Key offerings
- Exhibits249: Prysmian SpA - Segment focus
- Exhibits250: SWOT
- Exhibits251: Sterlite Power Transmission Ltd. - Overview
- Exhibits252: Sterlite Power Transmission Ltd. - Product / Service
- Exhibits253: Sterlite Power Transmission Ltd. - Key offerings
- Exhibits254: SWOT
- Exhibits255: Sumitomo Electric Industries Ltd. - Overview
- Exhibits256: Sumitomo Electric Industries Ltd. - Product / Service
- Exhibits257: Sumitomo Electric Industries Ltd. - Key offerings
- Exhibits258: SWOT
- Exhibits259: Taihan Cable and Solution Co. Ltd. - Overview
- Exhibits260: Taihan Cable and Solution Co. Ltd. - Product / Service
- Exhibits261: Taihan Cable and Solution Co. Ltd. - Key offerings
- Exhibits262: SWOT
- Exhibits263: Inclusions checklist
- Exhibits264: Exclusions checklist
- Exhibits265: Currency conversion rates for US$
- Exhibits266: Research methodology
- Exhibits267: Information sources
- Exhibits268: Data validation
- Exhibits269: Validation techniques employed for market sizing
- Exhibits270: Data synthesis
- Exhibits271: 360 degree market analysis
- Exhibits272: List of abbreviations
Electrical Conductors Market For Power Industry 2025-2029
The electrical conductors market for power industry is forecasted to grow by USD 14831.1 million during 2024-2029, accelerating at a CAGR of 6.9% during the forecast period. The report on the electrical conductors market for power industry provides a holistic analysis, market size and forecast, trends, growth drivers, and challenges, as well as vendor analysis covering around 25 vendors.
The report offers an up-to-date analysis regarding the current market scenario, the latest trends and drivers, and the overall market environment. The market is driven by rising investment in power transmission and distribution, growth in offshore wind energy, and increasing investments in renewable energy projects.
| Market Scope | |
|---|---|
| Base Year | 2025 |
| End Year | 2029 |
| Series Year | 2025-2029 |
| Growth Momentum | Accelerate |
| YOY 2025 | 6.3% |
| CAGR | 6.9% |
| Incremental Value | $14831.1 mn |
The study was conducted using an objective combination of primary and secondary information including inputs from key participants in the industry. The report contains a comprehensive market size data, segment with regional analysis and vendor landscape in addition to an analysis of the key companies. Reports have historic and forecast data.
Technavio's electrical conductors market for power industry is segmented as below:
By Application
- Power transmission
- Power distribution
- Others
By Type
- Power cables
- Transformer
- Busbar
- Submarine power cables
By End-user
- Utilities
- Industrial
- Commercial
- Residential
By Material
- Copper conductors
- Aluminum conductors
- Others
By Geographical Landscape
- APAC
- Europe
- North America
- South America
- Middle East and Africa
This study identifies the increase in sales of power cables as one of the prime reasons driving the electrical conductors market for power industry growth during the next few years. Also, development of smart grids and growing wind power generation capacity will lead to sizable demand in the market.
The report on the electrical conductors market for power industry covers the following areas:
- Electrical Conductors Market For Power Industry sizing
- Electrical Conductors Market For Power Industry forecast
- Electrical Conductors Market For Power Industry industry analysis
The robust vendor analysis is designed to help clients improve their market position, and in line with this, this report provides a detailed analysis of several leading electrical conductors market for power industry vendors that include 3M Co., Apar Industries Ltd., Cabelte SA, Calmont Wire and Cable Inc., CMI Ltd., CTC Global Inc., Diamond Power Infrastructure Ltd., Finolex Cables Ltd., Furukawa Electric Co. Ltd., Gupta Power Infrastructure Ltd., HELUKABEL Romania Srl, Hi tech Conductors (p) Ltd., KEI Industries Ltd., Lamifil NV, Nexans SA, Prysmian SpA, Saudi Cable Co., Sterlite Power Transmission Ltd., Sumitomo Electric Industries Ltd., and Taihan Cable and Solution Co. Ltd.. Also, the electrical conductors market for power industry analysis report includes information on upcoming trends and challenges that will influence market growth. This is to help companies strategize and leverage all forthcoming growth opportunities.
The publisher presents a detailed picture of the market by the way of study, synthesis, and summation of data from multiple sources by an analysis of key parameters such as profit, pricing, competition, and promotions. It presents various market facets by identifying the key industry influencers. The data presented is comprehensive, reliable, and a result of extensive primary and secondary research. The market research reports provide a complete competitive landscape and an in-depth vendor selection methodology and analysis using qualitative and quantitative research to forecast accurate market growth.
Table of Contents
1 Executive Summary
- 1.1 Market overview
- Executive Summary - Chart on Market Overview
- Executive Summary - Data Table on Market Overview
- Executive Summary - Chart on Global Market Characteristics
- Executive Summary - Chart on Market By Geographical Landscape
- Executive Summary - Chart on Market Segmentation by Application
- Executive Summary - Chart on Market Segmentation by Type
- Executive Summary - Chart on Market Segmentation by End-user
- Executive Summary - Chart on Market Segmentation by Material
- Executive Summary - Chart on Incremental Growth
- Executive Summary - Data Table on Incremental Growth
- Executive Summary - Chart on Company Market Positioning
2 Technavio Analysis
- 2.1 Analysis of price sensitivity, lifecycle, customer purchase basket, adoption rates, and purchase criteria
- Analysis of price sensitivity, lifecycle, customer purchase basket, adoption rates, and purchase criteria
- 2.2 Criticality of inputs and Factors of differentiation
- Overview on criticality of inputs and factors of differentiation
- 2.3 Factors of disruption
- Overview on factors of disruption
- 2.4 Impact of drivers and challenges
- Impact of drivers and challenges in 2024 and 2029
3 Market Landscape
- 3.1 Market ecosystem
- Parent Market
- Data Table on - Parent Market
- 3.2 Market characteristics
- Market characteristics analysis
- 3.3 Value chain analysis
- Value chain analysis
4 Market Sizing
- 4.1 Market definition
- Offerings of companies included in the market definition
- 4.2 Market segment analysis
- Market segments
- 4.3 Market size 2024
- 4.4 Market outlook: Forecast for 2024-2029
- Chart on Global - Market size and forecast 2024-2029 ($ million)
- Data Table on Global - Market size and forecast 2024-2029 ($ million)
- Chart on Global Market: Year-over-year growth 2024-2029 (%)
- Data Table on Global Market: Year-over-year growth 2024-2029 (%)
5 Historic Market Size
- 5.1 Global Electrical Conductors Market For Power Industry 2019 - 2023
- Historic Market Size - Data Table on Global Electrical Conductors Market For Power Industry 2019 - 2023 ($ million)
- 5.2 Application segment analysis 2019 - 2023
- Historic Market Size - Application Segment 2019 - 2023 ($ million)
- 5.3 Type segment analysis 2019 - 2023
- Historic Market Size - Type Segment 2019 - 2023 ($ million)
- 5.4 End-user segment analysis 2019 - 2023
- Historic Market Size - End-user Segment 2019 - 2023 ($ million)
- 5.5 Material segment analysis 2019 - 2023
- Historic Market Size - Material Segment 2019 - 2023 ($ million)
- 5.6 Geography segment analysis 2019 - 2023
- Historic Market Size - Geography Segment 2019 - 2023 ($ million)
- 5.7 Country segment analysis 2019 - 2023
- Historic Market Size - Country Segment 2019 - 2023 ($ million)
6 Qualitative Analysis
- 6.1 Impact of AI on the Global Electrical Conductors Market for Power Industry
7 Five Forces Analysis
- 7.1 Five forces summary
- Five forces analysis - Comparison between 2024 and 2029
- 7.2 Bargaining power of buyers
- Bargaining power of buyers - Impact of key factors 2024 and 2029
- 7.3 Bargaining power of suppliers
- Bargaining power of suppliers - Impact of key factors in 2024 and 2029
- 7.4 Threat of new entrants
- Threat of new entrants - Impact of key factors in 2024 and 2029
- 7.5 Threat of substitutes
- Threat of substitutes - Impact of key factors in 2024 and 2029
- 7.6 Threat of rivalry
- Threat of rivalry - Impact of key factors in 2024 and 2029
- 7.7 Market condition
- Chart on Market condition - Five forces 2024 and 2029
8 Market Segmentation by Application
- 8.1 Market segments
- Chart on Application - Market share 2024-2029 (%)
- Data Table on Application - Market share 2024-2029 (%)
- 8.2 Comparison by Application
- Chart on Comparison by Application
- Data Table on Comparison by Application
- 8.3 Power transmission - Market size and forecast 2024-2029
- Chart on Power transmission - Market size and forecast 2024-2029 ($ million)
- Data Table on Power transmission - Market size and forecast 2024-2029 ($ million)
- Chart on Power transmission - Year-over-year growth 2024-2029 (%)
- Data Table on Power transmission - Year-over-year growth 2024-2029 (%)
- 8.4 Power distribution - Market size and forecast 2024-2029
- Chart on Power distribution - Market size and forecast 2024-2029 ($ million)
- Data Table on Power distribution - Market size and forecast 2024-2029 ($ million)
- Chart on Power distribution - Year-over-year growth 2024-2029 (%)
- Data Table on Power distribution - Year-over-year growth 2024-2029 (%)
- 8.5 Others - Market size and forecast 2024-2029
- Chart on Others - Market size and forecast 2024-2029 ($ million)
- Data Table on Others - Market size and forecast 2024-2029 ($ million)
- Chart on Others - Year-over-year growth 2024-2029 (%)
- Data Table on Others - Year-over-year growth 2024-2029 (%)
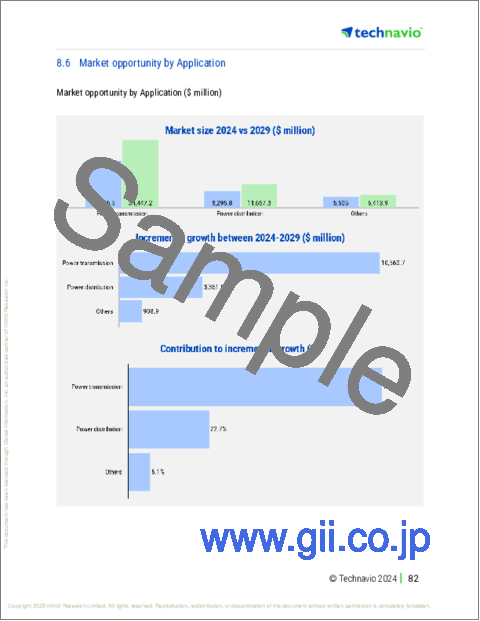
- 8.6 Market opportunity by Application
- Market opportunity by Application ($ million)
- Data Table on Market opportunity by Application ($ million)
9 Market Segmentation by Type
- 9.1 Market segments
- Chart on Type - Market share 2024-2029 (%)
- Data Table on Type - Market share 2024-2029 (%)
- 9.2 Comparison by Type
- Chart on Comparison by Type
- Data Table on Comparison by Type
- 9.3 Power cables - Market size and forecast 2024-2029
- Chart on Power cables - Market size and forecast 2024-2029 ($ million)
- Data Table on Power cables - Market size and forecast 2024-2029 ($ million)
- Chart on Power cables - Year-over-year growth 2024-2029 (%)
- Data Table on Power cables - Year-over-year growth 2024-2029 (%)
- 9.4 Transformer - Market size and forecast 2024-2029
- Chart on Transformer - Market size and forecast 2024-2029 ($ million)
- Data Table on Transformer - Market size and forecast 2024-2029 ($ million)
- Chart on Transformer - Year-over-year growth 2024-2029 (%)
- Data Table on Transformer - Year-over-year growth 2024-2029 (%)
- 9.5 Busbar - Market size and forecast 2024-2029
- Chart on Busbar - Market size and forecast 2024-2029 ($ million)
- Data Table on Busbar - Market size and forecast 2024-2029 ($ million)
- Chart on Busbar - Year-over-year growth 2024-2029 (%)
- Data Table on Busbar - Year-over-year growth 2024-2029 (%)
- 9.6 Submarine power cables - Market size and forecast 2024-2029
- Chart on Submarine power cables - Market size and forecast 2024-2029 ($ million)
- Data Table on Submarine power cables - Market size and forecast 2024-2029 ($ million)
- Chart on Submarine power cables - Year-over-year growth 2024-2029 (%)
- Data Table on Submarine power cables - Year-over-year growth 2024-2029 (%)
- 9.7 Market opportunity by Type
- Market opportunity by Type ($ million)
- Data Table on Market opportunity by Type ($ million)
10 Market Segmentation by End-user
- 10.1 Market segments
- Chart on End-user - Market share 2024-2029 (%)
- Data Table on End-user - Market share 2024-2029 (%)
- 10.2 Comparison by End-user
- Chart on Comparison by End-user
- Data Table on Comparison by End-user
- 10.3 Utilities - Market size and forecast 2024-2029
- Chart on Utilities - Market size and forecast 2024-2029 ($ million)
- Data Table on Utilities - Market size and forecast 2024-2029 ($ million)
- Chart on Utilities - Year-over-year growth 2024-2029 (%)
- Data Table on Utilities - Year-over-year growth 2024-2029 (%)
- 10.4 Industrial - Market size and forecast 2024-2029
- Chart on Industrial - Market size and forecast 2024-2029 ($ million)
- Data Table on Industrial - Market size and forecast 2024-2029 ($ million)
- Chart on Industrial - Year-over-year growth 2024-2029 (%)
- Data Table on Industrial - Year-over-year growth 2024-2029 (%)
- 10.5 Commercial - Market size and forecast 2024-2029
- Chart on Commercial - Market size and forecast 2024-2029 ($ million)
- Data Table on Commercial - Market size and forecast 2024-2029 ($ million)
- Chart on Commercial - Year-over-year growth 2024-2029 (%)
- Data Table on Commercial - Year-over-year growth 2024-2029 (%)
- 10.6 Residential - Market size and forecast 2024-2029
- Chart on Residential - Market size and forecast 2024-2029 ($ million)
- Data Table on Residential - Market size and forecast 2024-2029 ($ million)
- Chart on Residential - Year-over-year growth 2024-2029 (%)
- Data Table on Residential - Year-over-year growth 2024-2029 (%)
- 10.7 Market opportunity by End-user
- Market opportunity by End-user ($ million)
- Data Table on Market opportunity by End-user ($ million)
11 Market Segmentation by Material
- 11.1 Market segments
- Chart on Material - Market share 2024-2029 (%)
- Data Table on Material - Market share 2024-2029 (%)
- 11.2 Comparison by Material
- Chart on Comparison by Material
- Data Table on Comparison by Material
- 11.3 Copper conductors - Market size and forecast 2024-2029
- Chart on Copper conductors - Market size and forecast 2024-2029 ($ million)
- Data Table on Copper conductors - Market size and forecast 2024-2029 ($ million)
- Chart on Copper conductors - Year-over-year growth 2024-2029 (%)
- Data Table on Copper conductors - Year-over-year growth 2024-2029 (%)
- 11.4 Aluminum conductors - Market size and forecast 2024-2029
- Chart on Aluminum conductors - Market size and forecast 2024-2029 ($ million)
- Data Table on Aluminum conductors - Market size and forecast 2024-2029 ($ million)
- Chart on Aluminum conductors - Year-over-year growth 2024-2029 (%)
- Data Table on Aluminum conductors - Year-over-year growth 2024-2029 (%)
- 11.5 Others - Market size and forecast 2024-2029
- Chart on Others - Market size and forecast 2024-2029 ($ million)
- Data Table on Others - Market size and forecast 2024-2029 ($ million)
- Chart on Others - Year-over-year growth 2024-2029 (%)
- Data Table on Others - Year-over-year growth 2024-2029 (%)
- 11.6 Market opportunity by Material
- Market opportunity by Material ($ million)
- Data Table on Market opportunity by Material ($ million)
12 Customer Landscape
- 12.1 Customer landscape overview
- Analysis of price sensitivity, lifecycle, customer purchase basket, adoption rates, and purchase criteria
13 Geographic Landscape
- 13.1 Geographic segmentation
- Chart on Market share By Geographical Landscape 2024-2029 (%)
- Data Table on Market share By Geographical Landscape 2024-2029 (%)
- 13.2 Geographic comparison
- Chart on Geographic comparison
- Data Table on Geographic comparison
- 13.3 APAC - Market size and forecast 2024-2029
- Chart on APAC - Market size and forecast 2024-2029 ($ million)
- Data Table on APAC - Market size and forecast 2024-2029 ($ million)
- Chart on APAC - Year-over-year growth 2024-2029 (%)
- Data Table on APAC - Year-over-year growth 2024-2029 (%)
- 13.4 Europe - Market size and forecast 2024-2029
- Chart on Europe - Market size and forecast 2024-2029 ($ million)
- Data Table on Europe - Market size and forecast 2024-2029 ($ million)
- Chart on Europe - Year-over-year growth 2024-2029 (%)
- Data Table on Europe - Year-over-year growth 2024-2029 (%)
- 13.5 North America - Market size and forecast 2024-2029
- Chart on North America - Market size and forecast 2024-2029 ($ million)
- Data Table on North America - Market size and forecast 2024-2029 ($ million)
- Chart on North America - Year-over-year growth 2024-2029 (%)
- Data Table on North America - Year-over-year growth 2024-2029 (%)
- 13.6 South America - Market size and forecast 2024-2029
- Chart on South America - Market size and forecast 2024-2029 ($ million)
- Data Table on South America - Market size and forecast 2024-2029 ($ million)
- Chart on South America - Year-over-year growth 2024-2029 (%)
- Data Table on South America - Year-over-year growth 2024-2029 (%)
- 13.7 Middle East and Africa - Market size and forecast 2024-2029
- Chart on Middle East and Africa - Market size and forecast 2024-2029 ($ million)
- Data Table on Middle East and Africa - Market size and forecast 2024-2029 ($ million)
- Chart on Middle East and Africa - Year-over-year growth 2024-2029 (%)
- Data Table on Middle East and Africa - Year-over-year growth 2024-2029 (%)
- 13.8 US - Market size and forecast 2024-2029
- Chart on US - Market size and forecast 2024-2029 ($ million)
- Data Table on US - Market size and forecast 2024-2029 ($ million)
- Chart on US - Year-over-year growth 2024-2029 (%)
- Data Table on US - Year-over-year growth 2024-2029 (%)
- 13.9 China - Market size and forecast 2024-2029
- Chart on China - Market size and forecast 2024-2029 ($ million)
- Data Table on China - Market size and forecast 2024-2029 ($ million)
- Chart on China - Year-over-year growth 2024-2029 (%)
- Data Table on China - Year-over-year growth 2024-2029 (%)
- 13.10 India - Market size and forecast 2024-2029
- Chart on India - Market size and forecast 2024-2029 ($ million)
- Data Table on India - Market size and forecast 2024-2029 ($ million)
- Chart on India - Year-over-year growth 2024-2029 (%)
- Data Table on India - Year-over-year growth 2024-2029 (%)
- 13.11 Germany - Market size and forecast 2024-2029
- Chart on Germany - Market size and forecast 2024-2029 ($ million)
- Data Table on Germany - Market size and forecast 2024-2029 ($ million)
- Chart on Germany - Year-over-year growth 2024-2029 (%)
- Data Table on Germany - Year-over-year growth 2024-2029 (%)
- 13.12 Japan - Market size and forecast 2024-2029
- Chart on Japan - Market size and forecast 2024-2029 ($ million)
- Data Table on Japan - Market size and forecast 2024-2029 ($ million)
- Chart on Japan - Year-over-year growth 2024-2029 (%)
- Data Table on Japan - Year-over-year growth 2024-2029 (%)
- 13.13 France - Market size and forecast 2024-2029
- Chart on France - Market size and forecast 2024-2029 ($ million)
- Data Table on France - Market size and forecast 2024-2029 ($ million)
- Chart on France - Year-over-year growth 2024-2029 (%)
- Data Table on France - Year-over-year growth 2024-2029 (%)
- 13.14 Canada - Market size and forecast 2024-2029
- Chart on Canada - Market size and forecast 2024-2029 ($ million)
- Data Table on Canada - Market size and forecast 2024-2029 ($ million)
- Chart on Canada - Year-over-year growth 2024-2029 (%)
- Data Table on Canada - Year-over-year growth 2024-2029 (%)
- 13.15 UK - Market size and forecast 2024-2029
- Chart on UK - Market size and forecast 2024-2029 ($ million)
- Data Table on UK - Market size and forecast 2024-2029 ($ million)
- Chart on UK - Year-over-year growth 2024-2029 (%)
- Data Table on UK - Year-over-year growth 2024-2029 (%)
- 13.16 Italy - Market size and forecast 2024-2029
- Chart on Italy - Market size and forecast 2024-2029 ($ million)
- Data Table on Italy - Market size and forecast 2024-2029 ($ million)
- Chart on Italy - Year-over-year growth 2024-2029 (%)
- Data Table on Italy - Year-over-year growth 2024-2029 (%)
- 13.17 Spain - Market size and forecast 2024-2029
- Chart on Spain - Market size and forecast 2024-2029 ($ million)
- Data Table on Spain - Market size and forecast 2024-2029 ($ million)
- Chart on Spain - Year-over-year growth 2024-2029 (%)
- Data Table on Spain - Year-over-year growth 2024-2029 (%)
- 13.18 Market opportunity By Geographical Landscape
- Market opportunity By Geographical Landscape ($ million)
- Data Tables on Market opportunity By Geographical Landscape ($ million)
14 Drivers, Challenges, and Opportunity/Restraints
- 14.1 Market drivers
- 14.2 Market challenges
- 14.3 Impact of drivers and challenges
- Impact of drivers and challenges in 2024 and 2029
- 14.4 Market opportunities/restraints
15 Competitive Landscape
- 15.1 Overview
- 15.2 Competitive Landscape
- Overview on criticality of inputs and factors of differentiation
- 15.3 Landscape disruption
- Overview on factors of disruption
- 15.4 Industry risks
- Impact of key risks on business
16 Competitive Analysis
- 16.1 Companies profiled
- Companies covered
- 16.2 Company ranking index
- Company ranking index
- 16.3 Market positioning of companies
- Matrix on companies position and classification
- 3M Co.
- 3M Co. - Overview
- 3M Co. - Business segments
- 3M Co. - Key news
- 3M Co. - Key offerings
- 3M Co. - Segment focus
- SWOT
- 16.5 Apar Industries Ltd.
- Apar Industries Ltd. - Overview
- Apar Industries Ltd. - Business segments
- Apar Industries Ltd. - Key offerings
- Apar Industries Ltd. - Segment focus
- SWOT
- 16.6 Cabelte SA
- Cabelte SA - Overview
- Cabelte SA - Product / Service
- Cabelte SA - Key offerings
- SWOT
- 16.7 CTC Global Inc.
- CTC Global Inc. - Overview
- CTC Global Inc. - Product / Service
- CTC Global Inc. - Key offerings
- SWOT
- 16.8 Diamond Power Infrastructure Ltd.
- Diamond Power Infrastructure Ltd. - Overview
- Diamond Power Infrastructure Ltd. - Product / Service
- Diamond Power Infrastructure Ltd. - Key offerings
- SWOT
- 16.9 Furukawa Electric Co. Ltd.
- Furukawa Electric Co. Ltd. - Overview
- Furukawa Electric Co. Ltd. - Business segments
- Furukawa Electric Co. Ltd. - Key offerings
- Furukawa Electric Co. Ltd. - Segment focus
- SWOT
- 16.10 Gupta Power Infrastructure Ltd.
- Gupta Power Infrastructure Ltd. - Overview
- Gupta Power Infrastructure Ltd. - Product / Service
- Gupta Power Infrastructure Ltd. - Key offerings
- SWOT
- 16.11 Hi tech Conductors (p) Ltd.
- Hi tech Conductors (p) Ltd. - Overview
- Hi tech Conductors (p) Ltd. - Product / Service
- Hi tech Conductors (p) Ltd. - Key offerings
- SWOT
- 16.12 KEI Industries Ltd.
- KEI Industries Ltd. - Overview
- KEI Industries Ltd. - Business segments
- KEI Industries Ltd. - Key offerings
- KEI Industries Ltd. - Segment focus
- SWOT
- 16.13 Lamifil NV
- Lamifil NV - Overview
- Lamifil NV - Product / Service
- Lamifil NV - Key offerings
- SWOT
- 16.14 Nexans SA
- Nexans SA - Overview
- Nexans SA - Business segments
- Nexans SA - Key news
- Nexans SA - Key offerings
- Nexans SA - Segment focus
- SWOT
- 16.15 Prysmian SpA
- Prysmian SpA - Overview
- Prysmian SpA - Business segments
- Prysmian SpA - Key news
- Prysmian SpA - Key offerings
- Prysmian SpA - Segment focus
- SWOT
- 16.16 Sterlite Power Transmission Ltd.
- Sterlite Power Transmission Ltd. - Overview
- Sterlite Power Transmission Ltd. - Product / Service
- Sterlite Power Transmission Ltd. - Key offerings
- SWOT
- 16.17 Sumitomo Electric Industries Ltd.
- Sumitomo Electric Industries Ltd. - Overview
- Sumitomo Electric Industries Ltd. - Product / Service
- Sumitomo Electric Industries Ltd. - Key offerings
- SWOT
- 16.18 Taihan Cable and Solution Co. Ltd.
- Taihan Cable and Solution Co. Ltd. - Overview
- Taihan Cable and Solution Co. Ltd. - Product / Service
- Taihan Cable and Solution Co. Ltd. - Key offerings
- SWOT
17 Appendix
- 17.1 Scope of the report
- 17.2 Inclusions and exclusions checklist
- Inclusions checklist
- Exclusions checklist
- 17.3 Currency conversion rates for US$
- Currency conversion rates for US$
- 17.4 Research methodology
- Research methodology
- 17.5 Data procurement
- Information sources
- 17.6 Data validation
- Data validation
- 17.7 Validation techniques employed for market sizing
- Validation techniques employed for market sizing
- 17.8 Data synthesis
- Data synthesis
- 17.9 360 degree market analysis
- 360 degree market analysis
- 17.10 List of abbreviations
- List of abbreviations

