|
|
市場調査レポート
商品コード
1748540
大型トラック車載診断システムの世界市場、2025~2029年Global Heavy-duty Trucks On-board Diagnostics System Market 2025-2029 |
||||||

|
|||||||
カスタマイズ可能
|
|||||||


| 大型トラック車載診断システムの世界市場、2025~2029年 |
|
出版日: 2025年06月07日
発行: TechNavio
ページ情報: 英文 229 Pages
納期: 即納可能
|

全表示
- 概要
- 図表
- 目次
大型トラック車載診断システム市場は2024~2029年に9,850万米ドル、予測期間中のCAGRは3.3%で成長すると予測されます。
当レポートでは、大型トラック車載診断システム市場の全体的な分析、市場規模・予測、動向、成長促進要因、課題、約25のベンダーを網羅したベンダー分析などを掲載しています。
現在の市場シナリオ、最新動向と促進要因、市場環境全体に関する最新分析を提供しています。この市場を牽引しているのは、総所有コストを削減するフリート事業者のニーズ、利用ベースの保険(UBI)モデルの採用、最新の車両における電子コンテンツの量の増加などがあります。
| 市場範囲 | |
|---|---|
| 基準年 | 2025年 |
| 終了年 | 2029年 |
| 予測期間 | 2025~2029年 |
| 成長モメンタム | 加速 |
| 前年比 | 3.2% |
| CAGR | 3.3% |
| 増分額 | 9,850万米ドル |
本調査は、産業の主要参加者からのインプットを含め、一次情報と二次情報を客観的に組み合わせて実施しました。レポートには、主要企業の分析に加え、包括的な市場規模データ、地域別分析によるセグメント、ベンダー情勢が含まれています。レポートには過去データと予測データがあります。
本調査では、今後数年間の大型トラック車載診断システム市場の成長を促進する主要理由の1つとして、トラックプラトゥーニングの出現を挙げています。また、予知システムは商用車OEMに未開拓の収益源を提供し、物流部門におけるフリート管理ソリューションの人気の高まりは市場の大きな需要につながります。
目次
第1章 エグゼクティブサマリー
- 市場概要
第2章 Technavio分析
- 価格・ライフサイクル・顧客購入バスケット・採用率・購入基準の分析
- インプットの重要性と差別化の要因
- 混乱の要因
- 促進要因と課題の影響
第3章 市場情勢
- 市場エコシステム
- 市場の特徴
- バリューチェーン分析
第4章 市場規模
- 市場の定義
- 市場セグメント分析
- 市場規模 2024年
- 市場の展望 2024~2029年
第5章 市場規模実績
- 大型トラック車載診断システムの世界市場 2019~2023年
- 車種セグメント分析 2019~2023年
- タイプ別セグメント分析 2019~2023年
- 接続性セグメント分析 2019~2023年
- 地域別セグメント分析 2019~2023年
- 国別セグメント分析 2019~2023年
第6章 定性分析
- AIの影響:大型トラック車載診断システムの世界市場
第7章 ファイブフォース分析
- ファイブフォースの要約
- 買い手の交渉力
- 供給企業の交渉力
- 新規参入業者の脅威
- 代替品の脅威
- 競争の脅威
- 市況
第8章 市場セグメンテーション:車種別
- 市場セグメント
- 比較:車種別
- クラス8:市場規模と予測 2024~2029年
- クラス7:市場規模と予測 2024~2029年
- 市場機会:車種別
第9章 市場セグメンテーション:タイプ別
- 市場セグメント
- 比較:タイプ別
- ハンドヘルドスキャンツール:市場規模と予測 2024~2029年
- モバイルデバイスベースのツール:市場規模と予測 2024~2029年
- PCベースのスキャンツール:市場規模と予測 2024~2029年
- 市場機会:タイプ別
第10章 市場セグメンテーション:接続性別
- 市場セグメント
- 比較:接続性別
- セルラー:市場規模と予測 2024~2029年
- Bluetooth:市場規模と予測 2024~2029年
- Wi-Fi:市場規模と予測 2024~2029年
- 衛星:市場規模と予測 2024~2029年
- その他:市場規模と予測 2024~2029年
- 市場機会:接続性別
第11章 顧客情勢
- 顧客情勢概要
第12章 地域別情勢
- 地域別セグメンテーション
- 比較:地域別
- 北米:市場規模と予測 2024~2029年
- アジア太平洋:市場規模と予測 2024~2029年
- 欧州:市場規模と予測 2024~2029年
- 南米:市場規模と予測 2024~2029年
- 中東・アフリカ:市場規模と予測 2024~2029年
- 米国:市場規模と予測 2024~2029年
- カナダ:市場規模と予測 2024~2029年
- ドイツ:市場規模と予測 2024~2029年
- 中国:市場規模と予測 2024~2029年
- 日本:市場規模と予測 2024~2029年
- インド:市場規模と予測 2024~2029年
- 英国:市場規模と予測 2024~2029年
- フランス:市場規模と予測 2024~2029年
- 韓国:市場規模と予測 2024~2029年
- イタリア:市場規模と予測 2024~2029年
- 地域情勢による市場機会
第13章 促進要因・課題・機会・抑制要因
- 市場促進要因
- 市場課題
- 促進要因と課題の影響
- 市場機会・抑制要因
第14章 競合情勢
- 概要
- 競合情勢
- 混乱の状況
- 産業のリスク
第15章 競合分析
- 企業プロファイル
- 企業ランキング指数
- 企業の市場ポジショニング
- ACTIA Group
- Autel Intelligent Technology Co.
- AVL DiTEST GmbH
- Bridgestone Corp.
- CalAmp Corp.
- Continental AG
- Cummins Inc.
- iWave Systems Technologies Pvt. Ltd.
- Moj.io Inc.
- OBD Solutions LLC
- Robert Bosch GmbH
- Vector Informatik GmbH
- Vidiwave Ltd.
- ZF Friedrichshafen AG
- Zubie Inc.
第16章 付録
Exhibits:
- Exhibits1: Executive Summary - Chart on Market Overview
- Exhibits2: Executive Summary - Data Table on Market Overview
- Exhibits3: Executive Summary - Chart on Global Market Characteristics
- Exhibits4: Executive Summary - Chart on Market By Geographical Landscape
- Exhibits5: Executive Summary - Chart on Market Segmentation by Vehicle Type
- Exhibits6: Executive Summary - Chart on Market Segmentation by Type
- Exhibits7: Executive Summary - Chart on Market Segmentation by Connectivity
- Exhibits8: Executive Summary - Chart on Incremental Growth
- Exhibits9: Executive Summary - Data Table on Incremental Growth
- Exhibits10: Executive Summary - Chart on Company Market Positioning
- Exhibits11: Analysis of price sensitivity, lifecycle, customer purchase basket, adoption rates, and purchase criteria
- Exhibits12: Overview on criticality of inputs and factors of differentiation
- Exhibits13: Overview on factors of disruption
- Exhibits14: Impact of drivers and challenges in 2024 and 2029
- Exhibits15: Parent Market
- Exhibits16: Data Table on - Parent Market
- Exhibits17: Market characteristics analysis
- Exhibits18: Value chain analysis
- Exhibits19: Offerings of companies included in the market definition
- Exhibits20: Market segments
- Exhibits21: Chart on Global - Market size and forecast 2024-2029 ($ million)
- Exhibits22: Data Table on Global - Market size and forecast 2024-2029 ($ million)
- Exhibits23: Chart on Global Market: Year-over-year growth 2024-2029 (%)
- Exhibits24: Data Table on Global Market: Year-over-year growth 2024-2029 (%)
- Exhibits25: Historic Market Size - Data Table on Global Heavy-Duty Trucks On-Board Diagnostics System Market 2019 - 2023 ($ million)
- Exhibits26: Historic Market Size - Vehicle Type Segment 2019 - 2023 ($ million)
- Exhibits27: Historic Market Size - Type Segment 2019 - 2023 ($ million)
- Exhibits28: Historic Market Size - Connectivity Segment 2019 - 2023 ($ million)
- Exhibits29: Historic Market Size - Geography Segment 2019 - 2023 ($ million)
- Exhibits30: Historic Market Size - Country Segment 2019 - 2023 ($ million)
- Exhibits31: Five forces analysis - Comparison between 2024 and 2029
- Exhibits32: Bargaining power of buyers - Impact of key factors 2024 and 2029
- Exhibits33: Bargaining power of suppliers - Impact of key factors in 2024 and 2029
- Exhibits34: Threat of new entrants - Impact of key factors in 2024 and 2029
- Exhibits35: Threat of substitutes - Impact of key factors in 2024 and 2029
- Exhibits36: Threat of rivalry - Impact of key factors in 2024 and 2029
- Exhibits37: Chart on Market condition - Five forces 2024 and 2029
- Exhibits38: Chart on Vehicle Type - Market share 2024-2029 (%)
- Exhibits39: Data Table on Vehicle Type - Market share 2024-2029 (%)
- Exhibits40: Chart on Comparison by Vehicle Type
- Exhibits41: Data Table on Comparison by Vehicle Type
- Exhibits42: Chart on Class 8 - Market size and forecast 2024-2029 ($ million)
- Exhibits43: Data Table on Class 8 - Market size and forecast 2024-2029 ($ million)
- Exhibits44: Chart on Class 8 - Year-over-year growth 2024-2029 (%)
- Exhibits45: Data Table on Class 8 - Year-over-year growth 2024-2029 (%)
- Exhibits46: Chart on Class 7 - Market size and forecast 2024-2029 ($ million)
- Exhibits47: Data Table on Class 7 - Market size and forecast 2024-2029 ($ million)
- Exhibits48: Chart on Class 7 - Year-over-year growth 2024-2029 (%)
- Exhibits49: Data Table on Class 7 - Year-over-year growth 2024-2029 (%)
- Exhibits50: Market opportunity by Vehicle Type ($ million)
- Exhibits51: Data Table on Market opportunity by Vehicle Type ($ million)
- Exhibits52: Chart on Type - Market share 2024-2029 (%)
- Exhibits53: Data Table on Type - Market share 2024-2029 (%)
- Exhibits54: Chart on Comparison by Type
- Exhibits55: Data Table on Comparison by Type
- Exhibits56: Chart on Hand-held scan tools - Market size and forecast 2024-2029 ($ million)
- Exhibits57: Data Table on Hand-held scan tools - Market size and forecast 2024-2029 ($ million)
- Exhibits58: Chart on Hand-held scan tools - Year-over-year growth 2024-2029 (%)
- Exhibits59: Data Table on Hand-held scan tools - Year-over-year growth 2024-2029 (%)
- Exhibits60: Chart on Mobile device based tools - Market size and forecast 2024-2029 ($ million)
- Exhibits61: Data Table on Mobile device based tools - Market size and forecast 2024-2029 ($ million)
- Exhibits62: Chart on Mobile device based tools - Year-over-year growth 2024-2029 (%)
- Exhibits63: Data Table on Mobile device based tools - Year-over-year growth 2024-2029 (%)
- Exhibits64: Chart on PC-based scan tools - Market size and forecast 2024-2029 ($ million)
- Exhibits65: Data Table on PC-based scan tools - Market size and forecast 2024-2029 ($ million)
- Exhibits66: Chart on PC-based scan tools - Year-over-year growth 2024-2029 (%)
- Exhibits67: Data Table on PC-based scan tools - Year-over-year growth 2024-2029 (%)
- Exhibits68: Market opportunity by Type ($ million)
- Exhibits69: Data Table on Market opportunity by Type ($ million)
- Exhibits70: Chart on Connectivity - Market share 2024-2029 (%)
- Exhibits71: Data Table on Connectivity - Market share 2024-2029 (%)
- Exhibits72: Chart on Comparison by Connectivity
- Exhibits73: Data Table on Comparison by Connectivity
- Exhibits74: Chart on Cellular - Market size and forecast 2024-2029 ($ million)
- Exhibits75: Data Table on Cellular - Market size and forecast 2024-2029 ($ million)
- Exhibits76: Chart on Cellular - Year-over-year growth 2024-2029 (%)
- Exhibits77: Data Table on Cellular - Year-over-year growth 2024-2029 (%)
- Exhibits78: Chart on Bluetooth - Market size and forecast 2024-2029 ($ million)
- Exhibits79: Data Table on Bluetooth - Market size and forecast 2024-2029 ($ million)
- Exhibits80: Chart on Bluetooth - Year-over-year growth 2024-2029 (%)
- Exhibits81: Data Table on Bluetooth - Year-over-year growth 2024-2029 (%)
- Exhibits82: Chart on Wi-Fi - Market size and forecast 2024-2029 ($ million)
- Exhibits83: Data Table on Wi-Fi - Market size and forecast 2024-2029 ($ million)
- Exhibits84: Chart on Wi-Fi - Year-over-year growth 2024-2029 (%)
- Exhibits85: Data Table on Wi-Fi - Year-over-year growth 2024-2029 (%)
- Exhibits86: Chart on Satellite - Market size and forecast 2024-2029 ($ million)
- Exhibits87: Data Table on Satellite - Market size and forecast 2024-2029 ($ million)
- Exhibits88: Chart on Satellite - Year-over-year growth 2024-2029 (%)
- Exhibits89: Data Table on Satellite - Year-over-year growth 2024-2029 (%)
- Exhibits90: Chart on Others - Market size and forecast 2024-2029 ($ million)
- Exhibits91: Data Table on Others - Market size and forecast 2024-2029 ($ million)
- Exhibits92: Chart on Others - Year-over-year growth 2024-2029 (%)
- Exhibits93: Data Table on Others - Year-over-year growth 2024-2029 (%)
- Exhibits94: Market opportunity by Connectivity ($ million)
- Exhibits95: Data Table on Market opportunity by Connectivity ($ million)
- Exhibits96: Analysis of price sensitivity, lifecycle, customer purchase basket, adoption rates, and purchase criteria
- Exhibits97: Chart on Market share By Geographical Landscape 2024-2029 (%)
- Exhibits98: Data Table on Market share By Geographical Landscape 2024-2029 (%)
- Exhibits99: Chart on Geographic comparison
- Exhibits100: Data Table on Geographic comparison
- Exhibits101: Chart on North America - Market size and forecast 2024-2029 ($ million)
- Exhibits102: Data Table on North America - Market size and forecast 2024-2029 ($ million)
- Exhibits103: Chart on North America - Year-over-year growth 2024-2029 (%)
- Exhibits104: Data Table on North America - Year-over-year growth 2024-2029 (%)
- Exhibits105: Chart on APAC - Market size and forecast 2024-2029 ($ million)
- Exhibits106: Data Table on APAC - Market size and forecast 2024-2029 ($ million)
- Exhibits107: Chart on APAC - Year-over-year growth 2024-2029 (%)
- Exhibits108: Data Table on APAC - Year-over-year growth 2024-2029 (%)
- Exhibits109: Chart on Europe - Market size and forecast 2024-2029 ($ million)
- Exhibits110: Data Table on Europe - Market size and forecast 2024-2029 ($ million)
- Exhibits111: Chart on Europe - Year-over-year growth 2024-2029 (%)
- Exhibits112: Data Table on Europe - Year-over-year growth 2024-2029 (%)
- Exhibits113: Chart on South America - Market size and forecast 2024-2029 ($ million)
- Exhibits114: Data Table on South America - Market size and forecast 2024-2029 ($ million)
- Exhibits115: Chart on South America - Year-over-year growth 2024-2029 (%)
- Exhibits116: Data Table on South America - Year-over-year growth 2024-2029 (%)
- Exhibits117: Chart on Middle East and Africa - Market size and forecast 2024-2029 ($ million)
- Exhibits118: Data Table on Middle East and Africa - Market size and forecast 2024-2029 ($ million)
- Exhibits119: Chart on Middle East and Africa - Year-over-year growth 2024-2029 (%)
- Exhibits120: Data Table on Middle East and Africa - Year-over-year growth 2024-2029 (%)
- Exhibits121: Chart on US - Market size and forecast 2024-2029 ($ million)
- Exhibits122: Data Table on US - Market size and forecast 2024-2029 ($ million)
- Exhibits123: Chart on US - Year-over-year growth 2024-2029 (%)
- Exhibits124: Data Table on US - Year-over-year growth 2024-2029 (%)
- Exhibits125: Chart on Canada - Market size and forecast 2024-2029 ($ million)
- Exhibits126: Data Table on Canada - Market size and forecast 2024-2029 ($ million)
- Exhibits127: Chart on Canada - Year-over-year growth 2024-2029 (%)
- Exhibits128: Data Table on Canada - Year-over-year growth 2024-2029 (%)
- Exhibits129: Chart on Germany - Market size and forecast 2024-2029 ($ million)
- Exhibits130: Data Table on Germany - Market size and forecast 2024-2029 ($ million)
- Exhibits131: Chart on Germany - Year-over-year growth 2024-2029 (%)
- Exhibits132: Data Table on Germany - Year-over-year growth 2024-2029 (%)
- Exhibits133: Chart on China - Market size and forecast 2024-2029 ($ million)
- Exhibits134: Data Table on China - Market size and forecast 2024-2029 ($ million)
- Exhibits135: Chart on China - Year-over-year growth 2024-2029 (%)
- Exhibits136: Data Table on China - Year-over-year growth 2024-2029 (%)
- Exhibits137: Chart on Japan - Market size and forecast 2024-2029 ($ million)
- Exhibits138: Data Table on Japan - Market size and forecast 2024-2029 ($ million)
- Exhibits139: Chart on Japan - Year-over-year growth 2024-2029 (%)
- Exhibits140: Data Table on Japan - Year-over-year growth 2024-2029 (%)
- Exhibits141: Chart on India - Market size and forecast 2024-2029 ($ million)
- Exhibits142: Data Table on India - Market size and forecast 2024-2029 ($ million)
- Exhibits143: Chart on India - Year-over-year growth 2024-2029 (%)
- Exhibits144: Data Table on India - Year-over-year growth 2024-2029 (%)
- Exhibits145: Chart on UK - Market size and forecast 2024-2029 ($ million)
- Exhibits146: Data Table on UK - Market size and forecast 2024-2029 ($ million)
- Exhibits147: Chart on UK - Year-over-year growth 2024-2029 (%)
- Exhibits148: Data Table on UK - Year-over-year growth 2024-2029 (%)
- Exhibits149: Chart on France - Market size and forecast 2024-2029 ($ million)
- Exhibits150: Data Table on France - Market size and forecast 2024-2029 ($ million)
- Exhibits151: Chart on France - Year-over-year growth 2024-2029 (%)
- Exhibits152: Data Table on France - Year-over-year growth 2024-2029 (%)
- Exhibits153: Chart on South Korea - Market size and forecast 2024-2029 ($ million)
- Exhibits154: Data Table on South Korea - Market size and forecast 2024-2029 ($ million)
- Exhibits155: Chart on South Korea - Year-over-year growth 2024-2029 (%)
- Exhibits156: Data Table on South Korea - Year-over-year growth 2024-2029 (%)
- Exhibits157: Chart on Italy - Market size and forecast 2024-2029 ($ million)
- Exhibits158: Data Table on Italy - Market size and forecast 2024-2029 ($ million)
- Exhibits159: Chart on Italy - Year-over-year growth 2024-2029 (%)
- Exhibits160: Data Table on Italy - Year-over-year growth 2024-2029 (%)
- Exhibits161: Market opportunity By Geographical Landscape ($ million)
- Exhibits162: Data Tables on Market opportunity By Geographical Landscape ($ million)
- Exhibits163: Impact of drivers and challenges in 2024 and 2029
- Exhibits164: Overview on criticality of inputs and factors of differentiation
- Exhibits165: Overview on factors of disruption
- Exhibits166: Impact of key risks on business
- Exhibits167: Companies covered
- Exhibits168: Company ranking index
- Exhibits169: Matrix on companies position and classification
- Exhibits170: ACTIA Group - Overview
- Exhibits171: ACTIA Group - Business segments
- Exhibits172: ACTIA Group - Key offerings
- Exhibits173: ACTIA Group - Segment focus
- Exhibits174: SWOT
- Exhibits175: Autel Intelligent Technology Co. - Overview
- Exhibits176: Autel Intelligent Technology Co. - Product / Service
- Exhibits177: Autel Intelligent Technology Co. - Key offerings
- Exhibits178: SWOT
- Exhibits179: AVL DiTEST GmbH - Overview
- Exhibits180: AVL DiTEST GmbH - Product / Service
- Exhibits181: AVL DiTEST GmbH - Key offerings
- Exhibits182: SWOT
- Exhibits183: Bridgestone Corp. - Overview
- Exhibits184: Bridgestone Corp. - Business segments
- Exhibits185: Bridgestone Corp. - Key news
- Exhibits186: Bridgestone Corp. - Key offerings
- Exhibits187: Bridgestone Corp. - Segment focus
- Exhibits188: SWOT
- Exhibits189: CalAmp Corp. - Overview
- Exhibits190: CalAmp Corp. - Business segments
- Exhibits191: CalAmp Corp. - Key offerings
- Exhibits192: CalAmp Corp. - Segment focus
- Exhibits193: SWOT
- Exhibits194: Continental AG - Overview
- Exhibits195: Continental AG - Business segments
- Exhibits196: Continental AG - Key news
- Exhibits197: Continental AG - Key offerings
- Exhibits198: Continental AG - Segment focus
- Exhibits199: SWOT
- Exhibits200: Cummins Inc. - Overview
- Exhibits201: Cummins Inc. - Business segments
- Exhibits202: Cummins Inc. - Key news
- Exhibits203: Cummins Inc. - Key offerings
- Exhibits204: Cummins Inc. - Segment focus
- Exhibits205: SWOT
- Exhibits206: iWave Systems Technologies Pvt. Ltd. - Overview
- Exhibits207: iWave Systems Technologies Pvt. Ltd. - Product / Service
- Exhibits208: iWave Systems Technologies Pvt. Ltd. - Key offerings
- Exhibits209: SWOT
- Exhibits210: Moj.io Inc. - Overview
- Exhibits211: Moj.io Inc. - Product / Service
- Exhibits212: Moj.io Inc. - Key offerings
- Exhibits213: SWOT
- Exhibits214: OBD Solutions LLC - Overview
- Exhibits215: OBD Solutions LLC - Product / Service
- Exhibits216: OBD Solutions LLC - Key offerings
- Exhibits217: SWOT
- Exhibits218: Robert Bosch GmbH - Overview
- Exhibits219: Robert Bosch GmbH - Product / Service
- Exhibits220: Robert Bosch GmbH - Key news
- Exhibits221: Robert Bosch GmbH - Key offerings
- Exhibits222: SWOT
- Exhibits223: Vector Informatik GmbH - Overview
- Exhibits224: Vector Informatik GmbH - Product / Service
- Exhibits225: Vector Informatik GmbH - Key offerings
- Exhibits226: SWOT
- Exhibits227: Vidiwave Ltd. - Overview
- Exhibits228: Vidiwave Ltd. - Product / Service
- Exhibits229: Vidiwave Ltd. - Key offerings
- Exhibits230: SWOT
- Exhibits231: ZF Friedrichshafen AG - Overview
- Exhibits232: ZF Friedrichshafen AG - Business segments
- Exhibits233: ZF Friedrichshafen AG - Key news
- Exhibits234: ZF Friedrichshafen AG - Key offerings
- Exhibits235: ZF Friedrichshafen AG - Segment focus
- Exhibits236: SWOT
- Exhibits237: Zubie Inc. - Overview
- Exhibits238: Zubie Inc. - Product / Service
- Exhibits239: Zubie Inc. - Key offerings
- Exhibits240: SWOT
- Exhibits241: Inclusions checklist
- Exhibits242: Exclusions checklist
- Exhibits243: Currency conversion rates for US$
- Exhibits244: Research methodology
- Exhibits245: Information sources
- Exhibits246: Data validation
- Exhibits247: Validation techniques employed for market sizing
- Exhibits248: Data synthesis
- Exhibits249: 360 degree market analysis
- Exhibits250: List of abbreviations
The heavy-duty trucks on-board diagnostics system market is forecasted to grow by USD 98.5 mn during 2024-2029, accelerating at a CAGR of 3.3% during the forecast period. The report on the heavy-duty trucks on-board diagnostics system market provides a holistic analysis, market size and forecast, trends, growth drivers, and challenges, as well as vendor analysis covering around 25 vendors.
The report offers an up-to-date analysis regarding the current market scenario, the latest trends and drivers, and the overall market environment. The market is driven by need for fleet operators to reduce total cost of ownership, adoption of usage-based insurance (UBI) models, and increasing volume of electronic content in modern vehicles.
| Market Scope | |
|---|---|
| Base Year | 2025 |
| End Year | 2029 |
| Series Year | 2025-2029 |
| Growth Momentum | Accelerate |
| YOY 2025 | 3.2% |
| CAGR | 3.3% |
| Incremental Value | $98.5 mn |
The study was conducted using an objective combination of primary and secondary information including inputs from key participants in the industry. The report contains a comprehensive market size data, segment with regional analysis and vendor landscape in addition to an analysis of the key companies. Reports have historic and forecast data.
Technavio's heavy-duty trucks on-board diagnostics system market is segmented as below:
By Vehicle Type
- Class 8
- Class 7
By Type
- Hand-held scan tools
- Mobile device based tools
- PC-based scan tools
By Connectivity
- Cellular
- Bluetooth
- Wi-Fi
- Satellite
- Others
By Geographical Landscape
- North America
- APAC
- Europe
- South America
- Middle East and Africa
This study identifies the emergence of truck platooning as one of the prime reasons driving the heavy-duty trucks on-board diagnostics system market growth during the next few years. Also, prognostic systems offer untapped revenue sources to commercial vehicle oems and growing popularity of fleet management solutions in logistics sector will lead to sizable demand in the market.
The report on the heavy-duty trucks on-board diagnostics system market covers the following areas:
- Heavy-Duty Trucks On-Board Diagnostics System Market sizing
- Heavy-Duty Trucks On-Board Diagnostics System Market forecast
- Heavy-Duty Trucks On-Board Diagnostics System Market industry analysis
The robust vendor analysis is designed to help clients improve their market position, and in line with this, this report provides a detailed analysis of several leading heavy-duty trucks on-board diagnostics system market vendors that include ACTIA Group, Autel Intelligent Technology Co., AVL DiTEST GmbH, Bridgestone Corp., CalAmp Corp., Continental AG, Cummins Inc., Danlaw Inc., Fleet Complete, Garrett Motion Inc., Geotab Inc., iWave Systems Technologies Pvt. Ltd., Moj.io Inc., OBD Solutions LLC, Robert Bosch GmbH, Snap On Inc., Vector Informatik GmbH, Vidiwave Ltd., ZF Friedrichshafen AG, and Zubie Inc.. Also, the heavy-duty trucks on-board diagnostics system market analysis report includes information on upcoming trends and challenges that will influence market growth. This is to help companies strategize and leverage all forthcoming growth opportunities.
The publisher presents a detailed picture of the market by the way of study, synthesis, and summation of data from multiple sources by an analysis of key parameters such as profit, pricing, competition, and promotions. It presents various market facets by identifying the key industry influencers. The data presented is comprehensive, reliable, and a result of extensive primary and secondary research. The market research reports provide a complete competitive landscape and an in-depth vendor selection methodology and analysis using qualitative and quantitative research to forecast accurate market growth.
Table of Contents
1 Executive Summary
- 1.1 Market overview
- Executive Summary - Chart on Market Overview
- Executive Summary - Data Table on Market Overview
- Executive Summary - Chart on Global Market Characteristics
- Executive Summary - Chart on Market By Geographical Landscape
- Executive Summary - Chart on Market Segmentation by Vehicle Type
- Executive Summary - Chart on Market Segmentation by Type
- Executive Summary - Chart on Market Segmentation by Connectivity
- Executive Summary - Chart on Incremental Growth
- Executive Summary - Data Table on Incremental Growth
- Executive Summary - Chart on Company Market Positioning
2 Technavio Analysis
- 2.1 Analysis of price sensitivity, lifecycle, customer purchase basket, adoption rates, and purchase criteria
- Analysis of price sensitivity, lifecycle, customer purchase basket, adoption rates, and purchase criteria
- 2.2 Criticality of inputs and Factors of differentiation
- Overview on criticality of inputs and factors of differentiation
- 2.3 Factors of disruption
- Overview on factors of disruption
- 2.4 Impact of drivers and challenges
- Impact of drivers and challenges in 2024 and 2029
3 Market Landscape
- 3.1 Market ecosystem
- Parent Market
- Data Table on - Parent Market
- 3.2 Market characteristics
- Market characteristics analysis
- 3.3 Value chain analysis
- Value chain analysis
4 Market Sizing
- 4.1 Market definition
- Offerings of companies included in the market definition
- 4.2 Market segment analysis
- Market segments
- 4.3 Market size 2024
- 4.4 Market outlook: Forecast for 2024-2029
- Chart on Global - Market size and forecast 2024-2029 ($ million)
- Data Table on Global - Market size and forecast 2024-2029 ($ million)
- Chart on Global Market: Year-over-year growth 2024-2029 (%)
- Data Table on Global Market: Year-over-year growth 2024-2029 (%)
5 Historic Market Size
- 5.1 Global Heavy-Duty Trucks On-Board Diagnostics System Market 2019 - 2023
- Historic Market Size - Data Table on Global Heavy-Duty Trucks On-Board Diagnostics System Market 2019 - 2023 ($ million)
- 5.2 Vehicle Type segment analysis 2019 - 2023
- Historic Market Size - Vehicle Type Segment 2019 - 2023 ($ million)
- 5.3 Type segment analysis 2019 - 2023
- Historic Market Size - Type Segment 2019 - 2023 ($ million)
- 5.4 Connectivity segment analysis 2019 - 2023
- Historic Market Size - Connectivity Segment 2019 - 2023 ($ million)
- 5.5 Geography segment analysis 2019 - 2023
- Historic Market Size - Geography Segment 2019 - 2023 ($ million)
- 5.6 Country segment analysis 2019 - 2023
- Historic Market Size - Country Segment 2019 - 2023 ($ million)
6 Qualitative Analysis
- 6.1 The impact of AI in the global heavy-duty trucks on-board diagnostics system market
7 Five Forces Analysis
- 7.1 Five forces summary
- Five forces analysis - Comparison between 2024 and 2029
- 7.2 Bargaining power of buyers
- Bargaining power of buyers - Impact of key factors 2024 and 2029
- 7.3 Bargaining power of suppliers
- Bargaining power of suppliers - Impact of key factors in 2024 and 2029
- 7.4 Threat of new entrants
- Threat of new entrants - Impact of key factors in 2024 and 2029
- 7.5 Threat of substitutes
- Threat of substitutes - Impact of key factors in 2024 and 2029
- 7.6 Threat of rivalry
- Threat of rivalry - Impact of key factors in 2024 and 2029
- 7.7 Market condition
- Chart on Market condition - Five forces 2024 and 2029
8 Market Segmentation by Vehicle Type
- 8.1 Market segments
- Chart on Vehicle Type - Market share 2024-2029 (%)
- Data Table on Vehicle Type - Market share 2024-2029 (%)
- 8.2 Comparison by Vehicle Type
- Chart on Comparison by Vehicle Type
- Data Table on Comparison by Vehicle Type
- 8.3 Class 8 - Market size and forecast 2024-2029
- Chart on Class 8 - Market size and forecast 2024-2029 ($ million)
- Data Table on Class 8 - Market size and forecast 2024-2029 ($ million)
- Chart on Class 8 - Year-over-year growth 2024-2029 (%)
- Data Table on Class 8 - Year-over-year growth 2024-2029 (%)
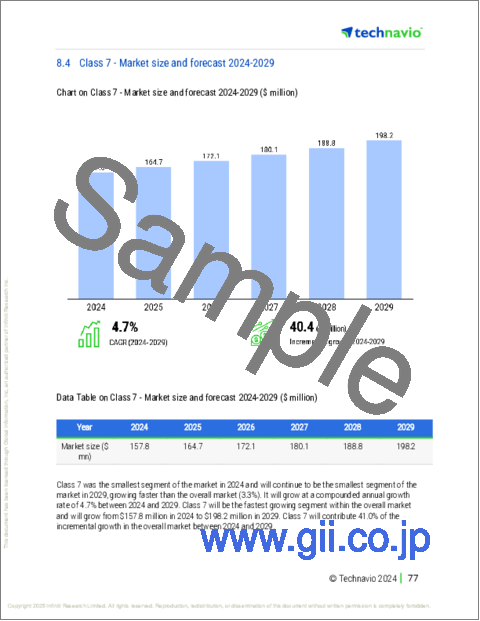
- 8.4 Class 7 - Market size and forecast 2024-2029
- Chart on Class 7 - Market size and forecast 2024-2029 ($ million)
- Data Table on Class 7 - Market size and forecast 2024-2029 ($ million)
- Chart on Class 7 - Year-over-year growth 2024-2029 (%)
- Data Table on Class 7 - Year-over-year growth 2024-2029 (%)
- 8.5 Market opportunity by Vehicle Type
- Market opportunity by Vehicle Type ($ million)
- Data Table on Market opportunity by Vehicle Type ($ million)
9 Market Segmentation by Type
- 9.1 Market segments
- Chart on Type - Market share 2024-2029 (%)
- Data Table on Type - Market share 2024-2029 (%)
- 9.2 Comparison by Type
- Chart on Comparison by Type
- Data Table on Comparison by Type
- 9.3 Hand-held scan tools - Market size and forecast 2024-2029
- Chart on Hand-held scan tools - Market size and forecast 2024-2029 ($ million)
- Data Table on Hand-held scan tools - Market size and forecast 2024-2029 ($ million)
- Chart on Hand-held scan tools - Year-over-year growth 2024-2029 (%)
- Data Table on Hand-held scan tools - Year-over-year growth 2024-2029 (%)
- 9.4 Mobile device based tools - Market size and forecast 2024-2029
- Chart on Mobile device based tools - Market size and forecast 2024-2029 ($ million)
- Data Table on Mobile device based tools - Market size and forecast 2024-2029 ($ million)
- Chart on Mobile device based tools - Year-over-year growth 2024-2029 (%)
- Data Table on Mobile device based tools - Year-over-year growth 2024-2029 (%)
- 9.5 PC-based scan tools - Market size and forecast 2024-2029
- Chart on PC-based scan tools - Market size and forecast 2024-2029 ($ million)
- Data Table on PC-based scan tools - Market size and forecast 2024-2029 ($ million)
- Chart on PC-based scan tools - Year-over-year growth 2024-2029 (%)
- Data Table on PC-based scan tools - Year-over-year growth 2024-2029 (%)
- 9.6 Market opportunity by Type
- Market opportunity by Type ($ million)
- Data Table on Market opportunity by Type ($ million)
10 Market Segmentation by Connectivity
- 10.1 Market segments
- Chart on Connectivity - Market share 2024-2029 (%)
- Data Table on Connectivity - Market share 2024-2029 (%)
- 10.2 Comparison by Connectivity
- Chart on Comparison by Connectivity
- Data Table on Comparison by Connectivity
- 10.3 Cellular - Market size and forecast 2024-2029
- Chart on Cellular - Market size and forecast 2024-2029 ($ million)
- Data Table on Cellular - Market size and forecast 2024-2029 ($ million)
- Chart on Cellular - Year-over-year growth 2024-2029 (%)
- Data Table on Cellular - Year-over-year growth 2024-2029 (%)
- 10.4 Bluetooth - Market size and forecast 2024-2029
- Chart on Bluetooth - Market size and forecast 2024-2029 ($ million)
- Data Table on Bluetooth - Market size and forecast 2024-2029 ($ million)
- Chart on Bluetooth - Year-over-year growth 2024-2029 (%)
- Data Table on Bluetooth - Year-over-year growth 2024-2029 (%)
- 10.5 Wi-Fi - Market size and forecast 2024-2029
- Chart on Wi-Fi - Market size and forecast 2024-2029 ($ million)
- Data Table on Wi-Fi - Market size and forecast 2024-2029 ($ million)
- Chart on Wi-Fi - Year-over-year growth 2024-2029 (%)
- Data Table on Wi-Fi - Year-over-year growth 2024-2029 (%)
- 10.6 Satellite - Market size and forecast 2024-2029
- Chart on Satellite - Market size and forecast 2024-2029 ($ million)
- Data Table on Satellite - Market size and forecast 2024-2029 ($ million)
- Chart on Satellite - Year-over-year growth 2024-2029 (%)
- Data Table on Satellite - Year-over-year growth 2024-2029 (%)
- 10.7 Others - Market size and forecast 2024-2029
- Chart on Others - Market size and forecast 2024-2029 ($ million)
- Data Table on Others - Market size and forecast 2024-2029 ($ million)
- Chart on Others - Year-over-year growth 2024-2029 (%)
- Data Table on Others - Year-over-year growth 2024-2029 (%)
- 10.8 Market opportunity by Connectivity
- Market opportunity by Connectivity ($ million)
- Data Table on Market opportunity by Connectivity ($ million)
11 Customer Landscape
- 11.1 Customer landscape overview
- Analysis of price sensitivity, lifecycle, customer purchase basket, adoption rates, and purchase criteria
12 Geographic Landscape
- 12.1 Geographic segmentation
- Chart on Market share By Geographical Landscape 2024-2029 (%)
- Data Table on Market share By Geographical Landscape 2024-2029 (%)
- 12.2 Geographic comparison
- Chart on Geographic comparison
- Data Table on Geographic comparison
- 12.3 North America - Market size and forecast 2024-2029
- Chart on North America - Market size and forecast 2024-2029 ($ million)
- Data Table on North America - Market size and forecast 2024-2029 ($ million)
- Chart on North America - Year-over-year growth 2024-2029 (%)
- Data Table on North America - Year-over-year growth 2024-2029 (%)
- 12.4 APAC - Market size and forecast 2024-2029
- Chart on APAC - Market size and forecast 2024-2029 ($ million)
- Data Table on APAC - Market size and forecast 2024-2029 ($ million)
- Chart on APAC - Year-over-year growth 2024-2029 (%)
- Data Table on APAC - Year-over-year growth 2024-2029 (%)
- 12.5 Europe - Market size and forecast 2024-2029
- Chart on Europe - Market size and forecast 2024-2029 ($ million)
- Data Table on Europe - Market size and forecast 2024-2029 ($ million)
- Chart on Europe - Year-over-year growth 2024-2029 (%)
- Data Table on Europe - Year-over-year growth 2024-2029 (%)
- 12.6 South America - Market size and forecast 2024-2029
- Chart on South America - Market size and forecast 2024-2029 ($ million)
- Data Table on South America - Market size and forecast 2024-2029 ($ million)
- Chart on South America - Year-over-year growth 2024-2029 (%)
- Data Table on South America - Year-over-year growth 2024-2029 (%)
- 12.7 Middle East and Africa - Market size and forecast 2024-2029
- Chart on Middle East and Africa - Market size and forecast 2024-2029 ($ million)
- Data Table on Middle East and Africa - Market size and forecast 2024-2029 ($ million)
- Chart on Middle East and Africa - Year-over-year growth 2024-2029 (%)
- Data Table on Middle East and Africa - Year-over-year growth 2024-2029 (%)
- 12.8 US - Market size and forecast 2024-2029
- Chart on US - Market size and forecast 2024-2029 ($ million)
- Data Table on US - Market size and forecast 2024-2029 ($ million)
- Chart on US - Year-over-year growth 2024-2029 (%)
- Data Table on US - Year-over-year growth 2024-2029 (%)
- 12.9 Canada - Market size and forecast 2024-2029
- Chart on Canada - Market size and forecast 2024-2029 ($ million)
- Data Table on Canada - Market size and forecast 2024-2029 ($ million)
- Chart on Canada - Year-over-year growth 2024-2029 (%)
- Data Table on Canada - Year-over-year growth 2024-2029 (%)
- 12.10 Germany - Market size and forecast 2024-2029
- Chart on Germany - Market size and forecast 2024-2029 ($ million)
- Data Table on Germany - Market size and forecast 2024-2029 ($ million)
- Chart on Germany - Year-over-year growth 2024-2029 (%)
- Data Table on Germany - Year-over-year growth 2024-2029 (%)
- 12.11 China - Market size and forecast 2024-2029
- Chart on China - Market size and forecast 2024-2029 ($ million)
- Data Table on China - Market size and forecast 2024-2029 ($ million)
- Chart on China - Year-over-year growth 2024-2029 (%)
- Data Table on China - Year-over-year growth 2024-2029 (%)
- 12.12 Japan - Market size and forecast 2024-2029
- Chart on Japan - Market size and forecast 2024-2029 ($ million)
- Data Table on Japan - Market size and forecast 2024-2029 ($ million)
- Chart on Japan - Year-over-year growth 2024-2029 (%)
- Data Table on Japan - Year-over-year growth 2024-2029 (%)
- 12.13 India - Market size and forecast 2024-2029
- Chart on India - Market size and forecast 2024-2029 ($ million)
- Data Table on India - Market size and forecast 2024-2029 ($ million)
- Chart on India - Year-over-year growth 2024-2029 (%)
- Data Table on India - Year-over-year growth 2024-2029 (%)
- 12.14 UK - Market size and forecast 2024-2029
- Chart on UK - Market size and forecast 2024-2029 ($ million)
- Data Table on UK - Market size and forecast 2024-2029 ($ million)
- Chart on UK - Year-over-year growth 2024-2029 (%)
- Data Table on UK - Year-over-year growth 2024-2029 (%)
- 12.15 France - Market size and forecast 2024-2029
- Chart on France - Market size and forecast 2024-2029 ($ million)
- Data Table on France - Market size and forecast 2024-2029 ($ million)
- Chart on France - Year-over-year growth 2024-2029 (%)
- Data Table on France - Year-over-year growth 2024-2029 (%)
- 12.16 South Korea - Market size and forecast 2024-2029
- Chart on South Korea - Market size and forecast 2024-2029 ($ million)
- Data Table on South Korea - Market size and forecast 2024-2029 ($ million)
- Chart on South Korea - Year-over-year growth 2024-2029 (%)
- Data Table on South Korea - Year-over-year growth 2024-2029 (%)
- 12.17 Italy - Market size and forecast 2024-2029
- Chart on Italy - Market size and forecast 2024-2029 ($ million)
- Data Table on Italy - Market size and forecast 2024-2029 ($ million)
- Chart on Italy - Year-over-year growth 2024-2029 (%)
- Data Table on Italy - Year-over-year growth 2024-2029 (%)
- 12.18 Market opportunity By Geographical Landscape
- Market opportunity By Geographical Landscape ($ million)
- Data Tables on Market opportunity By Geographical Landscape ($ million)
13 Drivers, Challenges, and Opportunity/Restraints
- 13.1 Market drivers
- 13.2 Market challenges
- 13.3 Impact of drivers and challenges
- Impact of drivers and challenges in 2024 and 2029
- 13.4 Market opportunities/restraints
14 Competitive Landscape
- 14.1 Overview
- 14.2 Competitive Landscape
- Overview on criticality of inputs and factors of differentiation
- 14.3 Landscape disruption
- Overview on factors of disruption
- 14.4 Industry risks
- Impact of key risks on business
15 Competitive Analysis
- 15.1 Companies profiled
- Companies covered
- 15.2 Company ranking index
- Company ranking index
- 15.3 Market positioning of companies
- Matrix on companies position and classification
- 15.4 ACTIA Group
- ACTIA Group - Overview
- ACTIA Group - Business segments
- ACTIA Group - Key offerings
- ACTIA Group - Segment focus
- SWOT
- 15.5 Autel Intelligent Technology Co.
- Autel Intelligent Technology Co. - Overview
- Autel Intelligent Technology Co. - Product / Service
- Autel Intelligent Technology Co. - Key offerings
- SWOT
- 15.6 AVL DiTEST GmbH
- AVL DiTEST GmbH - Overview
- AVL DiTEST GmbH - Product / Service
- AVL DiTEST GmbH - Key offerings
- SWOT
- 15.7 Bridgestone Corp.
- Bridgestone Corp. - Overview
- Bridgestone Corp. - Business segments
- Bridgestone Corp. - Key news
- Bridgestone Corp. - Key offerings
- Bridgestone Corp. - Segment focus
- SWOT
- 15.8 CalAmp Corp.
- CalAmp Corp. - Overview
- CalAmp Corp. - Business segments
- CalAmp Corp. - Key offerings
- CalAmp Corp. - Segment focus
- SWOT
- 15.9 Continental AG
- Continental AG - Overview
- Continental AG - Business segments
- Continental AG - Key news
- Continental AG - Key offerings
- Continental AG - Segment focus
- SWOT
- 15.10 Cummins Inc.
- Cummins Inc. - Overview
- Cummins Inc. - Business segments
- Cummins Inc. - Key news
- Cummins Inc. - Key offerings
- Cummins Inc. - Segment focus
- SWOT
- 15.11 iWave Systems Technologies Pvt. Ltd.
- iWave Systems Technologies Pvt. Ltd. - Overview
- iWave Systems Technologies Pvt. Ltd. - Product / Service
- iWave Systems Technologies Pvt. Ltd. - Key offerings
- SWOT
- 15.12 Moj.io Inc.
- Moj.io Inc. - Overview
- Moj.io Inc. - Product / Service
- Moj.io Inc. - Key offerings
- SWOT
- 15.13 OBD Solutions LLC
- OBD Solutions LLC - Overview
- OBD Solutions LLC - Product / Service
- OBD Solutions LLC - Key offerings
- SWOT
- 15.14 Robert Bosch GmbH
- Robert Bosch GmbH - Overview
- Robert Bosch GmbH - Product / Service
- Robert Bosch GmbH - Key news
- Robert Bosch GmbH - Key offerings
- SWOT
- 15.15 Vector Informatik GmbH
- Vector Informatik GmbH - Overview
- Vector Informatik GmbH - Product / Service
- Vector Informatik GmbH - Key offerings
- SWOT
- 15.16 Vidiwave Ltd.
- Vidiwave Ltd. - Overview
- Vidiwave Ltd. - Product / Service
- Vidiwave Ltd. - Key offerings
- SWOT
- 15.17 ZF Friedrichshafen AG
- ZF Friedrichshafen AG - Overview
- ZF Friedrichshafen AG - Business segments
- ZF Friedrichshafen AG - Key news
- ZF Friedrichshafen AG - Key offerings
- ZF Friedrichshafen AG - Segment focus
- SWOT
- 15.18 Zubie Inc.
- Zubie Inc. - Overview
- Zubie Inc. - Product / Service
- Zubie Inc. - Key offerings
- SWOT
16 Appendix
- 16.1 Scope of the report
- 16.2 Inclusions and exclusions checklist
- Inclusions checklist
- Exclusions checklist
- 16.3 Currency conversion rates for US$
- Currency conversion rates for US$
- 16.4 Research methodology
- Research methodology
- 16.5 Data procurement
- Information sources
- 16.6 Data validation
- Data validation
- 16.7 Validation techniques employed for market sizing
- Validation techniques employed for market sizing
- 16.8 Data synthesis
- Data synthesis
- 16.9 360 degree market analysis
- 360 degree market analysis
- 16.10 List of abbreviations
- List of abbreviations

