|
|
市場調査レポート
商品コード
1410697
蕁麻疹治療薬の世界市場 2024-2028Global Urticaria Drugs Market 2024-2028 |
||||||
|
|
|||||||
カスタマイズ可能
|
|||||||


| 蕁麻疹治療薬の世界市場 2024-2028 |
|
出版日: 2024年01月09日
発行: TechNavio
ページ情報: 英文 167 Pages
納期: 即納可能
|

- 全表示
- 概要
- 図表
- 目次
概要
蕁麻疹治療薬市場は2023-2028年に16億6,000万米ドル、予測期間中のCAGRは11.64%で成長すると予測されます。
当レポートでは、蕁麻疹治療薬市場の全体的な分析、市場規模・予測、動向、成長促進要因、課題、約25のベンダーを網羅したベンダー分析などを掲載しています。
現在の市場シナリオ、最新動向と促進要因、市場環境全体に関する最新分析を提供しています。市場は、蕁麻疹の有病率の増加、蕁麻疹患者の管理に関するガイドライン、蕁麻疹に対する新薬の承認の増加によって牽引されています。
| 市場範囲 | |
|---|---|
| 基準年 | 2024 |
| 終了年 | 2028 |
| 予測期間 | 2024-2028 |
| 成長モメンタム | 加速 |
| 前年比2024年 | 10.38% |
| CAGR | 11.64% |
| 増分額 | 16億6,000万米ドル |
本調査では、今後数年間の蕁麻疹治療薬市場の成長を促進する主な要因の1つとして、蕁麻疹を治療する生物製剤の出現を挙げています。また、蕁麻疹に対する技術的・臨床的研究の進歩や研究資金の増加は、市場の大きな需要につながっています。
目次
第1章 エグゼクティブサマリー
- 市場概要
第2章 市場情勢
- 市場エコシステム
第3章 市場規模
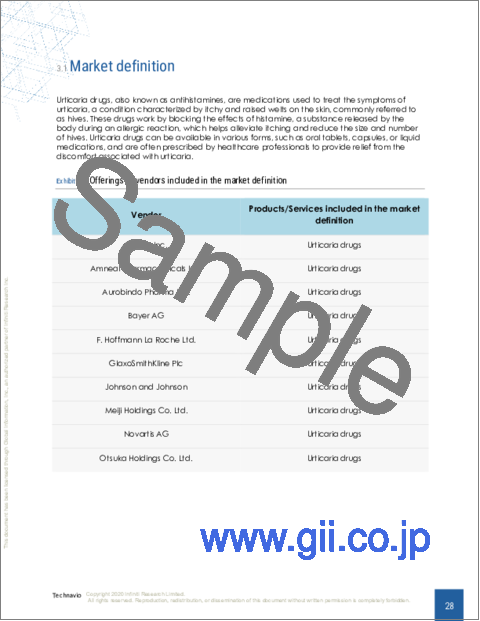
- 市場の定義
- 市場セグメント分析
- 市場規模 2023
- 市場の見通し 2023-2028
第4章 市場規模実績
- 蕁麻疹治療薬の世界市場 2018-2022
- 用途別セグメント分析 2018-2022
- タイプセグメント分析 2018-2022
- 地域別セグメント分析 2018-2022
- 国別セグメント分析 2018-2022
第5章 ファイブフォース分析
- ファイブフォースの要約
- 買い手の交渉力
- 供給企業の交渉力
- 新規参入業者の脅威
- 代替品の脅威
- 競争の脅威
- 市況
第6章 市場セグメンテーション:用途別
- 市場セグメント
- 比較:用途別
- 急性蕁麻疹:市場規模と予測 2023-2028
- 慢性蕁麻疹:市場規模と予測 2023-2028
- 市場機会:用途別
第7章 市場セグメンテーション:タイプ別
- 市場セグメント
- 比較:タイプ別
- 抗ヒスタミン薬:市場規模と予測 2023-2028
- 抗炎症剤:市場規模と予測 2023-2028
- スルホン:市場規模と予測 2023-2028
- 生物製剤:市場規模と予測 2023-2028
- 市場機会:タイプ別
第8章 顧客情勢
- 顧客情勢の概要
第9章 地域別情勢
- 地域別セグメンテーション
- 地域別比較
- 北米:市場規模と予測 2023-2028
- 欧州:市場規模と予測 2023-2028
- アジア:市場規模と予測 2023-2028
- 世界のその他の地域:市場規模と予測 2023-2028
- 米国:市場規模と予測 2023-2028
- ドイツ:市場規模と予測 2023-2028
- 英国:市場規模と予測 2023-2028
- 中国:市場規模と予測 2023-2028
- カナダ:市場規模と予測 2023-2028
- 市場機会:地域情勢別
第10章 促進要因、課題、および動向
- 市場促進要因
- 市場の課題
- 促進要因と課題の影響
- 市場動向
第11章 ベンダー情勢
- 概要
- ベンダー情勢
- 混乱の状況
- 業界のリスク
第12章 ベンダー分析
- 対象ベンダー
- ベンダーの市場ポジショニング
- Allakos Inc.
- Amneal Pharmaceuticals Inc.
- Aurobindo Pharma Ltd.
- Bayer AG
- F. Hoffmann La Roche Ltd.
- GlaxoSmithKline Plc
- Johnson and Johnson
- Meiji Holdings Co. Ltd.
- Novartis AG
- Otsuka Holdings Co. Ltd.
- Pfizer Inc.
- Sanofi SA
- TerSera Therapeutics LLC
- Teva Pharmaceutical Industries Ltd.
- Viatris Inc.
第13章 付録
Exhibits:
- Exhibits1: Executive Summary - Chart on Market Overview
- Exhibits2: Executive Summary - Data Table on Market Overview
- Exhibits3: Executive Summary - Chart on Global Market Characteristics
- Exhibits4: Executive Summary - Chart on Market By Geographical Landscape
- Exhibits5: Executive Summary - Chart on Market Segmentation by Application
- Exhibits6: Executive Summary - Chart on Market Segmentation by Type
- Exhibits7: Executive Summary - Chart on Incremental Growth
- Exhibits8: Executive Summary - Data Table on Incremental Growth
- Exhibits9: Executive Summary - Chart on Vendor Market Positioning
- Exhibits10: Parent market
- Exhibits11: Market Characteristics
- Exhibits12: Offerings of vendors included in the market definition
- Exhibits13: Market segments
- Exhibits14: Chart on Global - Market size and forecast 2023-2028 ($ billion)
- Exhibits15: Data Table on Global - Market size and forecast 2023-2028 ($ billion)
- Exhibits16: Chart on Global Market: Year-over-year growth 2023-2028 (%)
- Exhibits17: Data Table on Global Market: Year-over-year growth 2023-2028 (%)
- Exhibits18: Historic Market Size - Data Table on global urticaria drugs market 2018 - 2022 ($ billion)
- Exhibits19: Historic Market Size - Application Segment 2018 - 2022 ($ billion)
- Exhibits20: Historic Market Size - Type Segment 2018 - 2022 ($ billion)
- Exhibits21: Historic Market Size - Geography Segment 2018 - 2022 ($ billion)
- Exhibits22: Historic Market Size - Country Segment 2018 - 2022 ($ billion)
- Exhibits23: Five forces analysis - Comparison between 2023 and 2028
- Exhibits24: Chart on Bargaining power of buyers - Impact of key factors 2023 and 2028
- Exhibits25: Bargaining power of suppliers - Impact of key factors in 2023 and 2028
- Exhibits26: Threat of new entrants - Impact of key factors in 2023 and 2028
- Exhibits27: Threat of substitutes - Impact of key factors in 2023 and 2028
- Exhibits28: Threat of rivalry - Impact of key factors in 2023 and 2028
- Exhibits29: Chart on Market condition - Five forces 2023 and 2028
- Exhibits30: Chart on Application - Market share 2023-2028 (%)
- Exhibits31: Data Table on Application - Market share 2023-2028 (%)
- Exhibits32: Chart on Comparison by Application
- Exhibits33: Data Table on Comparison by Application
- Exhibits34: Chart on Acute urticaria - Market size and forecast 2023-2028 ($ billion)
- Exhibits35: Data Table on Acute urticaria - Market size and forecast 2023-2028 ($ billion)
- Exhibits36: Chart on Acute urticaria - Year-over-year growth 2023-2028 (%)
- Exhibits37: Data Table on Acute urticaria - Year-over-year growth 2023-2028 (%)
- Exhibits38: Chart on Chronic urticaria - Market size and forecast 2023-2028 ($ billion)
- Exhibits39: Data Table on Chronic urticaria - Market size and forecast 2023-2028 ($ billion)
- Exhibits40: Chart on Chronic urticaria - Year-over-year growth 2023-2028 (%)
- Exhibits41: Data Table on Chronic urticaria - Year-over-year growth 2023-2028 (%)
- Exhibits42: Market opportunity by Application ($ billion)
- Exhibits43: Data Table on Market opportunity by Application ($ billion)
- Exhibits44: Chart on Type - Market share 2023-2028 (%)
- Exhibits45: Data Table on Type - Market share 2023-2028 (%)
- Exhibits46: Chart on Comparison by Type
- Exhibits47: Data Table on Comparison by Type
- Exhibits48: Chart on Antihistamines - Market size and forecast 2023-2028 ($ billion)
- Exhibits49: Data Table on Antihistamines - Market size and forecast 2023-2028 ($ billion)
- Exhibits50: Chart on Antihistamines - Year-over-year growth 2023-2028 (%)
- Exhibits51: Data Table on Antihistamines - Year-over-year growth 2023-2028 (%)
- Exhibits52: Chart on Anti-inflammatory agents - Market size and forecast 2023-2028 ($ billion)
- Exhibits53: Data Table on Anti-inflammatory agents - Market size and forecast 2023-2028 ($ billion)
- Exhibits54: Chart on Anti-inflammatory agents - Year-over-year growth 2023-2028 (%)
- Exhibits55: Data Table on Anti-inflammatory agents - Year-over-year growth 2023-2028 (%)
- Exhibits56: Chart on Sulfones - Market size and forecast 2023-2028 ($ billion)
- Exhibits57: Data Table on Sulfones - Market size and forecast 2023-2028 ($ billion)
- Exhibits58: Chart on Sulfones - Year-over-year growth 2023-2028 (%)
- Exhibits59: Data Table on Sulfones - Year-over-year growth 2023-2028 (%)
- Exhibits60: Chart on Biologics - Market size and forecast 2023-2028 ($ billion)
- Exhibits61: Data Table on Biologics - Market size and forecast 2023-2028 ($ billion)
- Exhibits62: Chart on Biologics - Year-over-year growth 2023-2028 (%)
- Exhibits63: Data Table on Biologics - Year-over-year growth 2023-2028 (%)
- Exhibits64: Market opportunity by Type ($ billion)
- Exhibits65: Data Table on Market opportunity by Type ($ billion)
- Exhibits66: Analysis of price sensitivity, lifecycle, customer purchase basket, adoption rates, and purchase criteria
- Exhibits67: Chart on Market share By Geographical Landscape 2023-2028 (%)
- Exhibits68: Data Table on Market share By Geographical Landscape 2023-2028 (%)
- Exhibits69: Chart on Geographic comparison
- Exhibits70: Data Table on Geographic comparison
- Exhibits71: Chart on North America - Market size and forecast 2023-2028 ($ billion)
- Exhibits72: Data Table on North America - Market size and forecast 2023-2028 ($ billion)
- Exhibits73: Chart on North America - Year-over-year growth 2023-2028 (%)
- Exhibits74: Data Table on North America - Year-over-year growth 2023-2028 (%)
- Exhibits75: Chart on Europe - Market size and forecast 2023-2028 ($ billion)
- Exhibits76: Data Table on Europe - Market size and forecast 2023-2028 ($ billion)
- Exhibits77: Chart on Europe - Year-over-year growth 2023-2028 (%)
- Exhibits78: Data Table on Europe - Year-over-year growth 2023-2028 (%)
- Exhibits79: Chart on Asia - Market size and forecast 2023-2028 ($ billion)
- Exhibits80: Data Table on Asia - Market size and forecast 2023-2028 ($ billion)
- Exhibits81: Chart on Asia - Year-over-year growth 2023-2028 (%)
- Exhibits82: Data Table on Asia - Year-over-year growth 2023-2028 (%)
- Exhibits83: Chart on Rest of World (ROW) - Market size and forecast 2023-2028 ($ billion)
- Exhibits84: Data Table on Rest of World (ROW) - Market size and forecast 2023-2028 ($ billion)
- Exhibits85: Chart on Rest of World (ROW) - Year-over-year growth 2023-2028 (%)
- Exhibits86: Data Table on Rest of World (ROW) - Year-over-year growth 2023-2028 (%)
- Exhibits87: Chart on US - Market size and forecast 2023-2028 ($ billion)
- Exhibits88: Data Table on US - Market size and forecast 2023-2028 ($ billion)
- Exhibits89: Chart on US - Year-over-year growth 2023-2028 (%)
- Exhibits90: Data Table on US - Year-over-year growth 2023-2028 (%)
- Exhibits91: Chart on Germany - Market size and forecast 2023-2028 ($ billion)
- Exhibits92: Data Table on Germany - Market size and forecast 2023-2028 ($ billion)
- Exhibits93: Chart on Germany - Year-over-year growth 2023-2028 (%)
- Exhibits94: Data Table on Germany - Year-over-year growth 2023-2028 (%)
- Exhibits95: Chart on UK - Market size and forecast 2023-2028 ($ billion)
- Exhibits96: Data Table on UK - Market size and forecast 2023-2028 ($ billion)
- Exhibits97: Chart on UK - Year-over-year growth 2023-2028 (%)
- Exhibits98: Data Table on UK - Year-over-year growth 2023-2028 (%)
- Exhibits99: Chart on China - Market size and forecast 2023-2028 ($ billion)
- Exhibits100: Data Table on China - Market size and forecast 2023-2028 ($ billion)
- Exhibits101: Chart on China - Year-over-year growth 2023-2028 (%)
- Exhibits102: Data Table on China - Year-over-year growth 2023-2028 (%)
- Exhibits103: Chart on Canada - Market size and forecast 2023-2028 ($ billion)
- Exhibits104: Data Table on Canada - Market size and forecast 2023-2028 ($ billion)
- Exhibits105: Chart on Canada - Year-over-year growth 2023-2028 (%)
- Exhibits106: Data Table on Canada - Year-over-year growth 2023-2028 (%)
- Exhibits107: Market opportunity By Geographical Landscape ($ billion)
- Exhibits108: Data Tables on Market opportunity By Geographical Landscape ($ billion)
- Exhibits109: Impact of drivers and challenges in 2023 and 2028
- Exhibits110: Overview on Criticality of inputs and Factors of differentiation
- Exhibits111: Overview on factors of disruption
- Exhibits112: Impact of key risks on business
- Exhibits113: Vendors covered
- Exhibits114: Matrix on vendor position and classification
- Exhibits115: Allakos Inc. - Overview
- Exhibits116: Allakos Inc. - Product / Service
- Exhibits117: Allakos Inc. - Key offerings
- Exhibits118: Amneal Pharmaceuticals Inc. - Overview
- Exhibits119: Amneal Pharmaceuticals Inc. - Business segments
- Exhibits120: Amneal Pharmaceuticals Inc. - Key news
- Exhibits121: Amneal Pharmaceuticals Inc. - Key offerings
- Exhibits122: Amneal Pharmaceuticals Inc. - Segment focus
- Exhibits123: Aurobindo Pharma Ltd. - Overview
- Exhibits124: Aurobindo Pharma Ltd. - Product / Service
- Exhibits125: Aurobindo Pharma Ltd. - Key offerings
- Exhibits126: Bayer AG - Overview
- Exhibits127: Bayer AG - Business segments
- Exhibits128: Bayer AG - Key news
- Exhibits129: Bayer AG - Key offerings
- Exhibits130: Bayer AG - Segment focus
- Exhibits131: F. Hoffmann La Roche Ltd. - Overview
- Exhibits132: F. Hoffmann La Roche Ltd. - Business segments
- Exhibits133: F. Hoffmann La Roche Ltd. - Key news
- Exhibits134: F. Hoffmann La Roche Ltd. - Key offerings
- Exhibits135: F. Hoffmann La Roche Ltd. - Segment focus
- Exhibits136: GlaxoSmithKline Plc - Overview
- Exhibits137: GlaxoSmithKline Plc - Business segments
- Exhibits138: GlaxoSmithKline Plc - Key news
- Exhibits139: GlaxoSmithKline Plc - Key offerings
- Exhibits140: GlaxoSmithKline Plc - Segment focus
- Exhibits141: Johnson and Johnson - Overview
- Exhibits142: Johnson and Johnson - Business segments
- Exhibits143: Johnson and Johnson - Key news
- Exhibits144: Johnson and Johnson - Key offerings
- Exhibits145: Johnson and Johnson - Segment focus
- Exhibits146: Meiji Holdings Co. Ltd. - Overview
- Exhibits147: Meiji Holdings Co. Ltd. - Business segments
- Exhibits148: Meiji Holdings Co. Ltd. - Key news
- Exhibits149: Meiji Holdings Co. Ltd. - Key offerings
- Exhibits150: Meiji Holdings Co. Ltd. - Segment focus
- Exhibits151: Novartis AG - Overview
- Exhibits152: Novartis AG - Business segments
- Exhibits153: Novartis AG - Key offerings
- Exhibits154: Novartis AG - Segment focus
- Exhibits155: Otsuka Holdings Co. Ltd. - Overview
- Exhibits156: Otsuka Holdings Co. Ltd. - Business segments
- Exhibits157: Otsuka Holdings Co. Ltd. - Key offerings
- Exhibits158: Otsuka Holdings Co. Ltd. - Segment focus
- Exhibits159: Pfizer Inc. - Overview
- Exhibits160: Pfizer Inc. - Product / Service
- Exhibits161: Pfizer Inc. - Key news
- Exhibits162: Pfizer Inc. - Key offerings
- Exhibits163: Sanofi SA - Overview
- Exhibits164: Sanofi SA - Business segments
- Exhibits165: Sanofi SA - Key news
- Exhibits166: Sanofi SA - Key offerings
- Exhibits167: Sanofi SA - Segment focus
- Exhibits168: TerSera Therapeutics LLC - Overview
- Exhibits169: TerSera Therapeutics LLC - Product / Service
- Exhibits170: TerSera Therapeutics LLC - Key offerings
- Exhibits171: Teva Pharmaceutical Industries Ltd. - Overview
- Exhibits172: Teva Pharmaceutical Industries Ltd. - Business segments
- Exhibits173: Teva Pharmaceutical Industries Ltd. - Key news
- Exhibits174: Teva Pharmaceutical Industries Ltd. - Key offerings
- Exhibits175: Teva Pharmaceutical Industries Ltd. - Segment focus
- Exhibits176: Viatris Inc. - Overview
- Exhibits177: Viatris Inc. - Business segments
- Exhibits178: Viatris Inc. - Key news
- Exhibits179: Viatris Inc. - Key offerings
- Exhibits180: Viatris Inc. - Segment focus
- Exhibits181: Inclusions checklist
- Exhibits182: Exclusions checklist
- Exhibits183: Currency conversion rates for US$
- Exhibits184: Research methodology
- Exhibits185: Validation techniques employed for market sizing
- Exhibits186: Information sources
- Exhibits187: List of abbreviations
Abstract
The urticaria drugs market is forecasted to grow by USD 1.66 bn during 2023-2028, accelerating at a CAGR of 11.64% during the forecast period. The report on the urticaria drugs market provides a holistic analysis, market size and forecast, trends, growth drivers, and challenges, as well as vendor analysis covering around 25 vendors.
The report offers an up-to-date analysis regarding the current market scenario, the latest trends and drivers, and the overall market environment. The market is driven by increasing prevalence of urticaria, guidelines for management of urticaria patients, and increasing approval of new drugs for urticaria.
| Market Scope | |
|---|---|
| Base Year | 2024 |
| End Year | 2028 |
| Series Year | 2024-2028 |
| Growth Momentum | Accelerate |
| YOY 2024 | 10.38% |
| CAGR | 11.64% |
| Incremental Value | $1.66bn |
Technavio's urticaria drugs market is segmented as below:
By Application
- Acute urticaria
- Chronic urticaria
By Type
- Antihistamines
- Anti-inflammatory agents
- Sulfones
- Biologics
By Geographical Landscape
- North America
- Europe
- Asia
- Rest of World (ROW)
This study identifies the emergence of biologics to treat urticaria as one of the prime reasons driving the urticaria drugs market growth during the next few years. Also, technological and clinical research advancements and increasing research funding for urticaria will lead to sizable demand in the market.
The report on the urticaria drugs market covers the following areas:
- Urticaria drugs market sizing
- Urticaria drugs market forecast
- Urticaria drugs market industry analysis
The robust vendor analysis is designed to help clients improve their market position, and in line with this, this report provides a detailed analysis of several leading urticaria drugs market vendors that include Allakos Inc., Amneal Pharmaceuticals Inc., Aurobindo Pharma Ltd., Bayer AG, F. Hoffmann La Roche Ltd., GlaxoSmithKline Plc, Johnson and Johnson, Meiji Holdings Co. Ltd., Novartis AG, Otsuka Holdings Co. Ltd., Pfizer Inc., Sanofi SA, TerSera Therapeutics LLC, Teva Pharmaceutical Industries Ltd., and Viatris Inc.. Also, the urticaria drugs market analysis report includes information on upcoming trends and challenges that will influence market growth. This is to help companies strategize and leverage all forthcoming growth opportunities.
The study was conducted using an objective combination of primary and secondary information including inputs from key participants in the industry. The report contains a comprehensive market and vendor landscape in addition to an analysis of the key vendors.
The publisher presents a detailed picture of the market by the way of study, synthesis, and summation of data from multiple sources by an analysis of key parameters such as profit, pricing, competition, and promotions. It presents various market facets by identifying the key industry influencers. The data presented is comprehensive, reliable, and a result of extensive research - both primary and secondary. The market research reports provide a complete competitive landscape and an in-depth vendor selection methodology and analysis using qualitative and quantitative research to forecast the accurate market growth.
Table of Contents
1 Executive Summary
- 1.1 Market overview
- Exhibit 01: Executive Summary - Chart on Market Overview
- Exhibit 02: Executive Summary - Data Table on Market Overview
- Exhibit 03: Executive Summary - Chart on Global Market Characteristics
- Exhibit 04: Executive Summary - Chart on Market By Geographical Landscape
- Exhibit 05: Executive Summary - Chart on Market Segmentation by Application
- Exhibit 06: Executive Summary - Chart on Market Segmentation by Type
- Exhibit 07: Executive Summary - Chart on Incremental Growth
- Exhibit 08: Executive Summary - Data Table on Incremental Growth
- Exhibit 09: Executive Summary - Chart on Vendor Market Positioning
2 Market Landscape
- 2.1 Market ecosystem
- Exhibit 10: Parent market
- Exhibit 11: Market Characteristics
3 Market Sizing
- 3.1 Market definition
- Exhibit 12: Offerings of vendors included in the market definition
- 3.2 Market segment analysis
- Exhibit 13: Market segments
- 3.3 Market size 2023
- 3.4 Market outlook: Forecast for 2023-2028
- Exhibit 14: Chart on Global - Market size and forecast 2023-2028 ($ billion)
- Exhibit 15: Data Table on Global - Market size and forecast 2023-2028 ($ billion)
- Exhibit 16: Chart on Global Market: Year-over-year growth 2023-2028 (%)
- Exhibit 17: Data Table on Global Market: Year-over-year growth 2023-2028 (%)
4 Historic Market Size
- 4.1 Global urticaria drugs market 2018 - 2022
- Exhibit 18: Historic Market Size - Data Table on global urticaria drugs market 2018 - 2022 ($ billion)
- 4.2 Application Segment Analysis 2018 - 2022
- Exhibit 19: Historic Market Size - Application Segment 2018 - 2022 ($ billion)
- 4.3 Type Segment Analysis 2018 - 2022
- Exhibit 20: Historic Market Size - Type Segment 2018 - 2022 ($ billion)
- 4.4 Geography Segment Analysis 2018 - 2022
- Exhibit 21: Historic Market Size - Geography Segment 2018 - 2022 ($ billion)
- 4.5 Country Segment Analysis 2018 - 2022
- Exhibit 22: Historic Market Size - Country Segment 2018 - 2022 ($ billion)
5 Five Forces Analysis
- 5.1 Five forces summary
- Exhibit 23: Five forces analysis - Comparison between 2023 and 2028
- 5.2 Bargaining power of buyers
- Exhibit 24: Chart on Bargaining power of buyers - Impact of key factors 2023 and 2028
- 5.3 Bargaining power of suppliers
- Exhibit 25: Bargaining power of suppliers - Impact of key factors in 2023 and 2028
- 5.4 Threat of new entrants
- Exhibit 26: Threat of new entrants - Impact of key factors in 2023 and 2028
- 5.5 Threat of substitutes
- Exhibit 27: Threat of substitutes - Impact of key factors in 2023 and 2028
- 5.6 Threat of rivalry
- Exhibit 28: Threat of rivalry - Impact of key factors in 2023 and 2028
- 5.7 Market condition
- Exhibit 29: Chart on Market condition - Five forces 2023 and 2028
6 Market Segmentation by Application
- 6.1 Market segments
- Exhibit 30: Chart on Application - Market share 2023-2028 (%)
- Exhibit 31: Data Table on Application - Market share 2023-2028 (%)
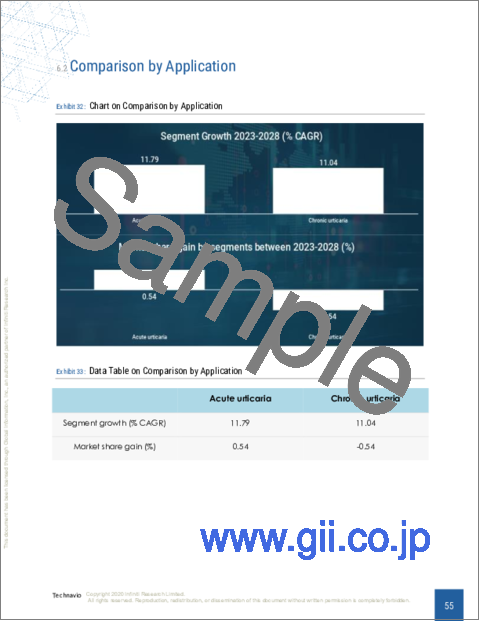
- 6.2 Comparison by Application
- Exhibit 32: Chart on Comparison by Application
- Exhibit 33: Data Table on Comparison by Application
- 6.3 Acute urticaria - Market size and forecast 2023-2028
- Exhibit 34: Chart on Acute urticaria - Market size and forecast 2023-2028 ($ billion)
- Exhibit 35: Data Table on Acute urticaria - Market size and forecast 2023-2028 ($ billion)
- Exhibit 36: Chart on Acute urticaria - Year-over-year growth 2023-2028 (%)
- Exhibit 37: Data Table on Acute urticaria - Year-over-year growth 2023-2028 (%)
- 6.4 Chronic urticaria - Market size and forecast 2023-2028
- Exhibit 38: Chart on Chronic urticaria - Market size and forecast 2023-2028 ($ billion)
- Exhibit 39: Data Table on Chronic urticaria - Market size and forecast 2023-2028 ($ billion)
- Exhibit 40: Chart on Chronic urticaria - Year-over-year growth 2023-2028 (%)
- Exhibit 41: Data Table on Chronic urticaria - Year-over-year growth 2023-2028 (%)
- 6.5 Market opportunity by Application
- Exhibit 42: Market opportunity by Application ($ billion)
- Exhibit 43: Data Table on Market opportunity by Application ($ billion)
7 Market Segmentation by Type
- 7.1 Market segments
- Exhibit 44: Chart on Type - Market share 2023-2028 (%)
- Exhibit 45: Data Table on Type - Market share 2023-2028 (%)
- 7.2 Comparison by Type
- Exhibit 46: Chart on Comparison by Type
- Exhibit 47: Data Table on Comparison by Type
- 7.3 Antihistamines - Market size and forecast 2023-2028
- Exhibit 48: Chart on Antihistamines - Market size and forecast 2023-2028 ($ billion)
- Exhibit 49: Data Table on Antihistamines - Market size and forecast 2023-2028 ($ billion)
- Exhibit 50: Chart on Antihistamines - Year-over-year growth 2023-2028 (%)
- Exhibit 51: Data Table on Antihistamines - Year-over-year growth 2023-2028 (%)
- 7.4 Anti-inflammatory agents - Market size and forecast 2023-2028
- Exhibit 52: Chart on Anti-inflammatory agents - Market size and forecast 2023-2028 ($ billion)
- Exhibit 53: Data Table on Anti-inflammatory agents - Market size and forecast 2023-2028 ($ billion)
- Exhibit 54: Chart on Anti-inflammatory agents - Year-over-year growth 2023-2028 (%)
- Exhibit 55: Data Table on Anti-inflammatory agents - Year-over-year growth 2023-2028 (%)
- 7.5 Sulfones - Market size and forecast 2023-2028
- Exhibit 56: Chart on Sulfones - Market size and forecast 2023-2028 ($ billion)
- Exhibit 57: Data Table on Sulfones - Market size and forecast 2023-2028 ($ billion)
- Exhibit 58: Chart on Sulfones - Year-over-year growth 2023-2028 (%)
- Exhibit 59: Data Table on Sulfones - Year-over-year growth 2023-2028 (%)
- 7.6 Biologics - Market size and forecast 2023-2028
- Exhibit 60: Chart on Biologics - Market size and forecast 2023-2028 ($ billion)
- Exhibit 61: Data Table on Biologics - Market size and forecast 2023-2028 ($ billion)
- Exhibit 62: Chart on Biologics - Year-over-year growth 2023-2028 (%)
- Exhibit 63: Data Table on Biologics - Year-over-year growth 2023-2028 (%)
- 7.7 Market opportunity by Type
- Exhibit 64: Market opportunity by Type ($ billion)
- Exhibit 65: Data Table on Market opportunity by Type ($ billion)
8 Customer Landscape
- 8.1 Customer landscape overview
- Exhibit 66: Analysis of price sensitivity, lifecycle, customer purchase basket, adoption rates, and purchase criteria
9 Geographic Landscape
- 9.1 Geographic segmentation
- Exhibit 67: Chart on Market share By Geographical Landscape 2023-2028 (%)
- Exhibit 68: Data Table on Market share By Geographical Landscape 2023-2028 (%)
- 9.2 Geographic comparison
- Exhibit 69: Chart on Geographic comparison
- Exhibit 70: Data Table on Geographic comparison
- 9.3 North America - Market size and forecast 2023-2028
- Exhibit 71: Chart on North America - Market size and forecast 2023-2028 ($ billion)
- Exhibit 72: Data Table on North America - Market size and forecast 2023-2028 ($ billion)
- Exhibit 73: Chart on North America - Year-over-year growth 2023-2028 (%)
- Exhibit 74: Data Table on North America - Year-over-year growth 2023-2028 (%)
- 9.4 Europe - Market size and forecast 2023-2028
- Exhibit 75: Chart on Europe - Market size and forecast 2023-2028 ($ billion)
- Exhibit 76: Data Table on Europe - Market size and forecast 2023-2028 ($ billion)
- Exhibit 77: Chart on Europe - Year-over-year growth 2023-2028 (%)
- Exhibit 78: Data Table on Europe - Year-over-year growth 2023-2028 (%)
- 9.5 Asia - Market size and forecast 2023-2028
- Exhibit 79: Chart on Asia - Market size and forecast 2023-2028 ($ billion)
- Exhibit 80: Data Table on Asia - Market size and forecast 2023-2028 ($ billion)
- Exhibit 81: Chart on Asia - Year-over-year growth 2023-2028 (%)
- Exhibit 82: Data Table on Asia - Year-over-year growth 2023-2028 (%)
- 9.6 Rest of World (ROW) - Market size and forecast 2023-2028
- Exhibit 83: Chart on Rest of World (ROW) - Market size and forecast 2023-2028 ($ billion)
- Exhibit 84: Data Table on Rest of World (ROW) - Market size and forecast 2023-2028 ($ billion)
- Exhibit 85: Chart on Rest of World (ROW) - Year-over-year growth 2023-2028 (%)
- Exhibit 86: Data Table on Rest of World (ROW) - Year-over-year growth 2023-2028 (%)
- 9.7 US - Market size and forecast 2023-2028
- Exhibit 87: Chart on US - Market size and forecast 2023-2028 ($ billion)
- Exhibit 88: Data Table on US - Market size and forecast 2023-2028 ($ billion)
- Exhibit 89: Chart on US - Year-over-year growth 2023-2028 (%)
- Exhibit 90: Data Table on US - Year-over-year growth 2023-2028 (%)
- 9.8 Germany - Market size and forecast 2023-2028
- Exhibit 91: Chart on Germany - Market size and forecast 2023-2028 ($ billion)
- Exhibit 92: Data Table on Germany - Market size and forecast 2023-2028 ($ billion)
- Exhibit 93: Chart on Germany - Year-over-year growth 2023-2028 (%)
- Exhibit 94: Data Table on Germany - Year-over-year growth 2023-2028 (%)
- 9.9 UK - Market size and forecast 2023-2028
- Exhibit 95: Chart on UK - Market size and forecast 2023-2028 ($ billion)
- Exhibit 96: Data Table on UK - Market size and forecast 2023-2028 ($ billion)
- Exhibit 97: Chart on UK - Year-over-year growth 2023-2028 (%)
- Exhibit 98: Data Table on UK - Year-over-year growth 2023-2028 (%)
- 9.10 China - Market size and forecast 2023-2028
- Exhibit 99: Chart on China - Market size and forecast 2023-2028 ($ billion)
- Exhibit 100: Data Table on China - Market size and forecast 2023-2028 ($ billion)
- Exhibit 101: Chart on China - Year-over-year growth 2023-2028 (%)
- Exhibit 102: Data Table on China - Year-over-year growth 2023-2028 (%)
- 9.11 Canada - Market size and forecast 2023-2028
- Exhibit 103: Chart on Canada - Market size and forecast 2023-2028 ($ billion)
- Exhibit 104: Data Table on Canada - Market size and forecast 2023-2028 ($ billion)
- Exhibit 105: Chart on Canada - Year-over-year growth 2023-2028 (%)
- Exhibit 106: Data Table on Canada - Year-over-year growth 2023-2028 (%)
- 9.12 Market opportunity By Geographical Landscape
- Exhibit 107: Market opportunity By Geographical Landscape ($ billion)
- Exhibit 108: Data Tables on Market opportunity By Geographical Landscape ($ billion)
10 Drivers, Challenges, and Trends
- 10.1 Market drivers
- 10.2 Market challenges
- 10.3 Impact of drivers and challenges
- Exhibit 109: Impact of drivers and challenges in 2023 and 2028
- 10.4 Market trends
11 Vendor Landscape
- 11.1 Overview
- 11.2 Vendor landscape
- Exhibit 110: Overview on Criticality of inputs and Factors of differentiation
- 11.3 Landscape disruption
- Exhibit 111: Overview on factors of disruption
- 11.4 Industry risks
- Exhibit 112: Impact of key risks on business
12 Vendor Analysis
- 12.1 Vendors covered
- Exhibit 113: Vendors covered
- 12.2 Market positioning of vendors
- Exhibit 114: Matrix on vendor position and classification
- 12.3 Allakos Inc.
- Exhibit 115: Allakos Inc. - Overview
- Exhibit 116: Allakos Inc. - Product / Service
- Exhibit 117: Allakos Inc. - Key offerings
- 12.4 Amneal Pharmaceuticals Inc.
- Exhibit 118: Amneal Pharmaceuticals Inc. - Overview
- Exhibit 119: Amneal Pharmaceuticals Inc. - Business segments
- Exhibit 120: Amneal Pharmaceuticals Inc. - Key news
- Exhibit 121: Amneal Pharmaceuticals Inc. - Key offerings
- Exhibit 122: Amneal Pharmaceuticals Inc. - Segment focus
- 12.5 Aurobindo Pharma Ltd.
- Exhibit 123: Aurobindo Pharma Ltd. - Overview
- Exhibit 124: Aurobindo Pharma Ltd. - Product / Service
- Exhibit 125: Aurobindo Pharma Ltd. - Key offerings
- 12.6 Bayer AG
- Exhibit 126: Bayer AG - Overview
- Exhibit 127: Bayer AG - Business segments
- Exhibit 128: Bayer AG - Key news
- Exhibit 129: Bayer AG - Key offerings
- Exhibit 130: Bayer AG - Segment focus
- 12.7 F. Hoffmann La Roche Ltd.
- Exhibit 131: F. Hoffmann La Roche Ltd. - Overview
- Exhibit 132: F. Hoffmann La Roche Ltd. - Business segments
- Exhibit 133: F. Hoffmann La Roche Ltd. - Key news
- Exhibit 134: F. Hoffmann La Roche Ltd. - Key offerings
- Exhibit 135: F. Hoffmann La Roche Ltd. - Segment focus
- 12.8 GlaxoSmithKline Plc
- Exhibit 136: GlaxoSmithKline Plc - Overview
- Exhibit 137: GlaxoSmithKline Plc - Business segments
- Exhibit 138: GlaxoSmithKline Plc - Key news
- Exhibit 139: GlaxoSmithKline Plc - Key offerings
- Exhibit 140: GlaxoSmithKline Plc - Segment focus
- 12.9 Johnson and Johnson
- Exhibit 141: Johnson and Johnson - Overview
- Exhibit 142: Johnson and Johnson - Business segments
- Exhibit 143: Johnson and Johnson - Key news
- Exhibit 144: Johnson and Johnson - Key offerings
- Exhibit 145: Johnson and Johnson - Segment focus
- 12.10 Meiji Holdings Co. Ltd.
- Exhibit 146: Meiji Holdings Co. Ltd. - Overview
- Exhibit 147: Meiji Holdings Co. Ltd. - Business segments
- Exhibit 148: Meiji Holdings Co. Ltd. - Key news
- Exhibit 149: Meiji Holdings Co. Ltd. - Key offerings
- Exhibit 150: Meiji Holdings Co. Ltd. - Segment focus
- 12.11 Novartis AG
- Exhibit 151: Novartis AG - Overview
- Exhibit 152: Novartis AG - Business segments
- Exhibit 153: Novartis AG - Key offerings
- Exhibit 154: Novartis AG - Segment focus
- 12.12 Otsuka Holdings Co. Ltd.
- Exhibit 155: Otsuka Holdings Co. Ltd. - Overview
- Exhibit 156: Otsuka Holdings Co. Ltd. - Business segments
- Exhibit 157: Otsuka Holdings Co. Ltd. - Key offerings
- Exhibit 158: Otsuka Holdings Co. Ltd. - Segment focus
- 12.13 Pfizer Inc.
- Exhibit 159: Pfizer Inc. - Overview
- Exhibit 160: Pfizer Inc. - Product / Service
- Exhibit 161: Pfizer Inc. - Key news
- Exhibit 162: Pfizer Inc. - Key offerings
- 12.14 Sanofi SA
- Exhibit 163: Sanofi SA - Overview
- Exhibit 164: Sanofi SA - Business segments
- Exhibit 165: Sanofi SA - Key news
- Exhibit 166: Sanofi SA - Key offerings
- Exhibit 167: Sanofi SA - Segment focus
- 12.15 TerSera Therapeutics LLC
- Exhibit 168: TerSera Therapeutics LLC - Overview
- Exhibit 169: TerSera Therapeutics LLC - Product / Service
- Exhibit 170: TerSera Therapeutics LLC - Key offerings
- 12.16 Teva Pharmaceutical Industries Ltd.
- Exhibit 171: Teva Pharmaceutical Industries Ltd. - Overview
- Exhibit 172: Teva Pharmaceutical Industries Ltd. - Business segments
- Exhibit 173: Teva Pharmaceutical Industries Ltd. - Key news
- Exhibit 174: Teva Pharmaceutical Industries Ltd. - Key offerings
- Exhibit 175: Teva Pharmaceutical Industries Ltd. - Segment focus
- 12.17 Viatris Inc.
- Exhibit 176: Viatris Inc. - Overview
- Exhibit 177: Viatris Inc. - Business segments
- Exhibit 178: Viatris Inc. - Key news
- Exhibit 179: Viatris Inc. - Key offerings
- Exhibit 180: Viatris Inc. - Segment focus
13 Appendix
- 13.1 Scope of the report
- 13.2 Inclusions and exclusions checklist
- Exhibit 181: Inclusions checklist
- Exhibit 182: Exclusions checklist
- 13.3 Currency conversion rates for US$
- Exhibit 183: Currency conversion rates for US$
- 13.4 Research methodology
- Exhibit 184: Research methodology
- Exhibit 185: Validation techniques employed for market sizing
- Exhibit 186: Information sources
- 13.5 List of abbreviations
- Exhibit 187: List of abbreviations
