|
|
市場調査レポート
商品コード
1681284
ホットドリンクの世界市場、2025-2029年Global Hot drink Market 2025-2029 |
||||||

|
|||||||
カスタマイズ可能
|
|||||||

| ホットドリンクの世界市場、2025-2029年 |
|
出版日: 2025年02月27日
発行: TechNavio
ページ情報: 英文 192 Pages
納期: 即納可能
|

全表示
- 概要
- 目次
ホットドリンク市場は、2024年から2029年にかけてCAGR 6.8%で1,005億米ドルの成長が予測されています。
当レポートでは、ホットドリンク市場の全体的な分析、市場規模・予測、動向、成長促進要因、課題、約25のベンダーを網羅したベンダー分析などを掲載しています。
現在の市場シナリオ、最新動向と促進要因、市場環境全体に関する最新分析を提供しています。市場を牽引しているのは、プレミアムや職人技を駆使したホットドリンク品種への需要の高まり、機能性成分を含むホットドリンクへの需要の高まり、便利なシングルサーブホットドリンクオプションや持ち運び可能な包装形態への需要の高まりです。
| 市場範囲 | |
|---|---|
| 基準年 | 2025 |
| 終了年 | 2029 |
| 予測期間 | 2025-2029 |
| 成長モメンタム | 加速 |
| 前年比2025年 | 5.9% |
| CAGR | 6.8% |
| 増分額 | 1,005億米ドル |
本調査は、業界の主要参加者からのインプットを含め、一次情報と二次情報を客観的に組み合わせて実施しました。本レポートには、主要企業の分析に加え、包括的な市場規模データ、地域別分析によるセグメント、ベンダー情勢が含まれています。レポートには過去データと予測データがあります。
本調査では、醸造技術の進歩が今後数年間のホットドリンク市場の成長を促進する主要因の1つであると特定しています。また、ホットドリンクにおけるフュージョンフレーバー、ユニークな組み合わせ、多感覚体験へのシフトの高まりや、持続可能な素材で包装されたホットドリンクに対する消費者の嗜好の高まりは、市場の大きな需要につながります。
目次
第1章 エグゼクティブサマリー
- 市場概要
第2章 Technavio分析
- 価格・ライフサイクル・顧客購入バスケット・採用率・購入基準の分析
- インプットの重要性と差別化の要因
- 混乱の要因
- 促進要因と課題の影響
第3章 市場情勢
- 市場エコシステム
- 市場の特徴
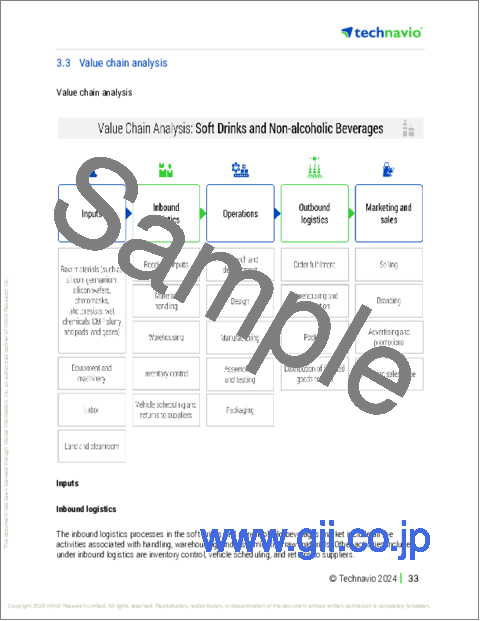
- バリューチェーン分析
第4章 市場規模
- 市場の定義
- 市場セグメント分析
- 市場規模 2024
- 市場の見通し 2024-2029
第5章 市場規模実績
- ホットドリンクの世界市場 2019-2023
- 流通チャネルセグメント分析 2019-2023
- タイプセグメント分析 2019-2023
- 地域別セグメント分析 2019-2023
- 国別セグメント分析 2019-2023
第6章 定性分析
- AIの影響:ホットドリンクの世界市場
第7章 ファイブフォース分析
- ファイブフォースの要約
- 買い手の交渉力
- 供給企業の交渉力
- 新規参入業者の脅威
- 代替品の脅威
- 競争の脅威
- 市況
第8章 市場セグメンテーション:流通チャネル別
- 市場セグメント
- 比較:流通チャネル別
- オフライン:市場規模と予測 2024-2029
- オンライン:市場規模と予測 2024-2029
- 市場機会:流通チャネル別
第9章 市場セグメンテーション:タイプ別
- 市場セグメント
- 比較:タイプ別
- コーヒー:市場規模と予測 2024-2029
- お茶:市場規模と予測 2024-2029
- ココア:市場規模と予測 2024-2029
- 市場機会:タイプ別
第10章 顧客情勢
- 顧客情勢の概要
第11章 地域別情勢
- 地域別セグメンテーション
- 地域別比較
- アジア太平洋:市場規模と予測 2024-2029
- 北米:市場規模と予測 2024-2029
- 欧州:市場規模と予測 2024-2029
- 南米:市場規模と予測 2024-2029
- 中東・アフリカ:市場規模と予測 2024-2029
- 米国:市場規模と予測 2024-2029
- 中国:市場規模と予測 2024-2029
- カナダ:市場規模と予測 2024-2029
- 日本:市場規模と予測 2024-2029
- インド:市場規模と予測 2024-2029
- ドイツ:市場規模と予測 2024-2029
- 英国:市場規模と予測 2024-2029
- フランス:市場規模と予測 2024-2029
- イタリア:市場規模と予測 2024-2029
- ブラジル:市場規模と予測 2024-2029
- 市場機会:地域情勢別
第12章 促進要因・課題・機会・抑制要因
- 市場促進要因
- 市場の課題
- 促進要因と課題の影響
- 市場の機会・抑制要因
第13章 競合情勢
- 概要
- 競合情勢
- 混乱の状況
- 業界のリスク
第14章 競合分析
- 企業プロファイル
- 企業ランキング指数
- 企業の市場ポジショニング
- Ajinomoto Co. Inc.
- Bigelow Tea
- Coffee Day Enterprises Ltd.
- Colcafe Industria Colombiana de Cafe
- Costa Ltd.
- jacobs DOUWE EGBERTS B.V.
- Keurig Green Mountain Inc.
- Luckin Coffee Inc.
- LUIGI LAVAZZA SpA
- Mother Parkers Tea and Coffee Inc.
- Starbucks Corp.
- Strauss Group Ltd.
- The J.M Smucker Co.
- The Republic of Tea Inc.
- Unilever PLC
第15章 付録
The hot drink market is forecasted to grow by USD 100.5 billion during 2024-2029 accelerating at a CAGR of 6.8% during the forecast period. The report on the hot drink market provides a holistic analysis, market size and forecast, trends, growth drivers, and challenges, as well as vendor analysis covering around 25 vendors.
The report offers an up-to-date analysis regarding the current market scenario, the latest trends and drivers, and the overall market environment. The market is driven by rising demand for premium and artisanal hot drink varieties, growing demand for hot drinks with functional ingredients, and increasing demand for convenient, single-serve hot drink options and portable packaging formats.
| Market Scope | |
|---|---|
| Base Year | 2025 |
| End Year | 2029 |
| Series Year | 2025-2029 |
| Growth Momentum | Accelerate |
| YOY 2025 | 5.9% |
| CAGR | 6.8% |
| Incremental Value | $100.5 bn |
The study was conducted using an objective combination of primary and secondary information including inputs from key participants in the industry. The report contains a comprehensive market size data, segment with regional analysis and vendor landscape in addition to an analysis of the key companies. Reports have historic and forecast data.
Technavio's hot drink market is segmented as below:
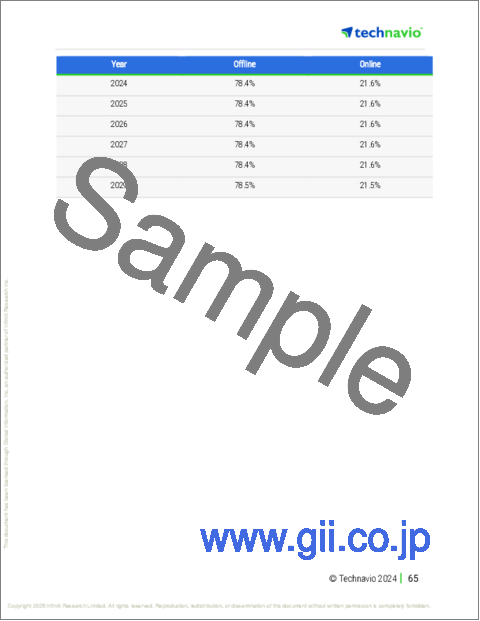
By Distribution Channel
- Offline
- Online
By Type
- Coffee
- Tea
- Cocoa
By Geographical Landscape
- APAC
- North America
- Europe
- South America
- Middle East and Africa
This study identifies the advancements in brewing technologies as one of the prime reasons driving the hot drink market growth during the next few years. Also, growing shift towards fusion flavors, unique combinations, and multi-sensory experiences in hot drinks and growing consumer preference for hot drinks packaged in sustainable materials will lead to sizable demand in the market.
The report on the hot drink market covers the following areas:
- Hot Drink Market sizing
- Hot Drink Market forecast
- Hot Drink Market industry analysis
The robust vendor analysis is designed to help clients improve their market position, and in line with this, this report provides a detailed analysis of several leading hot drink market vendors that include Ajinomoto Co. Inc., Bigelow Tea, Coffee Day Enterprises Ltd., Colcafe Industria Colombiana de Cafe, Cornish Tea Ltd., Costa Ltd., jacobs DOUWE EGBERTS B.V., Keurig Green Mountain Inc., Luckin Coffee Inc., LUIGI LAVAZZA SpA, Mother Parkers Tea and Coffee Inc., Nestle SA, Paulig Ltd., Reily Foods Co, Starbucks Corp., Strauss Group Ltd., TEEKANNE GMBH and CO., The J.M Smucker Co., The Republic of Tea Inc., Unilever PLC, and Wuxi Huadong Cocoa Food Co. Ltd. Also, the hot drink market analysis report includes information on upcoming trends and challenges that will influence market growth. This is to help companies strategize and leverage all forthcoming growth opportunities.
The publisher presents a detailed picture of the market by the way of study, synthesis, and summation of data from multiple sources by an analysis of key parameters such as profit, pricing, competition, and promotions. It presents various market facets by identifying the key industry influencers. The data presented is comprehensive, reliable, and a result of extensive primary and secondary research. The market research reports provide a complete competitive landscape and an in-depth vendor selection methodology and analysis using qualitative and quantitative research to forecast accurate market growth.
Table of Contents
1 Executive Summary
- 1.1 Market overview
- Executive Summary - Chart on Market Overview
- Executive Summary - Data Table on Market Overview
- Executive Summary - Chart on Global Market Characteristics
- Executive Summary - Chart on Market By Geographical Landscape
- Executive Summary - Chart on Market Segmentation by Distribution Channel
- Executive Summary - Chart on Market Segmentation by Type
- Executive Summary - Chart on Incremental Growth
- Executive Summary - Data Table on Incremental Growth
- Executive Summary - Chart on Company Market Positioning
2 Technavio Analysis
- 2.1 Analysis of price sensitivity, lifecycle, customer purchase basket, adoption rates, and purchase criteria
- Analysis of price sensitivity, lifecycle, customer purchase basket, adoption rates, and purchase criteria
- 2.2 Criticality of inputs and Factors of differentiation
- Overview on criticality of inputs and factors of differentiation
- 2.3 Factors of disruption
- Overview on factors of disruption
- 2.4 Impact of drivers and challenges
- Impact of drivers and challenges in 2024 and 2029
3 Market Landscape
- 3.1 Market ecosystem
- Parent Market
- Data Table on - Parent Market
- 3.2 Market characteristics
- Market characteristics analysis
- 3.3 Value chain analysis
- Value chain analysis
4 Market Sizing
- 4.1 Market definition
- Offerings of companies included in the market definition
- 4.2 Market segment analysis
- Market segments
- 4.3 Market size 2024
- 4.4 Market outlook: Forecast for 2024-2029
- Chart on Global - Market size and forecast 2024-2029 ($ billion)
- Data Table on Global - Market size and forecast 2024-2029 ($ billion)
- Chart on Global Market: Year-over-year growth 2024-2029 (%)
- Data Table on Global Market: Year-over-year growth 2024-2029 (%)
5 Historic Market Size
- 5.1 Global Hot Drink Market 2019 - 2023
- Historic Market Size - Data Table on Global Hot Drink Market 2019 - 2023 ($ billion)
- 5.2 Distribution Channel segment analysis 2019 - 2023
- Historic Market Size - Distribution Channel Segment 2019 - 2023 ($ billion)
- 5.3 Type segment analysis 2019 - 2023
- Historic Market Size - Type Segment 2019 - 2023 ($ billion)
- 5.4 Geography segment analysis 2019 - 2023
- Historic Market Size - Geography Segment 2019 - 2023 ($ billion)
- 5.5 Country segment analysis 2019 - 2023
- Historic Market Size - Country Segment 2019 - 2023 ($ billion)
6 Qualitative Analysis
- 6.1 AI Impact on Global Hot Drink Market
7 Five Forces Analysis
- 7.1 Five forces summary
- Five forces analysis - Comparison between 2024 and 2029
- 7.2 Bargaining power of buyers
- Bargaining power of buyers - Impact of key factors 2024 and 2029
- 7.3 Bargaining power of suppliers
- Bargaining power of suppliers - Impact of key factors in 2024 and 2029
- 7.4 Threat of new entrants
- Threat of new entrants - Impact of key factors in 2024 and 2029
- 7.5 Threat of substitutes
- Threat of substitutes - Impact of key factors in 2024 and 2029
- 7.6 Threat of rivalry
- Threat of rivalry - Impact of key factors in 2024 and 2029
- 7.7 Market condition
- Chart on Market condition - Five forces 2024 and 2029
8 Market Segmentation by Distribution Channel
- 8.1 Market segments
- Chart on Distribution Channel - Market share 2024-2029 (%)
- Data Table on Distribution Channel - Market share 2024-2029 (%)
- 8.2 Comparison by Distribution Channel
- Chart on Comparison by Distribution Channel
- Data Table on Comparison by Distribution Channel
- 8.3 Offline - Market size and forecast 2024-2029
- Chart on Offline - Market size and forecast 2024-2029 ($ billion)
- Data Table on Offline - Market size and forecast 2024-2029 ($ billion)
- Chart on Offline - Year-over-year growth 2024-2029 (%)
- Data Table on Offline - Year-over-year growth 2024-2029 (%)
- 8.4 Online - Market size and forecast 2024-2029
- Chart on Online - Market size and forecast 2024-2029 ($ billion)
- Data Table on Online - Market size and forecast 2024-2029 ($ billion)
- Chart on Online - Year-over-year growth 2024-2029 (%)
- Data Table on Online - Year-over-year growth 2024-2029 (%)
- 8.5 Market opportunity by Distribution Channel
- Market opportunity by Distribution Channel ($ billion)
- Data Table on Market opportunity by Distribution Channel ($ billion)
9 Market Segmentation by Type
- 9.1 Market segments
- Chart on Type - Market share 2024-2029 (%)
- Data Table on Type - Market share 2024-2029 (%)
- 9.2 Comparison by Type
- Chart on Comparison by Type
- Data Table on Comparison by Type
- 9.3 Coffee - Market size and forecast 2024-2029
- Chart on Coffee - Market size and forecast 2024-2029 ($ billion)
- Data Table on Coffee - Market size and forecast 2024-2029 ($ billion)
- Chart on Coffee - Year-over-year growth 2024-2029 (%)
- Data Table on Coffee - Year-over-year growth 2024-2029 (%)
- 9.4 Tea - Market size and forecast 2024-2029
- Chart on Tea - Market size and forecast 2024-2029 ($ billion)
- Data Table on Tea - Market size and forecast 2024-2029 ($ billion)
- Chart on Tea - Year-over-year growth 2024-2029 (%)
- Data Table on Tea - Year-over-year growth 2024-2029 (%)
- 9.5 Cocoa - Market size and forecast 2024-2029
- Chart on Cocoa - Market size and forecast 2024-2029 ($ billion)
- Data Table on Cocoa - Market size and forecast 2024-2029 ($ billion)
- Chart on Cocoa - Year-over-year growth 2024-2029 (%)
- Data Table on Cocoa - Year-over-year growth 2024-2029 (%)
- 9.6 Market opportunity by Type
- Market opportunity by Type ($ billion)
- Data Table on Market opportunity by Type ($ billion)
10 Customer Landscape
- 10.1 Customer landscape overview
- Analysis of price sensitivity, lifecycle, customer purchase basket, adoption rates, and purchase criteria
11 Geographic Landscape
- 11.1 Geographic segmentation
- Chart on Market share By Geographical Landscape 2024-2029 (%)
- Data Table on Market share By Geographical Landscape 2024-2029 (%)
- 11.2 Geographic comparison
- Chart on Geographic comparison
- Data Table on Geographic comparison
- 11.3 APAC - Market size and forecast 2024-2029
- Chart on APAC - Market size and forecast 2024-2029 ($ billion)
- Data Table on APAC - Market size and forecast 2024-2029 ($ billion)
- Chart on APAC - Year-over-year growth 2024-2029 (%)
- Data Table on APAC - Year-over-year growth 2024-2029 (%)
- 11.4 North America - Market size and forecast 2024-2029
- Chart on North America - Market size and forecast 2024-2029 ($ billion)
- Data Table on North America - Market size and forecast 2024-2029 ($ billion)
- Chart on North America - Year-over-year growth 2024-2029 (%)
- Data Table on North America - Year-over-year growth 2024-2029 (%)
- 11.5 Europe - Market size and forecast 2024-2029
- Chart on Europe - Market size and forecast 2024-2029 ($ billion)
- Data Table on Europe - Market size and forecast 2024-2029 ($ billion)
- Chart on Europe - Year-over-year growth 2024-2029 (%)
- Data Table on Europe - Year-over-year growth 2024-2029 (%)
- 11.6 South America - Market size and forecast 2024-2029
- Chart on South America - Market size and forecast 2024-2029 ($ billion)
- Data Table on South America - Market size and forecast 2024-2029 ($ billion)
- Chart on South America - Year-over-year growth 2024-2029 (%)
- Data Table on South America - Year-over-year growth 2024-2029 (%)
- 11.7 Middle East and Africa - Market size and forecast 2024-2029
- Chart on Middle East and Africa - Market size and forecast 2024-2029 ($ billion)
- Data Table on Middle East and Africa - Market size and forecast 2024-2029 ($ billion)
- Chart on Middle East and Africa - Year-over-year growth 2024-2029 (%)
- Data Table on Middle East and Africa - Year-over-year growth 2024-2029 (%)
- 11.8 US - Market size and forecast 2024-2029
- Chart on US - Market size and forecast 2024-2029 ($ billion)
- Data Table on US - Market size and forecast 2024-2029 ($ billion)
- Chart on US - Year-over-year growth 2024-2029 (%)
- Data Table on US - Year-over-year growth 2024-2029 (%)
- 11.9 China - Market size and forecast 2024-2029
- Chart on China - Market size and forecast 2024-2029 ($ billion)
- Data Table on China - Market size and forecast 2024-2029 ($ billion)
- Chart on China - Year-over-year growth 2024-2029 (%)
- Data Table on China - Year-over-year growth 2024-2029 (%)
- 11.10 Canada - Market size and forecast 2024-2029
- Chart on Canada - Market size and forecast 2024-2029 ($ billion)
- Data Table on Canada - Market size and forecast 2024-2029 ($ billion)
- Chart on Canada - Year-over-year growth 2024-2029 (%)
- Data Table on Canada - Year-over-year growth 2024-2029 (%)
- 11.11 Japan - Market size and forecast 2024-2029
- Chart on Japan - Market size and forecast 2024-2029 ($ billion)
- Data Table on Japan - Market size and forecast 2024-2029 ($ billion)
- Chart on Japan - Year-over-year growth 2024-2029 (%)
- Data Table on Japan - Year-over-year growth 2024-2029 (%)
- 11.12 India - Market size and forecast 2024-2029
- Chart on India - Market size and forecast 2024-2029 ($ billion)
- Data Table on India - Market size and forecast 2024-2029 ($ billion)
- Chart on India - Year-over-year growth 2024-2029 (%)
- Data Table on India - Year-over-year growth 2024-2029 (%)
- 11.13 Germany - Market size and forecast 2024-2029
- Chart on Germany - Market size and forecast 2024-2029 ($ billion)
- Data Table on Germany - Market size and forecast 2024-2029 ($ billion)
- Chart on Germany - Year-over-year growth 2024-2029 (%)
- Data Table on Germany - Year-over-year growth 2024-2029 (%)
- 11.14 UK - Market size and forecast 2024-2029
- Chart on UK - Market size and forecast 2024-2029 ($ billion)
- Data Table on UK - Market size and forecast 2024-2029 ($ billion)
- Chart on UK - Year-over-year growth 2024-2029 (%)
- Data Table on UK - Year-over-year growth 2024-2029 (%)
- 11.15 France - Market size and forecast 2024-2029
- Chart on France - Market size and forecast 2024-2029 ($ billion)
- Data Table on France - Market size and forecast 2024-2029 ($ billion)
- Chart on France - Year-over-year growth 2024-2029 (%)
- Data Table on France - Year-over-year growth 2024-2029 (%)
- 11.16 Italy - Market size and forecast 2024-2029
- Chart on Italy - Market size and forecast 2024-2029 ($ billion)
- Data Table on Italy - Market size and forecast 2024-2029 ($ billion)
- Chart on Italy - Year-over-year growth 2024-2029 (%)
- Data Table on Italy - Year-over-year growth 2024-2029 (%)
- 11.17 Brazil - Market size and forecast 2024-2029
- Chart on Brazil - Market size and forecast 2024-2029 ($ billion)
- Data Table on Brazil - Market size and forecast 2024-2029 ($ billion)
- Chart on Brazil - Year-over-year growth 2024-2029 (%)
- Data Table on Brazil - Year-over-year growth 2024-2029 (%)
- 11.18 Market opportunity By Geographical Landscape
- Market opportunity By Geographical Landscape ($ billion)
- Data Tables on Market opportunity By Geographical Landscape ($ billion)
12 Drivers, Challenges, and Opportunity/Restraints
- 12.1 Market drivers
- 12.2 Market challenges
- 12.3 Impact of drivers and challenges
- Impact of drivers and challenges in 2024 and 2029
- 12.4 Market opportunities/restraints
13 Competitive Landscape
- 13.1 Overview
- 13.2 Competitive Landscape
- Overview on criticality of inputs and factors of differentiation
- 13.3 Landscape disruption
- Overview on factors of disruption
- 13.4 Industry risks
- Impact of key risks on business
14 Competitive Analysis
- 14.1 Companies profiled
- Companies covered
- 14.2 Company ranking index
- Company ranking index
- 14.3 Market positioning of companies
- Matrix on companies position and classification
- 14.4 Ajinomoto Co. Inc.
- Ajinomoto Co. Inc. - Overview
- Ajinomoto Co. Inc. - Business segments
- Ajinomoto Co. Inc. - Key news
- Ajinomoto Co. Inc. - Key offerings
- Ajinomoto Co. Inc. - Segment focus
- SWOT
- 14.5 Bigelow Tea
- Bigelow Tea - Overview
- Bigelow Tea - Product / Service
- Bigelow Tea - Key offerings
- SWOT
- 14.6 Coffee Day Enterprises Ltd.
- Coffee Day Enterprises Ltd. - Overview
- Coffee Day Enterprises Ltd. - Business segments
- Coffee Day Enterprises Ltd. - Key offerings
- Coffee Day Enterprises Ltd. - Segment focus
- SWOT
- 14.7 Colcafe Industria Colombiana de Cafe
- Colcafe Industria Colombiana de Cafe - Overview
- Colcafe Industria Colombiana de Cafe - Product / Service
- Colcafe Industria Colombiana de Cafe - Key offerings
- SWOT
- 14.8 Costa Ltd.
- Costa Ltd. - Overview
- Costa Ltd. - Product / Service
- Costa Ltd. - Key offerings
- SWOT
- 14.9 jacobs DOUWE EGBERTS B.V.
- jacobs DOUWE EGBERTS B.V. - Overview
- jacobs DOUWE EGBERTS B.V. - Product / Service
- jacobs DOUWE EGBERTS B.V. - Key offerings
- SWOT
- 14.10 Keurig Green Mountain Inc.
- Keurig Green Mountain Inc. - Overview
- Keurig Green Mountain Inc. - Product / Service
- Keurig Green Mountain Inc. - Key offerings
- SWOT
- 14.11 Luckin Coffee Inc.
- Luckin Coffee Inc. - Overview
- Luckin Coffee Inc. - Product / Service
- Luckin Coffee Inc. - Key offerings
- SWOT
- 14.12 LUIGI LAVAZZA SpA
- LUIGI LAVAZZA SpA - Overview
- LUIGI LAVAZZA SpA - Product / Service
- LUIGI LAVAZZA SpA - Key offerings
- SWOT
- 14.13 Mother Parkers Tea and Coffee Inc.
- Mother Parkers Tea and Coffee Inc. - Overview
- Mother Parkers Tea and Coffee Inc. - Product / Service
- Mother Parkers Tea and Coffee Inc. - Key offerings
- SWOT
- 14.14 Starbucks Corp.
- Starbucks Corp. - Overview
- Starbucks Corp. - Business segments
- Starbucks Corp. - Key news
- Starbucks Corp. - Key offerings
- Starbucks Corp. - Segment focus
- SWOT
- 14.15 Strauss Group Ltd.
- Strauss Group Ltd. - Overview
- Strauss Group Ltd. - Business segments
- Strauss Group Ltd. - Key offerings
- Strauss Group Ltd. - Segment focus
- SWOT
- 14.16 The J.M Smucker Co.
- The J.M Smucker Co. - Overview
- The J.M Smucker Co. - Business segments
- The J.M Smucker Co. - Key news
- The J.M Smucker Co. - Key offerings
- The J.M Smucker Co. - Segment focus
- SWOT
- 14.17 The Republic of Tea Inc.
- The Republic of Tea Inc. - Overview
- The Republic of Tea Inc. - Product / Service
- The Republic of Tea Inc. - Key offerings
- SWOT
- 14.18 Unilever PLC
- Unilever PLC - Overview
- Unilever PLC - Business segments
- Unilever PLC - Key offerings
- Unilever PLC - Segment focus
- SWOT
15 Appendix
- 15.1 Scope of the report
- 15.2 Inclusions and exclusions checklist
- Inclusions checklist
- Exclusions checklist
- 15.3 Currency conversion rates for US$
- Currency conversion rates for US$
- 15.4 Research methodology
- Research methodology
- 15.5 Data procurement
- Information sources
- 15.6 Data validation
- Data validation
- 15.7 Validation techniques employed for market sizing
- Validation techniques employed for market sizing
- 15.8 Data synthesis
- Data synthesis
- 15.9 360 degree market analysis
- 360 degree market analysis
- 15.10 List of abbreviations
- List of abbreviations

