|
|
市場調査レポート
商品コード
1732645
溶解木材パルプ(DWP)の世界市場 2025~2029年Global Dissolving Wood Pulp (DWP) Market 2025-2029 |
||||||
|
|||||||
カスタマイズ可能
|
|||||||


| 溶解木材パルプ(DWP)の世界市場 2025~2029年 |
|
出版日: 2025年05月20日
発行: TechNavio
ページ情報: 英文 216 Pages
納期: 即納可能
|

全表示
- 概要
- 図表
- 目次
溶解木材パルプ(DWP)市場は2024-2029年に18億470万米ドル、予測期間中のCAGRは3.3%で成長すると予測されます。
当レポートでは、溶解木材パルプ(DWP)市場の全体的な分析、市場規模・予測、動向、成長促進要因、課題、約25のベンダーを網羅したベンダー分析などを掲載しています。
現在の市場シナリオ、最新動向と促進要因、市場環境全体に関する最新分析を提供しています。市場は、ティッシュや衛生用品の需要拡大、繊維産業の急速な拡大、有利な政府の規制と政策によって牽引されています。
| 市場範囲 | |
|---|---|
| 基準年 | 2025 |
| 終了年 | 2029 |
| 予測期間 | 2025-2029 |
| 成長モメンタム | 加速 |
| 前年比 | 3.2% |
| CAGR | 3.3% |
| 増分額 | 18億470万米ドル |
本調査は、業界の主要参加者からのインプットを含め、一次情報と二次情報を客観的に組み合わせて実施しました。レポートには、主要企業の分析に加え、包括的な市場規模データ、地域分析によるセグメント、ベンダー情勢が含まれています。レポートには過去データと予測データがあります。
本調査では、今後数年間の溶解木材パルプ(DWP)市場の成長を牽引する主な理由の一つとして、ビスコース繊維の需要増加を挙げています。また、バイオベース素材へのシフトとパルプ生産における技術進歩が市場の大きな需要につながります。
目次
第1章 エグゼクティブサマリー
- 市場概要
第2章 Technavio分析
- 価格・ライフサイクル・顧客購入バスケット・採用率・購入基準の分析
- インプットの重要性と差別化の要因
- 混乱の要因
- 促進要因と課題の影響
第3章 市場情勢
- 市場エコシステム
- 市場の特徴
- バリューチェーン分析
第4章 市場規模
- 市場の定義
- 市場セグメント分析
- 市場規模 2024
- 市場の見通し 2024-2029
第5章 市場規模実績
- 溶解木材パルプ(DWP)の世界市場 2019-2023
- タイプ別セグメント分析 2019-2023
- 原材料別セグメント分析 2019-2023
- グレードタイプ別セグメント分析 2019-2023
- 用途別セグメント分析 2019-2023
- 地域別セグメント分析 2019-2023
- 国別セグメント分析 2019-2023
第6章 定性分析
- AIの影響:溶解木材パルプ(DWP)の世界市場
第7章 ファイブフォース分析
- ファイブフォースの要約
- 買い手の交渉力
- 供給企業の交渉力
- 新規参入業者の脅威
- 代替品の脅威
- 競争の脅威
- 市況
第8章 市場セグメンテーション:タイプ別
- 市場セグメント
- 比較:タイプ別
- レーヨングレード:市場規模と予測 2024-2029
- 特殊グレード:市場規模と予測 2024-2029
- 市場機会:タイプ別
第9章 市場セグメンテーション:原材料別
- 市場セグメント
- 比較:原材料別
- 広葉樹:市場規模と予測 2024-2029
- 針葉樹:市場規模と予測 2024-2029
- 市場機会:原材料別
第10章 市場セグメンテーション:グレードタイプ別
- 市場セグメント
- 比較:グレードタイプ別
- アルファセルロース:市場規模と予測 2024-2029
- ベータセルロース:市場規模と予測 2024-2029
- ガンマセルロース:市場規模と予測 2024-2029
- 市場機会:グレードタイプ別
第11章 市場セグメンテーション:用途別
- 市場セグメント
- 比較:用途別
- ビスコース繊維:市場規模と予測 2024-2029
- アセテート:市場規模と予測 2024-2029
- セロハン:市場規模と予測 2024-2029
- その他:市場規模と予測 2024-2029
- 市場機会:用途別
第12章 顧客情勢
- 顧客情勢の概要
第13章 地域別情勢
- 地域別セグメンテーション
- 地域別比較
- 北米:市場規模と予測 2024-2029
- 欧州:市場規模と予測 2024-2029
- アジア太平洋:市場規模と予測 2024-2029
- 南米:市場規模と予測 2024-2029
- 中東・アフリカ:市場規模と予測 2024-2029
- 米国:市場規模と予測 2024-2029
- 中国:市場規模と予測 2024-2029
- スウェーデン:市場規模と予測 2024-2029
- ブラジル:市場規模と予測 2024-2029
- フィンランド:市場規模と予測 2024-2029
- カナダ:市場規模と予測 2024-2029
- オーストリア:市場規模と予測 2024-2029
- インド:市場規模と予測 2024-2029
- ドイツ:市場規模と予測 2024-2029
- 日本:市場規模と予測 2024-2029
- 市場機会:地域情勢別
第14章 促進要因・課題・機会・抑制要因
- 市場促進要因
- 市場の課題
- 促進要因と課題の影響
- 市場の機会・抑制要因
第15章 競合情勢
- 概要
- 競合情勢
- 混乱の状況
- 業界のリスク
第16章 競合分析
- 企業プロファイル
- 企業ランキング指数
- 企業の市場ポジショニング
- Aditya Birla Management Corp. Pvt. Ltd.
- Amafhh Enterprises
- Bracell
- Fujian Qingshan Paper Industry Co Ltd.
- Fulida Group Holding Co. Ltd.
- Lenzing AG
- Nippon Paper Industries Co. Ltd.
- RAG Innovations
- Rayonier Advanced Materials
- Sappi Ltd.
- Shandong Sun Holdings Group
- Siam Cement PCL
- Yueyang Forest and Paper Co Ltd.
第17章 付録
Exhibits:
- Exhibits1: Executive Summary - Chart on Market Overview
- Exhibits2: Executive Summary - Data Table on Market Overview
- Exhibits3: Executive Summary - Chart on Global Market Characteristics
- Exhibits4: Executive Summary - Chart on Market By Geographical Landscape
- Exhibits5: Executive Summary - Chart on Market Segmentation by Type
- Exhibits6: Executive Summary - Chart on Market Segmentation by Raw Material
- Exhibits7: Executive Summary - Chart on Market Segmentation by Grade Type
- Exhibits8: Executive Summary - Chart on Market Segmentation by Application
- Exhibits9: Executive Summary - Chart on Incremental Growth
- Exhibits10: Executive Summary - Data Table on Incremental Growth
- Exhibits11: Executive Summary - Chart on Company Market Positioning
- Exhibits12: Analysis of price sensitivity, lifecycle, customer purchase basket, adoption rates, and purchase criteria
- Exhibits13: Overview on criticality of inputs and factors of differentiation
- Exhibits14: Overview on factors of disruption
- Exhibits15: Impact of drivers and challenges in 2024 and 2029
- Exhibits16: Parent Market
- Exhibits17: Data Table on - Parent Market
- Exhibits18: Market characteristics analysis
- Exhibits19: Value chain analysis
- Exhibits20: Offerings of companies included in the market definition
- Exhibits21: Market segments
- Exhibits22: Chart on Global - Market size and forecast 2024-2029 ($ million)
- Exhibits23: Data Table on Global - Market size and forecast 2024-2029 ($ million)
- Exhibits24: Chart on Global Market: Year-over-year growth 2024-2029 (%)
- Exhibits25: Data Table on Global Market: Year-over-year growth 2024-2029 (%)
- Exhibits26: Historic Market Size - Data Table on Global Dissolving Wood Pulp (DWP) Market 2019 - 2023 ($ million)
- Exhibits27: Historic Market Size - Type Segment 2019 - 2023 ($ million)
- Exhibits28: Historic Market Size - Raw Material Segment 2019 - 2023 ($ million)
- Exhibits29: Historic Market Size - Grade Type Segment 2019 - 2023 ($ million)
- Exhibits30: Historic Market Size - Application Segment 2019 - 2023 ($ million)
- Exhibits31: Historic Market Size - Geography Segment 2019 - 2023 ($ million)
- Exhibits32: Historic Market Size - Country Segment 2019 - 2023 ($ million)
- Exhibits33: Five forces analysis - Comparison between 2024 and 2029
- Exhibits34: Bargaining power of buyers - Impact of key factors 2024 and 2029
- Exhibits35: Bargaining power of suppliers - Impact of key factors in 2024 and 2029
- Exhibits36: Threat of new entrants - Impact of key factors in 2024 and 2029
- Exhibits37: Threat of substitutes - Impact of key factors in 2024 and 2029
- Exhibits38: Threat of rivalry - Impact of key factors in 2024 and 2029
- Exhibits39: Chart on Market condition - Five forces 2024 and 2029
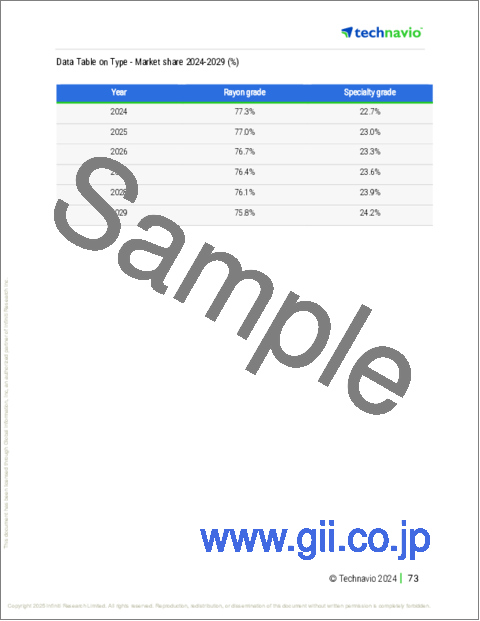
- Exhibits40: Chart on Type - Market share 2024-2029 (%)
- Exhibits41: Data Table on Type - Market share 2024-2029 (%)
- Exhibits42: Chart on Comparison by Type
- Exhibits43: Data Table on Comparison by Type
- Exhibits44: Chart on Rayon grade - Market size and forecast 2024-2029 ($ million)
- Exhibits45: Data Table on Rayon grade - Market size and forecast 2024-2029 ($ million)
- Exhibits46: Chart on Rayon grade - Year-over-year growth 2024-2029 (%)
- Exhibits47: Data Table on Rayon grade - Year-over-year growth 2024-2029 (%)
- Exhibits48: Chart on Specialty grade - Market size and forecast 2024-2029 ($ million)
- Exhibits49: Data Table on Specialty grade - Market size and forecast 2024-2029 ($ million)
- Exhibits50: Chart on Specialty grade - Year-over-year growth 2024-2029 (%)
- Exhibits51: Data Table on Specialty grade - Year-over-year growth 2024-2029 (%)
- Exhibits52: Market opportunity by Type ($ million)
- Exhibits53: Data Table on Market opportunity by Type ($ million)
- Exhibits54: Chart on Raw Material - Market share 2024-2029 (%)
- Exhibits55: Data Table on Raw Material - Market share 2024-2029 (%)
- Exhibits56: Chart on Comparison by Raw Material
- Exhibits57: Data Table on Comparison by Raw Material
- Exhibits58: Chart on Hardwood - Market size and forecast 2024-2029 ($ million)
- Exhibits59: Data Table on Hardwood - Market size and forecast 2024-2029 ($ million)
- Exhibits60: Chart on Hardwood - Year-over-year growth 2024-2029 (%)
- Exhibits61: Data Table on Hardwood - Year-over-year growth 2024-2029 (%)
- Exhibits62: Chart on Softwood - Market size and forecast 2024-2029 ($ million)
- Exhibits63: Data Table on Softwood - Market size and forecast 2024-2029 ($ million)
- Exhibits64: Chart on Softwood - Year-over-year growth 2024-2029 (%)
- Exhibits65: Data Table on Softwood - Year-over-year growth 2024-2029 (%)
- Exhibits66: Market opportunity by Raw Material ($ million)
- Exhibits67: Data Table on Market opportunity by Raw Material ($ million)
- Exhibits68: Chart on Grade Type - Market share 2024-2029 (%)
- Exhibits69: Data Table on Grade Type - Market share 2024-2029 (%)
- Exhibits70: Chart on Comparison by Grade Type
- Exhibits71: Data Table on Comparison by Grade Type
- Exhibits72: Chart on Alpha-cellulose - Market size and forecast 2024-2029 ($ million)
- Exhibits73: Data Table on Alpha-cellulose - Market size and forecast 2024-2029 ($ million)
- Exhibits74: Chart on Alpha-cellulose - Year-over-year growth 2024-2029 (%)
- Exhibits75: Data Table on Alpha-cellulose - Year-over-year growth 2024-2029 (%)
- Exhibits76: Chart on Beta-cellulose - Market size and forecast 2024-2029 ($ million)
- Exhibits77: Data Table on Beta-cellulose - Market size and forecast 2024-2029 ($ million)
- Exhibits78: Chart on Beta-cellulose - Year-over-year growth 2024-2029 (%)
- Exhibits79: Data Table on Beta-cellulose - Year-over-year growth 2024-2029 (%)
- Exhibits80: Chart on Gamma-cellulose - Market size and forecast 2024-2029 ($ million)
- Exhibits81: Data Table on Gamma-cellulose - Market size and forecast 2024-2029 ($ million)
- Exhibits82: Chart on Gamma-cellulose - Year-over-year growth 2024-2029 (%)
- Exhibits83: Data Table on Gamma-cellulose - Year-over-year growth 2024-2029 (%)
- Exhibits84: Market opportunity by Grade Type ($ million)
- Exhibits85: Data Table on Market opportunity by Grade Type ($ million)
- Exhibits86: Chart on Application - Market share 2024-2029 (%)
- Exhibits87: Data Table on Application - Market share 2024-2029 (%)
- Exhibits88: Chart on Comparison by Application
- Exhibits89: Data Table on Comparison by Application
- Exhibits90: Chart on Viscose Fiber - Market size and forecast 2024-2029 ($ million)
- Exhibits91: Data Table on Viscose Fiber - Market size and forecast 2024-2029 ($ million)
- Exhibits92: Chart on Viscose Fiber - Year-over-year growth 2024-2029 (%)
- Exhibits93: Data Table on Viscose Fiber - Year-over-year growth 2024-2029 (%)
- Exhibits94: Chart on Acetate - Market size and forecast 2024-2029 ($ million)
- Exhibits95: Data Table on Acetate - Market size and forecast 2024-2029 ($ million)
- Exhibits96: Chart on Acetate - Year-over-year growth 2024-2029 (%)
- Exhibits97: Data Table on Acetate - Year-over-year growth 2024-2029 (%)
- Exhibits98: Chart on Cellophane - Market size and forecast 2024-2029 ($ million)
- Exhibits99: Data Table on Cellophane - Market size and forecast 2024-2029 ($ million)
- Exhibits100: Chart on Cellophane - Year-over-year growth 2024-2029 (%)
- Exhibits101: Data Table on Cellophane - Year-over-year growth 2024-2029 (%)
- Exhibits102: Chart on Others - Market size and forecast 2024-2029 ($ million)
- Exhibits103: Data Table on Others - Market size and forecast 2024-2029 ($ million)
- Exhibits104: Chart on Others - Year-over-year growth 2024-2029 (%)
- Exhibits105: Data Table on Others - Year-over-year growth 2024-2029 (%)
- Exhibits106: Market opportunity by Application ($ million)
- Exhibits107: Data Table on Market opportunity by Application ($ million)
- Exhibits108: Analysis of price sensitivity, lifecycle, customer purchase basket, adoption rates, and purchase criteria
- Exhibits109: Chart on Market share By Geographical Landscape 2024-2029 (%)
- Exhibits110: Data Table on Market share By Geographical Landscape 2024-2029 (%)
- Exhibits111: Chart on Geographic comparison
- Exhibits112: Data Table on Geographic comparison
- Exhibits113: Chart on North America - Market size and forecast 2024-2029 ($ million)
- Exhibits114: Data Table on North America - Market size and forecast 2024-2029 ($ million)
- Exhibits115: Chart on North America - Year-over-year growth 2024-2029 (%)
- Exhibits116: Data Table on North America - Year-over-year growth 2024-2029 (%)
- Exhibits117: Chart on Europe - Market size and forecast 2024-2029 ($ million)
- Exhibits118: Data Table on Europe - Market size and forecast 2024-2029 ($ million)
- Exhibits119: Chart on Europe - Year-over-year growth 2024-2029 (%)
- Exhibits120: Data Table on Europe - Year-over-year growth 2024-2029 (%)
- Exhibits121: Chart on APAC - Market size and forecast 2024-2029 ($ million)
- Exhibits122: Data Table on APAC - Market size and forecast 2024-2029 ($ million)
- Exhibits123: Chart on APAC - Year-over-year growth 2024-2029 (%)
- Exhibits124: Data Table on APAC - Year-over-year growth 2024-2029 (%)
- Exhibits125: Chart on South America - Market size and forecast 2024-2029 ($ million)
- Exhibits126: Data Table on South America - Market size and forecast 2024-2029 ($ million)
- Exhibits127: Chart on South America - Year-over-year growth 2024-2029 (%)
- Exhibits128: Data Table on South America - Year-over-year growth 2024-2029 (%)
- Exhibits129: Chart on Middle East and Africa - Market size and forecast 2024-2029 ($ million)
- Exhibits130: Data Table on Middle East and Africa - Market size and forecast 2024-2029 ($ million)
- Exhibits131: Chart on Middle East and Africa - Year-over-year growth 2024-2029 (%)
- Exhibits132: Data Table on Middle East and Africa - Year-over-year growth 2024-2029 (%)
- Exhibits133: Chart on US - Market size and forecast 2024-2029 ($ million)
- Exhibits134: Data Table on US - Market size and forecast 2024-2029 ($ million)
- Exhibits135: Chart on US - Year-over-year growth 2024-2029 (%)
- Exhibits136: Data Table on US - Year-over-year growth 2024-2029 (%)
- Exhibits137: Chart on China - Market size and forecast 2024-2029 ($ million)
- Exhibits138: Data Table on China - Market size and forecast 2024-2029 ($ million)
- Exhibits139: Chart on China - Year-over-year growth 2024-2029 (%)
- Exhibits140: Data Table on China - Year-over-year growth 2024-2029 (%)
- Exhibits141: Chart on Sweden - Market size and forecast 2024-2029 ($ million)
- Exhibits142: Data Table on Sweden - Market size and forecast 2024-2029 ($ million)
- Exhibits143: Chart on Sweden - Year-over-year growth 2024-2029 (%)
- Exhibits144: Data Table on Sweden - Year-over-year growth 2024-2029 (%)
- Exhibits145: Chart on Brazil - Market size and forecast 2024-2029 ($ million)
- Exhibits146: Data Table on Brazil - Market size and forecast 2024-2029 ($ million)
- Exhibits147: Chart on Brazil - Year-over-year growth 2024-2029 (%)
- Exhibits148: Data Table on Brazil - Year-over-year growth 2024-2029 (%)
- Exhibits149: Chart on Finland - Market size and forecast 2024-2029 ($ million)
- Exhibits150: Data Table on Finland - Market size and forecast 2024-2029 ($ million)
- Exhibits151: Chart on Finland - Year-over-year growth 2024-2029 (%)
- Exhibits152: Data Table on Finland - Year-over-year growth 2024-2029 (%)
- Exhibits153: Chart on Canada - Market size and forecast 2024-2029 ($ million)
- Exhibits154: Data Table on Canada - Market size and forecast 2024-2029 ($ million)
- Exhibits155: Chart on Canada - Year-over-year growth 2024-2029 (%)
- Exhibits156: Data Table on Canada - Year-over-year growth 2024-2029 (%)
- Exhibits157: Chart on Austria - Market size and forecast 2024-2029 ($ million)
- Exhibits158: Data Table on Austria - Market size and forecast 2024-2029 ($ million)
- Exhibits159: Chart on Austria - Year-over-year growth 2024-2029 (%)
- Exhibits160: Data Table on Austria - Year-over-year growth 2024-2029 (%)
- Exhibits161: Chart on India - Market size and forecast 2024-2029 ($ million)
- Exhibits162: Data Table on India - Market size and forecast 2024-2029 ($ million)
- Exhibits163: Chart on India - Year-over-year growth 2024-2029 (%)
- Exhibits164: Data Table on India - Year-over-year growth 2024-2029 (%)
- Exhibits165: Chart on Germany - Market size and forecast 2024-2029 ($ million)
- Exhibits166: Data Table on Germany - Market size and forecast 2024-2029 ($ million)
- Exhibits167: Chart on Germany - Year-over-year growth 2024-2029 (%)
- Exhibits168: Data Table on Germany - Year-over-year growth 2024-2029 (%)
- Exhibits169: Chart on Japan - Market size and forecast 2024-2029 ($ million)
- Exhibits170: Data Table on Japan - Market size and forecast 2024-2029 ($ million)
- Exhibits171: Chart on Japan - Year-over-year growth 2024-2029 (%)
- Exhibits172: Data Table on Japan - Year-over-year growth 2024-2029 (%)
- Exhibits173: Market opportunity By Geographical Landscape ($ million)
- Exhibits174: Data Tables on Market opportunity By Geographical Landscape ($ million)
- Exhibits175: Impact of drivers and challenges in 2024 and 2029
- Exhibits176: Overview on criticality of inputs and factors of differentiation
- Exhibits177: Overview on factors of disruption
- Exhibits178: Impact of key risks on business
- Exhibits179: Companies covered
- Exhibits180: Company ranking index
- Exhibits181: Matrix on companies position and classification
- Exhibits182: Aditya Birla Management Corp. Pvt. Ltd. - Overview
- Exhibits183: Aditya Birla Management Corp. Pvt. Ltd. - Product / Service
- Exhibits184: Aditya Birla Management Corp. Pvt. Ltd. - Key offerings
- Exhibits185: SWOT
- Exhibits186: Amafhh Enterprises - Overview
- Exhibits187: Amafhh Enterprises - Product / Service
- Exhibits188: Amafhh Enterprises - Key offerings
- Exhibits189: SWOT
- Exhibits190: Bracell - Overview
- Exhibits191: Bracell - Product / Service
- Exhibits192: Bracell - Key offerings
- Exhibits193: SWOT
- Exhibits194: Fujian Qingshan Paper Industry Co Ltd. - Overview
- Exhibits195: Fujian Qingshan Paper Industry Co Ltd. - Product / Service
- Exhibits196: Fujian Qingshan Paper Industry Co Ltd. - Key offerings
- Exhibits197: SWOT
- Exhibits198: Fulida Group Holding Co. Ltd. - Overview
- Exhibits199: Fulida Group Holding Co. Ltd. - Product / Service
- Exhibits200: Fulida Group Holding Co. Ltd. - Key offerings
- Exhibits201: SWOT
- Exhibits202: Lenzing AG - Overview
- Exhibits203: Lenzing AG - Business segments
- Exhibits204: Lenzing AG - Key offerings
- Exhibits205: Lenzing AG - Segment focus
- Exhibits206: SWOT
- Exhibits207: Nippon Paper Industries Co. Ltd. - Overview
- Exhibits208: Nippon Paper Industries Co. Ltd. - Business segments
- Exhibits209: Nippon Paper Industries Co. Ltd. - Key news
- Exhibits210: Nippon Paper Industries Co. Ltd. - Key offerings
- Exhibits211: Nippon Paper Industries Co. Ltd. - Segment focus
- Exhibits212: SWOT
- Exhibits213: RAG Innovations - Overview
- Exhibits214: RAG Innovations - Product / Service
- Exhibits215: RAG Innovations - Key offerings
- Exhibits216: SWOT
- Exhibits217: Rayonier Advanced Materials - Overview
- Exhibits218: Rayonier Advanced Materials - Product / Service
- Exhibits219: Rayonier Advanced Materials - Key offerings
- Exhibits220: SWOT
- Exhibits221: Sappi Ltd. - Overview
- Exhibits222: Sappi Ltd. - Product / Service
- Exhibits223: Sappi Ltd. - Key offerings
- Exhibits224: SWOT
- Exhibits225: Shandong Sun Holdings Group - Overview
- Exhibits226: Shandong Sun Holdings Group - Product / Service
- Exhibits227: Shandong Sun Holdings Group - Key offerings
- Exhibits228: SWOT
- Exhibits229: Siam Cement PCL - Overview
- Exhibits230: Siam Cement PCL - Business segments
- Exhibits231: Siam Cement PCL - Key offerings
- Exhibits232: Siam Cement PCL - Segment focus
- Exhibits233: SWOT
- Exhibits234: Yueyang Forest and Paper Co Ltd. - Overview
- Exhibits235: Yueyang Forest and Paper Co Ltd. - Product / Service
- Exhibits236: Yueyang Forest and Paper Co Ltd. - Key offerings
- Exhibits237: SWOT
- Exhibits238: Inclusions checklist
- Exhibits239: Exclusions checklist
- Exhibits240: Currency conversion rates for US$
- Exhibits241: Research methodology
- Exhibits242: Information sources
- Exhibits243: Data validation
- Exhibits244: Validation techniques employed for market sizing
- Exhibits245: Data synthesis
- Exhibits246: 360 degree market analysis
- Exhibits247: List of abbreviations
The dissolving wood pulp (DWP) market is forecasted to grow by USD 1,804.7 mn during 2024-2029, accelerating at a CAGR of 3.3% during the forecast period. The report on the dissolving wood pulp (DWP) market provides a holistic analysis, market size and forecast, trends, growth drivers, and challenges, as well as vendor analysis covering around 25 vendors.
The report offers an up-to-date analysis regarding the current market scenario, the latest trends and drivers, and the overall market environment. The market is driven by growing demand for tissue and hygiene products, rapid expansion of textile industry, and favorable government regulations and policies.
| Market Scope | |
|---|---|
| Base Year | 2025 |
| End Year | 2029 |
| Series Year | 2025-2029 |
| Growth Momentum | Accelerate |
| YOY 2025 | 3.2% |
| CAGR | 3.3% |
| Incremental Value | $1,804.7 mn |
The study was conducted using an objective combination of primary and secondary information including inputs from key participants in the industry. The report contains a comprehensive market size data, segment with regional analysis and vendor landscape in addition to an analysis of the key companies. Reports have historic and forecast data.
Technavio's dissolving wood pulp (DWP) market is segmented as below:
By Type
- Rayon grade
- Specialty grade
By Raw Material
- Hardwood
- Softwood
By Grade Type
- Alpha-cellulose
- Beta-cellulose
- Gamma-cellulose
By Application
- Viscose Fiber
- Acetate
- Cellophane
- Others
By Geographical Landscape
- North America
- Europe
- APAC
- South America
- Middle East and Africa
This study identifies the rising demand for viscose fibers as one of the prime reasons driving the dissolving wood pulp (DWP) market growth during the next few years. Also, shift toward bio-based materials and technological advancements in pulp production will lead to sizable demand in the market.
The report on the dissolving wood pulp (DWP) market covers the following areas:
- Dissolving Wood Pulp (DWP) Market sizing
- Dissolving Wood Pulp (DWP) Market forecast
- Dissolving Wood Pulp (DWP) Market industry analysis
The robust vendor analysis is designed to help clients improve their market position, and in line with this, this report provides a detailed analysis of several leading dissolving wood pulp (DWP) market vendors that include Aditya Birla Management Corp. Pvt. Ltd., Amafhh Enterprises, Bracell, Fujian Qingshan Paper Industry Co Ltd., Fulida Group Holding Co. Ltd., Lenzing AG, Nippon Paper Industries Co. Ltd., RAG Innovations, Rayonier Advanced Materials, Sappi Ltd., Shandong Sun Holdings Group, Siam Cement PCL, and Yueyang Forest and Paper Co Ltd.. Also, the dissolving wood pulp (DWP) market analysis report includes information on upcoming trends and challenges that will influence market growth. This is to help companies strategize and leverage all forthcoming growth opportunities.
The publisher presents a detailed picture of the market by the way of study, synthesis, and summation of data from multiple sources by an analysis of key parameters such as profit, pricing, competition, and promotions. It presents various market facets by identifying the key industry influencers. The data presented is comprehensive, reliable, and a result of extensive primary and secondary research. The market research reports provide a complete competitive landscape and an in-depth vendor selection methodology and analysis using qualitative and quantitative research to forecast accurate market growth.
Table of Contents
1 Executive Summary
- 1.1 Market overview
- Executive Summary - Chart on Market Overview
- Executive Summary - Data Table on Market Overview
- Executive Summary - Chart on Global Market Characteristics
- Executive Summary - Chart on Market By Geographical Landscape
- Executive Summary - Chart on Market Segmentation by Type
- Executive Summary - Chart on Market Segmentation by Raw Material
- Executive Summary - Chart on Market Segmentation by Grade Type
- Executive Summary - Chart on Market Segmentation by Application
- Executive Summary - Chart on Incremental Growth
- Executive Summary - Data Table on Incremental Growth
- Executive Summary - Chart on Company Market Positioning
2 Technavio Analysis
- 2.1 Analysis of price sensitivity, lifecycle, customer purchase basket, adoption rates, and purchase criteria
- Analysis of price sensitivity, lifecycle, customer purchase basket, adoption rates, and purchase criteria
- 2.2 Criticality of inputs and Factors of differentiation
- Overview on criticality of inputs and factors of differentiation
- 2.3 Factors of disruption
- Overview on factors of disruption
- 2.4 Impact of drivers and challenges
- Impact of drivers and challenges in 2024 and 2029
3 Market Landscape
- 3.1 Market ecosystem
- Parent Market
- Data Table on - Parent Market
- 3.2 Market characteristics
- Market characteristics analysis
- 3.3 Value chain analysis
- Value chain analysis
4 Market Sizing
- 4.1 Market definition
- Offerings of companies included in the market definition
- 4.2 Market segment analysis
- Market segments
- 4.3 Market size 2024
- 4.4 Market outlook: Forecast for 2024-2029
- Chart on Global - Market size and forecast 2024-2029 ($ million)
- Data Table on Global - Market size and forecast 2024-2029 ($ million)
- Chart on Global Market: Year-over-year growth 2024-2029 (%)
- Data Table on Global Market: Year-over-year growth 2024-2029 (%)
5 Historic Market Size
- 5.1 Global Dissolving Wood Pulp (DWP) Market 2019 - 2023
- Historic Market Size - Data Table on Global Dissolving Wood Pulp (DWP) Market 2019 - 2023 ($ million)
- 5.2 Type segment analysis 2019 - 2023
- Historic Market Size - Type Segment 2019 - 2023 ($ million)
- 5.3 Raw Material segment analysis 2019 - 2023
- Historic Market Size - Raw Material Segment 2019 - 2023 ($ million)
- 5.4 Grade Type segment analysis 2019 - 2023
- Historic Market Size - Grade Type Segment 2019 - 2023 ($ million)
- 5.5 Application segment analysis 2019 - 2023
- Historic Market Size - Application Segment 2019 - 2023 ($ million)
- 5.6 Geography segment analysis 2019 - 2023
- Historic Market Size - Geography Segment 2019 - 2023 ($ million)
- 5.7 Country segment analysis 2019 - 2023
- Historic Market Size - Country Segment 2019 - 2023 ($ million)
6 Qualitative Analysis
- 6.1 Impact of AI in global dissolving wood pulp (DWP) market
7 Five Forces Analysis
- 7.1 Five forces summary
- Five forces analysis - Comparison between 2024 and 2029
- 7.2 Bargaining power of buyers
- Bargaining power of buyers - Impact of key factors 2024 and 2029
- 7.3 Bargaining power of suppliers
- Bargaining power of suppliers - Impact of key factors in 2024 and 2029
- 7.4 Threat of new entrants
- Threat of new entrants - Impact of key factors in 2024 and 2029
- 7.5 Threat of substitutes
- Threat of substitutes - Impact of key factors in 2024 and 2029
- 7.6 Threat of rivalry
- Threat of rivalry - Impact of key factors in 2024 and 2029
- 7.7 Market condition
- Chart on Market condition - Five forces 2024 and 2029
8 Market Segmentation by Type
- 8.1 Market segments
- Chart on Type - Market share 2024-2029 (%)
- Data Table on Type - Market share 2024-2029 (%)
- 8.2 Comparison by Type
- Chart on Comparison by Type
- Data Table on Comparison by Type
- 8.3 Rayon grade - Market size and forecast 2024-2029
- Chart on Rayon grade - Market size and forecast 2024-2029 ($ million)
- Data Table on Rayon grade - Market size and forecast 2024-2029 ($ million)
- Chart on Rayon grade - Year-over-year growth 2024-2029 (%)
- Data Table on Rayon grade - Year-over-year growth 2024-2029 (%)
- 8.4 Specialty grade - Market size and forecast 2024-2029
- Chart on Specialty grade - Market size and forecast 2024-2029 ($ million)
- Data Table on Specialty grade - Market size and forecast 2024-2029 ($ million)
- Chart on Specialty grade - Year-over-year growth 2024-2029 (%)
- Data Table on Specialty grade - Year-over-year growth 2024-2029 (%)
- 8.5 Market opportunity by Type
- Market opportunity by Type ($ million)
- Data Table on Market opportunity by Type ($ million)
9 Market Segmentation by Raw Material
- 9.1 Market segments
- Chart on Raw Material - Market share 2024-2029 (%)
- Data Table on Raw Material - Market share 2024-2029 (%)
- 9.2 Comparison by Raw Material
- Chart on Comparison by Raw Material
- Data Table on Comparison by Raw Material
- 9.3 Hardwood - Market size and forecast 2024-2029
- Chart on Hardwood - Market size and forecast 2024-2029 ($ million)
- Data Table on Hardwood - Market size and forecast 2024-2029 ($ million)
- Chart on Hardwood - Year-over-year growth 2024-2029 (%)
- Data Table on Hardwood - Year-over-year growth 2024-2029 (%)
- 9.4 Softwood - Market size and forecast 2024-2029
- Chart on Softwood - Market size and forecast 2024-2029 ($ million)
- Data Table on Softwood - Market size and forecast 2024-2029 ($ million)
- Chart on Softwood - Year-over-year growth 2024-2029 (%)
- Data Table on Softwood - Year-over-year growth 2024-2029 (%)
- 9.5 Market opportunity by Raw Material
- Market opportunity by Raw Material ($ million)
- Data Table on Market opportunity by Raw Material ($ million)
10 Market Segmentation by Grade Type
- 10.1 Market segments
- Chart on Grade Type - Market share 2024-2029 (%)
- Data Table on Grade Type - Market share 2024-2029 (%)
- 10.2 Comparison by Grade Type
- Chart on Comparison by Grade Type
- Data Table on Comparison by Grade Type
- 10.3 Alpha-cellulose - Market size and forecast 2024-2029
- Chart on Alpha-cellulose - Market size and forecast 2024-2029 ($ million)
- Data Table on Alpha-cellulose - Market size and forecast 2024-2029 ($ million)
- Chart on Alpha-cellulose - Year-over-year growth 2024-2029 (%)
- Data Table on Alpha-cellulose - Year-over-year growth 2024-2029 (%)
- 10.4 Beta-cellulose - Market size and forecast 2024-2029
- Chart on Beta-cellulose - Market size and forecast 2024-2029 ($ million)
- Data Table on Beta-cellulose - Market size and forecast 2024-2029 ($ million)
- Chart on Beta-cellulose - Year-over-year growth 2024-2029 (%)
- Data Table on Beta-cellulose - Year-over-year growth 2024-2029 (%)
- 10.5 Gamma-cellulose - Market size and forecast 2024-2029
- Chart on Gamma-cellulose - Market size and forecast 2024-2029 ($ million)
- Data Table on Gamma-cellulose - Market size and forecast 2024-2029 ($ million)
- Chart on Gamma-cellulose - Year-over-year growth 2024-2029 (%)
- Data Table on Gamma-cellulose - Year-over-year growth 2024-2029 (%)
- 10.6 Market opportunity by Grade Type
- Market opportunity by Grade Type ($ million)
- Data Table on Market opportunity by Grade Type ($ million)
11 Market Segmentation by Application
- 11.1 Market segments
- Chart on Application - Market share 2024-2029 (%)
- Data Table on Application - Market share 2024-2029 (%)
- 11.2 Comparison by Application
- Chart on Comparison by Application
- Data Table on Comparison by Application
- 11.3 Viscose Fiber - Market size and forecast 2024-2029
- Chart on Viscose Fiber - Market size and forecast 2024-2029 ($ million)
- Data Table on Viscose Fiber - Market size and forecast 2024-2029 ($ million)
- Chart on Viscose Fiber - Year-over-year growth 2024-2029 (%)
- Data Table on Viscose Fiber - Year-over-year growth 2024-2029 (%)
- 11.4 Acetate - Market size and forecast 2024-2029
- Chart on Acetate - Market size and forecast 2024-2029 ($ million)
- Data Table on Acetate - Market size and forecast 2024-2029 ($ million)
- Chart on Acetate - Year-over-year growth 2024-2029 (%)
- Data Table on Acetate - Year-over-year growth 2024-2029 (%)
- 11.5 Cellophane - Market size and forecast 2024-2029
- Chart on Cellophane - Market size and forecast 2024-2029 ($ million)
- Data Table on Cellophane - Market size and forecast 2024-2029 ($ million)
- Chart on Cellophane - Year-over-year growth 2024-2029 (%)
- Data Table on Cellophane - Year-over-year growth 2024-2029 (%)
- 11.6 Others - Market size and forecast 2024-2029
- Chart on Others - Market size and forecast 2024-2029 ($ million)
- Data Table on Others - Market size and forecast 2024-2029 ($ million)
- Chart on Others - Year-over-year growth 2024-2029 (%)
- Data Table on Others - Year-over-year growth 2024-2029 (%)
- 11.7 Market opportunity by Application
- Market opportunity by Application ($ million)
- Data Table on Market opportunity by Application ($ million)
12 Customer Landscape
- 12.1 Customer landscape overview
- Analysis of price sensitivity, lifecycle, customer purchase basket, adoption rates, and purchase criteria
13 Geographic Landscape
- 13.1 Geographic segmentation
- Chart on Market share By Geographical Landscape 2024-2029 (%)
- Data Table on Market share By Geographical Landscape 2024-2029 (%)
- 13.2 Geographic comparison
- Chart on Geographic comparison
- Data Table on Geographic comparison
- 13.3 North America - Market size and forecast 2024-2029
- Chart on North America - Market size and forecast 2024-2029 ($ million)
- Data Table on North America - Market size and forecast 2024-2029 ($ million)
- Chart on North America - Year-over-year growth 2024-2029 (%)
- Data Table on North America - Year-over-year growth 2024-2029 (%)
- 13.4 Europe - Market size and forecast 2024-2029
- Chart on Europe - Market size and forecast 2024-2029 ($ million)
- Data Table on Europe - Market size and forecast 2024-2029 ($ million)
- Chart on Europe - Year-over-year growth 2024-2029 (%)
- Data Table on Europe - Year-over-year growth 2024-2029 (%)
- 13.5 APAC - Market size and forecast 2024-2029
- Chart on APAC - Market size and forecast 2024-2029 ($ million)
- Data Table on APAC - Market size and forecast 2024-2029 ($ million)
- Chart on APAC - Year-over-year growth 2024-2029 (%)
- Data Table on APAC - Year-over-year growth 2024-2029 (%)
- 13.6 South America - Market size and forecast 2024-2029
- Chart on South America - Market size and forecast 2024-2029 ($ million)
- Data Table on South America - Market size and forecast 2024-2029 ($ million)
- Chart on South America - Year-over-year growth 2024-2029 (%)
- Data Table on South America - Year-over-year growth 2024-2029 (%)
- 13.7 Middle East and Africa - Market size and forecast 2024-2029
- Chart on Middle East and Africa - Market size and forecast 2024-2029 ($ million)
- Data Table on Middle East and Africa - Market size and forecast 2024-2029 ($ million)
- Chart on Middle East and Africa - Year-over-year growth 2024-2029 (%)
- Data Table on Middle East and Africa - Year-over-year growth 2024-2029 (%)
- 13.8 US - Market size and forecast 2024-2029
- Chart on US - Market size and forecast 2024-2029 ($ million)
- Data Table on US - Market size and forecast 2024-2029 ($ million)
- Chart on US - Year-over-year growth 2024-2029 (%)
- Data Table on US - Year-over-year growth 2024-2029 (%)
- 13.9 China - Market size and forecast 2024-2029
- Chart on China - Market size and forecast 2024-2029 ($ million)
- Data Table on China - Market size and forecast 2024-2029 ($ million)
- Chart on China - Year-over-year growth 2024-2029 (%)
- Data Table on China - Year-over-year growth 2024-2029 (%)
- 13.10 Sweden - Market size and forecast 2024-2029
- Chart on Sweden - Market size and forecast 2024-2029 ($ million)
- Data Table on Sweden - Market size and forecast 2024-2029 ($ million)
- Chart on Sweden - Year-over-year growth 2024-2029 (%)
- Data Table on Sweden - Year-over-year growth 2024-2029 (%)
- 13.11 Brazil - Market size and forecast 2024-2029
- Chart on Brazil - Market size and forecast 2024-2029 ($ million)
- Data Table on Brazil - Market size and forecast 2024-2029 ($ million)
- Chart on Brazil - Year-over-year growth 2024-2029 (%)
- Data Table on Brazil - Year-over-year growth 2024-2029 (%)
- 13.12 Finland - Market size and forecast 2024-2029
- Chart on Finland - Market size and forecast 2024-2029 ($ million)
- Data Table on Finland - Market size and forecast 2024-2029 ($ million)
- Chart on Finland - Year-over-year growth 2024-2029 (%)
- Data Table on Finland - Year-over-year growth 2024-2029 (%)
- 13.13 Canada - Market size and forecast 2024-2029
- Chart on Canada - Market size and forecast 2024-2029 ($ million)
- Data Table on Canada - Market size and forecast 2024-2029 ($ million)
- Chart on Canada - Year-over-year growth 2024-2029 (%)
- Data Table on Canada - Year-over-year growth 2024-2029 (%)
- 13.14 Austria - Market size and forecast 2024-2029
- Chart on Austria - Market size and forecast 2024-2029 ($ million)
- Data Table on Austria - Market size and forecast 2024-2029 ($ million)
- Chart on Austria - Year-over-year growth 2024-2029 (%)
- Data Table on Austria - Year-over-year growth 2024-2029 (%)
- 13.15 India - Market size and forecast 2024-2029
- Chart on India - Market size and forecast 2024-2029 ($ million)
- Data Table on India - Market size and forecast 2024-2029 ($ million)
- Chart on India - Year-over-year growth 2024-2029 (%)
- Data Table on India - Year-over-year growth 2024-2029 (%)
- 13.16 Germany - Market size and forecast 2024-2029
- Chart on Germany - Market size and forecast 2024-2029 ($ million)
- Data Table on Germany - Market size and forecast 2024-2029 ($ million)
- Chart on Germany - Year-over-year growth 2024-2029 (%)
- Data Table on Germany - Year-over-year growth 2024-2029 (%)
- 13.17 Japan - Market size and forecast 2024-2029
- Chart on Japan - Market size and forecast 2024-2029 ($ million)
- Data Table on Japan - Market size and forecast 2024-2029 ($ million)
- Chart on Japan - Year-over-year growth 2024-2029 (%)
- Data Table on Japan - Year-over-year growth 2024-2029 (%)
- 13.18 Market opportunity By Geographical Landscape
- Market opportunity By Geographical Landscape ($ million)
- Data Tables on Market opportunity By Geographical Landscape ($ million)
14 Drivers, Challenges, and Opportunity/Restraints
- 14.1 Market drivers
- 14.2 Market challenges
- 14.3 Impact of drivers and challenges
- Impact of drivers and challenges in 2024 and 2029
- 14.4 Market opportunities/restraints
15 Competitive Landscape
- 15.1 Overview
- 15.2 Competitive Landscape
- Overview on criticality of inputs and factors of differentiation
- 15.3 Landscape disruption
- Overview on factors of disruption
- 15.4 Industry risks
- Impact of key risks on business
16 Competitive Analysis
- 16.1 Companies profiled
- Companies covered
- 16.2 Company ranking index
- Company ranking index
- 16.3 Market positioning of companies
- Matrix on companies position and classification
- 16.4 Aditya Birla Management Corp. Pvt. Ltd.
- Aditya Birla Management Corp. Pvt. Ltd. - Overview
- Aditya Birla Management Corp. Pvt. Ltd. - Product / Service
- Aditya Birla Management Corp. Pvt. Ltd. - Key offerings
- SWOT
- 16.5 Amafhh Enterprises
- Amafhh Enterprises - Overview
- Amafhh Enterprises - Product / Service
- Amafhh Enterprises - Key offerings
- SWOT
- 16.6 Bracell
- Bracell - Overview
- Bracell - Product / Service
- Bracell - Key offerings
- SWOT
- 16.7 Fujian Qingshan Paper Industry Co Ltd.
- Fujian Qingshan Paper Industry Co Ltd. - Overview
- Fujian Qingshan Paper Industry Co Ltd. - Product / Service
- Fujian Qingshan Paper Industry Co Ltd. - Key offerings
- SWOT
- 16.8 Fulida Group Holding Co. Ltd.
- Fulida Group Holding Co. Ltd. - Overview
- Fulida Group Holding Co. Ltd. - Product / Service
- Fulida Group Holding Co. Ltd. - Key offerings
- SWOT
- 16.9 Lenzing AG
- Lenzing AG - Overview
- Lenzing AG - Business segments
- Lenzing AG - Key offerings
- Lenzing AG - Segment focus
- SWOT
- 16.10 Nippon Paper Industries Co. Ltd.
- Nippon Paper Industries Co. Ltd. - Overview
- Nippon Paper Industries Co. Ltd. - Business segments
- Nippon Paper Industries Co. Ltd. - Key news
- Nippon Paper Industries Co. Ltd. - Key offerings
- Nippon Paper Industries Co. Ltd. - Segment focus
- SWOT
- 16.11 RAG Innovations
- RAG Innovations - Overview
- RAG Innovations - Product / Service
- RAG Innovations - Key offerings
- SWOT
- 16.12 Rayonier Advanced Materials
- Rayonier Advanced Materials - Overview
- Rayonier Advanced Materials - Product / Service
- Rayonier Advanced Materials - Key offerings
- SWOT
- 16.13 Sappi Ltd.
- Sappi Ltd. - Overview
- Sappi Ltd. - Product / Service
- Sappi Ltd. - Key offerings
- SWOT
- 16.14 Shandong Sun Holdings Group
- Shandong Sun Holdings Group - Overview
- Shandong Sun Holdings Group - Product / Service
- Shandong Sun Holdings Group - Key offerings
- SWOT
- 16.15 Siam Cement PCL
- Siam Cement PCL - Overview
- Siam Cement PCL - Business segments
- Siam Cement PCL - Key offerings
- Siam Cement PCL - Segment focus
- SWOT
- 16.16 Yueyang Forest and Paper Co Ltd.
- Yueyang Forest and Paper Co Ltd. - Overview
- Yueyang Forest and Paper Co Ltd. - Product / Service
- Yueyang Forest and Paper Co Ltd. - Key offerings
- SWOT
17 Appendix
- 17.1 Scope of the report
- 17.2 Inclusions and exclusions checklist
- Inclusions checklist
- Exclusions checklist
- 17.3 Currency conversion rates for US$
- Currency conversion rates for US$
- 17.4 Research methodology
- Research methodology
- 17.5 Data procurement
- Information sources
- 17.6 Data validation
- Data validation
- 17.7 Validation techniques employed for market sizing
- Validation techniques employed for market sizing
- 17.8 Data synthesis
- Data synthesis
- 17.9 360 degree market analysis
- 360 degree market analysis
- 17.10 List of abbreviations
- List of abbreviations

