|
|
市場調査レポート
商品コード
1645652
プロジェクターの世界市場 2025~2029年Global Projector Market 2025-2029 |
||||||

|
|||||||
カスタマイズ可能
|
|||||||


| プロジェクターの世界市場 2025~2029年 |
|
出版日: 2025年01月16日
発行: TechNavio
ページ情報: 英文 204 Pages
納期: 即納可能
|

全表示
- 概要
- 図表
- 目次
プロジェクター市場は2024~2029年に47億8,940万米ドル、予測期間中のCAGRは5.1%で成長すると予測されます。
この調査レポートは、プロジェクター市場の全体分析、市場規模・予測、動向、成長促進要因、課題、約25のベンダーを網羅したベンダー分析などを掲載しています。
現在の市場シナリオ、最新動向と促進要因、市場環境全体に関する最新分析を提供しています。市場は、エンターテインメント産業におけるプロジェクター導入の増加、教育セグメントでのデジタル化の進展、企業セグメントでのプロジェクター利用の台頭などが牽引しています。
| 市場範囲 | |
|---|---|
| 基準年 | 2025年 |
| 終了年 | 2029年 |
| 予測期間 | 2025~2029年 |
| 成長モメンタム | 加速 |
| 前年比[2025年] | 4.7% |
| CAGR | 5.1% |
| 増分額 | 47億8,940万米ドル |
本調査では、今後数年間のプロジェクター市場成長を牽引する主要要因の1つとして、インタラクティブプロジェクターの採用を挙げています。また、超短焦点プロジェクタの人気の高まりと民生用電子機器の需要増加が、市場の大きな需要につながります。
目次
第1章 エグゼクティブサマリー
- 市場概要
第2章 Technavio分析
- 価格・ライフサイクル・顧客購入バスケット・採用率・購入基準の分析
- インプットの重要性と差別化の要因
- 混乱の要因
- 促進要因と課題の影響
第3章 市場情勢
- 市場エコシステム
- 市場の特徴
- バリューチェーン分析
第4章 市場規模
- 市場の定義
- 市場セグメント分析
- 市場規模 2024年
- 市場の展望 2024~2029年
第5章 市場規模実績
- プロジェクターの世界市場 2019~2023年
- 技術別セグメント分析 2019~2023年
- タイプ別セグメント分析 2019~2023年
- 地域別セグメント分析 2019~2023年
- 国別セグメント分析 2019~2023年
第6章 定性分析
- AIの影響:プロジェクターの世界市場
第7章 ファイブフォース分析
- ファイブフォースの要約
- 買い手の交渉力
- 供給企業の交渉力
- 新規参入業者の脅威
- 代替品の脅威
- 競争の脅威
- 市況
第8章 市場セグメンテーション:技術別
- 市場セグメント
- 比較:技術別
- LCD:市場規模と予測 2024~2029年
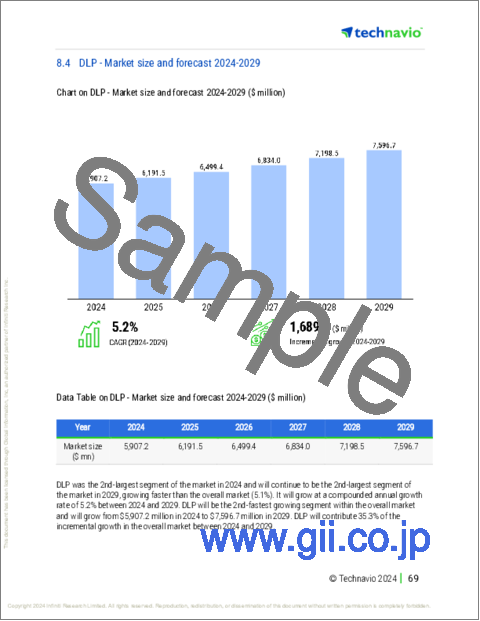
- DLP:市場規模と予測 2024~2029年
- LCoS:市場規模と予測 2024~2029年
- 市場機会:技術別
第9章 市場セグメンテーション:タイプ別
- 市場セグメント
- 比較:タイプ別
- 短距離:市場規模と予測 2024~2029年
- 超短距離:市場規模と予測 2024~2029年
- 普通距離:市場規模と予測 2024~2029年
- 市場機会:タイプ別
第10章 顧客情勢
- 顧客情勢概要
第11章 地域別情勢
- 地域別セグメンテーション
- 比較:地域別
- アジア太平洋:市場規模と予測 2024~2029年
- 欧州:市場規模と予測 2024~2029年
- 北米:市場規模と予測 2024~2029年
- 南米:市場規模と予測 2024~2029年
- 中東・アフリカ:市場規模と予測 2024~2029年
- 米国:市場規模と予測 2024~2029年
- 中国:市場規模と予測 2024~2029年
- ドイツ:市場規模と予測 2024~2029年
- 英国:市場規模と予測 2024~2029年
- 日本:市場規模と予測 2024~2029年
- フランス:市場規模と予測 2024~2029年
- インド:市場規模と予測 2024~2029年
- カナダ:市場規模と予測 2024~2029年
- ブラジル:市場規模と予測 2024~2029年
- サウジアラビア:市場規模と予測 2024~2029年
- 地域情勢による市場機会
第12章 促進要因・課題・機会・抑制要因
- 市場促進要因
- 市場課題
- 促進要因と課題の影響
- 市場機会・抑制要因
第13章 競合情勢
- 概要
- 競合情勢
- 混乱の状況
- 産業のリスク
第14章 競合分析
- 企業プロファイル
- 企業ランキング指数
- 企業の市場ポジショニング
- AAXA Technologies Inc.
- Acer Inc.
- ASUSTeK Computer Inc.
- Canon Inc.
- Hitachi Ltd.
- InFocus
- JVCKENWOOD Corp.
- Koninklijke Philips NV
- Lenovo Group Ltd.
- LG Corp.
- Magnasonic
- Qisda Corp.
- Samsung Electronics Co. Ltd.
- Sony Group Corp.
- YABER
第15章 付録
Exhibits:
- Exhibits1: Executive Summary - Chart on Market Overview
- Exhibits2: Executive Summary - Data Table on Market Overview
- Exhibits3: Executive Summary - Chart on Global Market Characteristics
- Exhibits4: Executive Summary - Chart on Market By Geographical Landscape
- Exhibits5: Executive Summary - Chart on Market Segmentation by Technology
- Exhibits6: Executive Summary - Chart on Market Segmentation by Type
- Exhibits7: Executive Summary - Chart on Incremental Growth
- Exhibits8: Executive Summary - Data Table on Incremental Growth
- Exhibits9: Executive Summary - Chart on Company Market Positioning
- Exhibits10: Analysis of price sensitivity, lifecycle, customer purchase basket, adoption rates, and purchase criteria
- Exhibits11: Overview on criticality of inputs and factors of differentiation
- Exhibits12: Overview on factors of disruption
- Exhibits13: Impact of drivers and challenges in 2024 and 2029
- Exhibits14: Parent Market
- Exhibits15: Data Table on - Parent Market
- Exhibits16: Market characteristics analysis
- Exhibits17: Value chain analysis
- Exhibits18: Offerings of companies included in the market definition
- Exhibits19: Market segments
- Exhibits20: Chart on Global - Market size and forecast 2024-2029 ($ million)
- Exhibits21: Data Table on Global - Market size and forecast 2024-2029 ($ million)
- Exhibits22: Chart on Global Market: Year-over-year growth 2024-2029 (%)
- Exhibits23: Data Table on Global Market: Year-over-year growth 2024-2029 (%)
- Exhibits24: Historic Market Size - Data Table on Global Projector Market 2019 - 2023 ($ million)
- Exhibits25: Historic Market Size - Technology Segment 2019 - 2023 ($ million)
- Exhibits26: Historic Market Size - Type Segment 2019 - 2023 ($ million)
- Exhibits27: Historic Market Size - Geography Segment 2019 - 2023 ($ million)
- Exhibits28: Historic Market Size - Country Segment 2019 - 2023 ($ million)
- Exhibits29: Five forces analysis - Comparison between 2024 and 2029
- Exhibits30: Bargaining power of buyers - Impact of key factors 2024 and 2029
- Exhibits31: Bargaining power of suppliers - Impact of key factors in 2024 and 2029
- Exhibits32: Threat of new entrants - Impact of key factors in 2024 and 2029
- Exhibits33: Threat of substitutes - Impact of key factors in 2024 and 2029
- Exhibits34: Threat of rivalry - Impact of key factors in 2024 and 2029
- Exhibits35: Chart on Market condition - Five forces 2024 and 2029
- Exhibits36: Chart on Technology - Market share 2024-2029 (%)
- Exhibits37: Data Table on Technology - Market share 2024-2029 (%)
- Exhibits38: Chart on Comparison by Technology
- Exhibits39: Data Table on Comparison by Technology
- Exhibits40: Chart on LCD - Market size and forecast 2024-2029 ($ million)
- Exhibits41: Data Table on LCD - Market size and forecast 2024-2029 ($ million)
- Exhibits42: Chart on LCD - Year-over-year growth 2024-2029 (%)
- Exhibits43: Data Table on LCD - Year-over-year growth 2024-2029 (%)
- Exhibits44: Chart on DLP - Market size and forecast 2024-2029 ($ million)
- Exhibits45: Data Table on DLP - Market size and forecast 2024-2029 ($ million)
- Exhibits46: Chart on DLP - Year-over-year growth 2024-2029 (%)
- Exhibits47: Data Table on DLP - Year-over-year growth 2024-2029 (%)
- Exhibits48: Chart on LCoS - Market size and forecast 2024-2029 ($ million)
- Exhibits49: Data Table on LCoS - Market size and forecast 2024-2029 ($ million)
- Exhibits50: Chart on LCoS - Year-over-year growth 2024-2029 (%)
- Exhibits51: Data Table on LCoS - Year-over-year growth 2024-2029 (%)
- Exhibits52: Market opportunity by Technology ($ million)
- Exhibits53: Data Table on Market opportunity by Technology ($ million)
- Exhibits54: Chart on Type - Market share 2024-2029 (%)
- Exhibits55: Data Table on Type - Market share 2024-2029 (%)
- Exhibits56: Chart on Comparison by Type
- Exhibits57: Data Table on Comparison by Type
- Exhibits58: Chart on Short - Market size and forecast 2024-2029 ($ million)
- Exhibits59: Data Table on Short - Market size and forecast 2024-2029 ($ million)
- Exhibits60: Chart on Short - Year-over-year growth 2024-2029 (%)
- Exhibits61: Data Table on Short - Year-over-year growth 2024-2029 (%)
- Exhibits62: Chart on Ultra short - Market size and forecast 2024-2029 ($ million)
- Exhibits63: Data Table on Ultra short - Market size and forecast 2024-2029 ($ million)
- Exhibits64: Chart on Ultra short - Year-over-year growth 2024-2029 (%)
- Exhibits65: Data Table on Ultra short - Year-over-year growth 2024-2029 (%)
- Exhibits66: Chart on Normal - Market size and forecast 2024-2029 ($ million)
- Exhibits67: Data Table on Normal - Market size and forecast 2024-2029 ($ million)
- Exhibits68: Chart on Normal - Year-over-year growth 2024-2029 (%)
- Exhibits69: Data Table on Normal - Year-over-year growth 2024-2029 (%)
- Exhibits70: Market opportunity by Type ($ million)
- Exhibits71: Data Table on Market opportunity by Type ($ million)
- Exhibits72: Analysis of price sensitivity, lifecycle, customer purchase basket, adoption rates, and purchase criteria
- Exhibits73: Chart on Market share By Geographical Landscape 2024-2029 (%)
- Exhibits74: Data Table on Market share By Geographical Landscape 2024-2029 (%)
- Exhibits75: Chart on Geographic comparison
- Exhibits76: Data Table on Geographic comparison
- Exhibits77: Chart on APAC - Market size and forecast 2024-2029 ($ million)
- Exhibits78: Data Table on APAC - Market size and forecast 2024-2029 ($ million)
- Exhibits79: Chart on APAC - Year-over-year growth 2024-2029 (%)
- Exhibits80: Data Table on APAC - Year-over-year growth 2024-2029 (%)
- Exhibits81: Chart on Europe - Market size and forecast 2024-2029 ($ million)
- Exhibits82: Data Table on Europe - Market size and forecast 2024-2029 ($ million)
- Exhibits83: Chart on Europe - Year-over-year growth 2024-2029 (%)
- Exhibits84: Data Table on Europe - Year-over-year growth 2024-2029 (%)
- Exhibits85: Chart on North America - Market size and forecast 2024-2029 ($ million)
- Exhibits86: Data Table on North America - Market size and forecast 2024-2029 ($ million)
- Exhibits87: Chart on North America - Year-over-year growth 2024-2029 (%)
- Exhibits88: Data Table on North America - Year-over-year growth 2024-2029 (%)
- Exhibits89: Chart on South America - Market size and forecast 2024-2029 ($ million)
- Exhibits90: Data Table on South America - Market size and forecast 2024-2029 ($ million)
- Exhibits91: Chart on South America - Year-over-year growth 2024-2029 (%)
- Exhibits92: Data Table on South America - Year-over-year growth 2024-2029 (%)
- Exhibits93: Chart on Middle East and Africa - Market size and forecast 2024-2029 ($ million)
- Exhibits94: Data Table on Middle East and Africa - Market size and forecast 2024-2029 ($ million)
- Exhibits95: Chart on Middle East and Africa - Year-over-year growth 2024-2029 (%)
- Exhibits96: Data Table on Middle East and Africa - Year-over-year growth 2024-2029 (%)
- Exhibits97: Chart on US - Market size and forecast 2024-2029 ($ million)
- Exhibits98: Data Table on US - Market size and forecast 2024-2029 ($ million)
- Exhibits99: Chart on US - Year-over-year growth 2024-2029 (%)
- Exhibits100: Data Table on US - Year-over-year growth 2024-2029 (%)
- Exhibits101: Chart on China - Market size and forecast 2024-2029 ($ million)
- Exhibits102: Data Table on China - Market size and forecast 2024-2029 ($ million)
- Exhibits103: Chart on China - Year-over-year growth 2024-2029 (%)
- Exhibits104: Data Table on China - Year-over-year growth 2024-2029 (%)
- Exhibits105: Chart on Germany - Market size and forecast 2024-2029 ($ million)
- Exhibits106: Data Table on Germany - Market size and forecast 2024-2029 ($ million)
- Exhibits107: Chart on Germany - Year-over-year growth 2024-2029 (%)
- Exhibits108: Data Table on Germany - Year-over-year growth 2024-2029 (%)
- Exhibits109: Chart on UK - Market size and forecast 2024-2029 ($ million)
- Exhibits110: Data Table on UK - Market size and forecast 2024-2029 ($ million)
- Exhibits111: Chart on UK - Year-over-year growth 2024-2029 (%)
- Exhibits112: Data Table on UK - Year-over-year growth 2024-2029 (%)
- Exhibits113: Chart on Japan - Market size and forecast 2024-2029 ($ million)
- Exhibits114: Data Table on Japan - Market size and forecast 2024-2029 ($ million)
- Exhibits115: Chart on Japan - Year-over-year growth 2024-2029 (%)
- Exhibits116: Data Table on Japan - Year-over-year growth 2024-2029 (%)
- Exhibits117: Chart on France - Market size and forecast 2024-2029 ($ million)
- Exhibits118: Data Table on France - Market size and forecast 2024-2029 ($ million)
- Exhibits119: Chart on France - Year-over-year growth 2024-2029 (%)
- Exhibits120: Data Table on France - Year-over-year growth 2024-2029 (%)
- Exhibits121: Chart on India - Market size and forecast 2024-2029 ($ million)
- Exhibits122: Data Table on India - Market size and forecast 2024-2029 ($ million)
- Exhibits123: Chart on India - Year-over-year growth 2024-2029 (%)
- Exhibits124: Data Table on India - Year-over-year growth 2024-2029 (%)
- Exhibits125: Chart on Canada - Market size and forecast 2024-2029 ($ million)
- Exhibits126: Data Table on Canada - Market size and forecast 2024-2029 ($ million)
- Exhibits127: Chart on Canada - Year-over-year growth 2024-2029 (%)
- Exhibits128: Data Table on Canada - Year-over-year growth 2024-2029 (%)
- Exhibits129: Chart on Brazil - Market size and forecast 2024-2029 ($ million)
- Exhibits130: Data Table on Brazil - Market size and forecast 2024-2029 ($ million)
- Exhibits131: Chart on Brazil - Year-over-year growth 2024-2029 (%)
- Exhibits132: Data Table on Brazil - Year-over-year growth 2024-2029 (%)
- Exhibits133: Chart on Saudi Arabia - Market size and forecast 2024-2029 ($ million)
- Exhibits134: Data Table on Saudi Arabia - Market size and forecast 2024-2029 ($ million)
- Exhibits135: Chart on Saudi Arabia - Year-over-year growth 2024-2029 (%)
- Exhibits136: Data Table on Saudi Arabia - Year-over-year growth 2024-2029 (%)
- Exhibits137: Market opportunity By Geographical Landscape ($ million)
- Exhibits138: Data Tables on Market opportunity By Geographical Landscape ($ million)
- Exhibits139: Impact of drivers and challenges in 2024 and 2029
- Exhibits140: Overview on criticality of inputs and factors of differentiation
- Exhibits141: Overview on factors of disruption
- Exhibits142: Impact of key risks on business
- Exhibits143: Companies covered
- Exhibits144: Company ranking index
- Exhibits145: Matrix on companies position and classification
- Exhibits146: AAXA Technologies Inc. - Overview
- Exhibits147: AAXA Technologies Inc. - Product / Service
- Exhibits148: AAXA Technologies Inc. - Key offerings
- Exhibits149: SWOT
- Exhibits150: Acer Inc. - Overview
- Exhibits151: Acer Inc. - Business segments
- Exhibits152: Acer Inc. - Key news
- Exhibits153: Acer Inc. - Key offerings
- Exhibits154: Acer Inc. - Segment focus
- Exhibits155: SWOT
- Exhibits156: ASUSTeK Computer Inc. - Overview
- Exhibits157: ASUSTeK Computer Inc. - Product / Service
- Exhibits158: ASUSTeK Computer Inc. - Key news
- Exhibits159: ASUSTeK Computer Inc. - Key offerings
- Exhibits160: SWOT
- Exhibits161: Canon Inc. - Overview
- Exhibits162: Canon Inc. - Business segments
- Exhibits163: Canon Inc. - Key news
- Exhibits164: Canon Inc. - Key offerings
- Exhibits165: Canon Inc. - Segment focus
- Exhibits166: SWOT
- Exhibits167: Hitachi Ltd. - Overview
- Exhibits168: Hitachi Ltd. - Business segments
- Exhibits169: Hitachi Ltd. - Key news
- Exhibits170: Hitachi Ltd. - Key offerings
- Exhibits171: Hitachi Ltd. - Segment focus
- Exhibits172: SWOT
- Exhibits173: InFocus - Overview
- Exhibits174: InFocus - Product / Service
- Exhibits175: InFocus - Key offerings
- Exhibits176: SWOT
- Exhibits177: JVCKENWOOD Corp. - Overview
- Exhibits178: JVCKENWOOD Corp. - Business segments
- Exhibits179: JVCKENWOOD Corp. - Key news
- Exhibits180: JVCKENWOOD Corp. - Key offerings
- Exhibits181: JVCKENWOOD Corp. - Segment focus
- Exhibits182: SWOT
- Exhibits183: Koninklijke Philips NV - Overview
- Exhibits184: Koninklijke Philips NV - Business segments
- Exhibits185: Koninklijke Philips NV - Key news
- Exhibits186: Koninklijke Philips NV - Key offerings
- Exhibits187: Koninklijke Philips NV - Segment focus
- Exhibits188: SWOT
- Exhibits189: Lenovo Group Ltd. - Overview
- Exhibits190: Lenovo Group Ltd. - Business segments
- Exhibits191: Lenovo Group Ltd. - Key news
- Exhibits192: Lenovo Group Ltd. - Key offerings
- Exhibits193: Lenovo Group Ltd. - Segment focus
- Exhibits194: SWOT
- Exhibits195: LG Corp. - Overview
- Exhibits196: LG Corp. - Product / Service
- Exhibits197: LG Corp. - Key offerings
- Exhibits198: SWOT
- Exhibits199: Magnasonic - Overview
- Exhibits200: Magnasonic - Product / Service
- Exhibits201: Magnasonic - Key offerings
- Exhibits202: SWOT
- Exhibits203: Qisda Corp. - Overview
- Exhibits204: Qisda Corp. - Product / Service
- Exhibits205: Qisda Corp. - Key offerings
- Exhibits206: SWOT
- Exhibits207: Samsung Electronics Co. Ltd. - Overview
- Exhibits208: Samsung Electronics Co. Ltd. - Business segments
- Exhibits209: Samsung Electronics Co. Ltd. - Key news
- Exhibits210: Samsung Electronics Co. Ltd. - Key offerings
- Exhibits211: Samsung Electronics Co. Ltd. - Segment focus
- Exhibits212: SWOT
- Exhibits213: Sony Group Corp. - Overview
- Exhibits214: Sony Group Corp. - Business segments
- Exhibits215: Sony Group Corp. - Key news
- Exhibits216: Sony Group Corp. - Key offerings
- Exhibits217: Sony Group Corp. - Segment focus
- Exhibits218: SWOT
- Exhibits219: YABER - Overview
- Exhibits220: YABER - Product / Service
- Exhibits221: YABER - Key offerings
- Exhibits222: SWOT
- Exhibits223: Inclusions checklist
- Exhibits224: Exclusions checklist
- Exhibits225: Currency conversion rates for US$
- Exhibits226: Research methodology
- Exhibits227: Information sources
- Exhibits228: Data validation
- Exhibits229: Validation techniques employed for market sizing
- Exhibits230: Data synthesis
- Exhibits231: 360 degree market analysis
- Exhibits232: List of abbreviations
The projector market is forecasted to grow by USD 4789.4 mn during 2024-2029, accelerating at a CAGR of 5.1% during the forecast period. The report on the projector market provides a holistic analysis, market size and forecast, trends, growth drivers, and challenges, as well as vendor analysis covering around 25 vendors.
The report offers an up-to-date analysis regarding the current market scenario, the latest trends and drivers, and the overall market environment. The market is driven by increasing adoption of projectors in entertainment industry, growing digitization in education sector, and emerging use of projectors in corporate sector.
| Market Scope | |
|---|---|
| Base Year | 2025 |
| End Year | 2029 |
| Series Year | 2025-2029 |
| Growth Momentum | Accelerate |
| YOY 2025 | 4.7% |
| CAGR | 5.1% |
| Incremental Value | $4789.4 mn |
Technavio's projector market is segmented as below:
By Technology
- LCD
- DLP
- LCoS
By Type
- Short
- Ultra short
- Normal
By Geographical Landscape
- APAC
- Europe
- North America
- South America
- Middle East and Africa
This study identifies the introduction of interactive projectors as one of the prime reasons driving the projector market growth during the next few years. Also, growing popularity of ultra short-throw projectors and rise in demand for consumer electronics will lead to sizable demand in the market.
The report on the projector market covers the following areas:
- Projector Market sizing
- Projector Market forecast
- Projector Market industry analysis
The robust vendor analysis is designed to help clients improve their market position, and in line with this, this report provides a detailed analysis of several leading projector market vendors that include AAXA Technologies Inc., Acer Inc., ASUSTeK Computer Inc., Canon Inc., Hitachi Ltd., InFocus, JVCKENWOOD Corp., Koninklijke Philips NV, Lenovo Group Ltd., LG Corp., Magnasonic, MicroVision Inc., Qisda Corp., Samsung Electronics Co. Ltd., Seiko Epson Corp., Shenzhen Hotack Technology Co.Ltd., Sony Group Corp., Texas Instruments Inc., ViewSonic Corp., and YABER. Also, the projector market analysis report includes information on upcoming trends and challenges that will influence market growth. This is to help companies strategize and leverage all forthcoming growth opportunities.
The study was conducted using an objective combination of primary and secondary information including inputs from key participants in the industry. The report contains a comprehensive market and vendor landscape in addition to an analysis of the key vendors.
The publisher presents a detailed picture of the market by the way of study, synthesis, and summation of data from multiple sources by an analysis of key parameters such as profit, pricing, competition, and promotions. It presents various market facets by identifying the key industry influencers. The data presented is comprehensive, reliable, and a result of extensive primary and secondary research. The market research reports provide a complete competitive landscape and an in-depth vendor selection methodology and analysis using qualitative and quantitative research to forecast accurate market growth.
Table of Contents
1 Executive Summary
- 1.1 Market overview
- Executive Summary - Chart on Market Overview
- Executive Summary - Data Table on Market Overview
- Executive Summary - Chart on Global Market Characteristics
- Executive Summary - Chart on Market By Geographical Landscape
- Executive Summary - Chart on Market Segmentation by Technology
- Executive Summary - Chart on Market Segmentation by Type
- Executive Summary - Chart on Incremental Growth
- Executive Summary - Data Table on Incremental Growth
- Executive Summary - Chart on Company Market Positioning
2 Technavio Analysis
- 2.1 Analysis of price sensitivity, lifecycle, customer purchase basket, adoption rates, and purchase criteria
- Analysis of price sensitivity, lifecycle, customer purchase basket, adoption rates, and purchase criteria
- 2.2 Criticality of inputs and Factors of differentiation
- Overview on criticality of inputs and factors of differentiation
- 2.3 Factors of disruption
- Overview on factors of disruption
- 2.4 Impact of drivers and challenges
- Impact of drivers and challenges in 2024 and 2029
3 Market Landscape
- 3.1 Market ecosystem
- Parent Market
- Data Table on - Parent Market
- 3.2 Market characteristics
- Market characteristics analysis
- 3.3 Value chain analysis
- Value chain analysis
4 Market Sizing
- 4.1 Market definition
- Offerings of companies included in the market definition
- 4.2 Market segment analysis
- Market segments
- 4.3 Market size 2024
- 4.4 Market outlook: Forecast for 2024-2029
- Chart on Global - Market size and forecast 2024-2029 ($ million)
- Data Table on Global - Market size and forecast 2024-2029 ($ million)
- Chart on Global Market: Year-over-year growth 2024-2029 (%)
- Data Table on Global Market: Year-over-year growth 2024-2029 (%)
5 Historic Market Size
- 5.1 Global Projector Market 2019 - 2023
- Historic Market Size - Data Table on Global Projector Market 2019 - 2023 ($ million)
- 5.2 Technology segment analysis 2019 - 2023
- Historic Market Size - Technology Segment 2019 - 2023 ($ million)
- 5.3 Type segment analysis 2019 - 2023
- Historic Market Size - Type Segment 2019 - 2023 ($ million)
- 5.4 Geography segment analysis 2019 - 2023
- Historic Market Size - Geography Segment 2019 - 2023 ($ million)
- 5.5 Country segment analysis 2019 - 2023
- Historic Market Size - Country Segment 2019 - 2023 ($ million)
6 Qualitative Analysis
- 6.1 The AI impact on Global Projector Market
7 Five Forces Analysis
- 7.1 Five forces summary
- Five forces analysis - Comparison between 2024 and 2029
- 7.2 Bargaining power of buyers
- Bargaining power of buyers - Impact of key factors 2024 and 2029
- 7.3 Bargaining power of suppliers
- Bargaining power of suppliers - Impact of key factors in 2024 and 2029
- 7.4 Threat of new entrants
- Threat of new entrants - Impact of key factors in 2024 and 2029
- 7.5 Threat of substitutes
- Threat of substitutes - Impact of key factors in 2024 and 2029
- 7.6 Threat of rivalry
- Threat of rivalry - Impact of key factors in 2024 and 2029
- 7.7 Market condition
- Chart on Market condition - Five forces 2024 and 2029
8 Market Segmentation by Technology
- 8.1 Market segments
- Chart on Technology - Market share 2024-2029 (%)
- Data Table on Technology - Market share 2024-2029 (%)
- 8.2 Comparison by Technology
- Chart on Comparison by Technology
- Data Table on Comparison by Technology
- 8.3 LCD - Market size and forecast 2024-2029
- Chart on LCD - Market size and forecast 2024-2029 ($ million)
- Data Table on LCD - Market size and forecast 2024-2029 ($ million)
- Chart on LCD - Year-over-year growth 2024-2029 (%)
- Data Table on LCD - Year-over-year growth 2024-2029 (%)
- 8.4 DLP - Market size and forecast 2024-2029
- Chart on DLP - Market size and forecast 2024-2029 ($ million)
- Data Table on DLP - Market size and forecast 2024-2029 ($ million)
- Chart on DLP - Year-over-year growth 2024-2029 (%)
- Data Table on DLP - Year-over-year growth 2024-2029 (%)
- 8.5 LCoS - Market size and forecast 2024-2029
- Chart on LCoS - Market size and forecast 2024-2029 ($ million)
- Data Table on LCoS - Market size and forecast 2024-2029 ($ million)
- Chart on LCoS - Year-over-year growth 2024-2029 (%)
- Data Table on LCoS - Year-over-year growth 2024-2029 (%)
- 8.6 Market opportunity by Technology
- Market opportunity by Technology ($ million)
- Data Table on Market opportunity by Technology ($ million)
9 Market Segmentation by Type
- 9.1 Market segments
- Chart on Type - Market share 2024-2029 (%)
- Data Table on Type - Market share 2024-2029 (%)
- 9.2 Comparison by Type
- Chart on Comparison by Type
- Data Table on Comparison by Type
- 9.3 Short - Market size and forecast 2024-2029
- Chart on Short - Market size and forecast 2024-2029 ($ million)
- Data Table on Short - Market size and forecast 2024-2029 ($ million)
- Chart on Short - Year-over-year growth 2024-2029 (%)
- Data Table on Short - Year-over-year growth 2024-2029 (%)
- 9.4 Ultra short - Market size and forecast 2024-2029
- Chart on Ultra short - Market size and forecast 2024-2029 ($ million)
- Data Table on Ultra short - Market size and forecast 2024-2029 ($ million)
- Chart on Ultra short - Year-over-year growth 2024-2029 (%)
- Data Table on Ultra short - Year-over-year growth 2024-2029 (%)
- 9.5 Normal - Market size and forecast 2024-2029
- Chart on Normal - Market size and forecast 2024-2029 ($ million)
- Data Table on Normal - Market size and forecast 2024-2029 ($ million)
- Chart on Normal - Year-over-year growth 2024-2029 (%)
- Data Table on Normal - Year-over-year growth 2024-2029 (%)
- 9.6 Market opportunity by Type
- Market opportunity by Type ($ million)
- Data Table on Market opportunity by Type ($ million)
10 Customer Landscape
- 10.1 Customer landscape overview
- Analysis of price sensitivity, lifecycle, customer purchase basket, adoption rates, and purchase criteria
11 Geographic Landscape
- 11.1 Geographic segmentation
- Chart on Market share By Geographical Landscape 2024-2029 (%)
- Data Table on Market share By Geographical Landscape 2024-2029 (%)
- 11.2 Geographic comparison
- Chart on Geographic comparison
- Data Table on Geographic comparison
- 11.3 APAC - Market size and forecast 2024-2029
- Chart on APAC - Market size and forecast 2024-2029 ($ million)
- Data Table on APAC - Market size and forecast 2024-2029 ($ million)
- Chart on APAC - Year-over-year growth 2024-2029 (%)
- Data Table on APAC - Year-over-year growth 2024-2029 (%)
- 11.4 Europe - Market size and forecast 2024-2029
- Chart on Europe - Market size and forecast 2024-2029 ($ million)
- Data Table on Europe - Market size and forecast 2024-2029 ($ million)
- Chart on Europe - Year-over-year growth 2024-2029 (%)
- Data Table on Europe - Year-over-year growth 2024-2029 (%)
- 11.5 North America - Market size and forecast 2024-2029
- Chart on North America - Market size and forecast 2024-2029 ($ million)
- Data Table on North America - Market size and forecast 2024-2029 ($ million)
- Chart on North America - Year-over-year growth 2024-2029 (%)
- Data Table on North America - Year-over-year growth 2024-2029 (%)
- 11.6 South America - Market size and forecast 2024-2029
- Chart on South America - Market size and forecast 2024-2029 ($ million)
- Data Table on South America - Market size and forecast 2024-2029 ($ million)
- Chart on South America - Year-over-year growth 2024-2029 (%)
- Data Table on South America - Year-over-year growth 2024-2029 (%)
- 11.7 Middle East and Africa - Market size and forecast 2024-2029
- Chart on Middle East and Africa - Market size and forecast 2024-2029 ($ million)
- Data Table on Middle East and Africa - Market size and forecast 2024-2029 ($ million)
- Chart on Middle East and Africa - Year-over-year growth 2024-2029 (%)
- Data Table on Middle East and Africa - Year-over-year growth 2024-2029 (%)
- 11.8 US - Market size and forecast 2024-2029
- Chart on US - Market size and forecast 2024-2029 ($ million)
- Data Table on US - Market size and forecast 2024-2029 ($ million)
- Chart on US - Year-over-year growth 2024-2029 (%)
- Data Table on US - Year-over-year growth 2024-2029 (%)
- 11.9 China - Market size and forecast 2024-2029
- Chart on China - Market size and forecast 2024-2029 ($ million)
- Data Table on China - Market size and forecast 2024-2029 ($ million)
- Chart on China - Year-over-year growth 2024-2029 (%)
- Data Table on China - Year-over-year growth 2024-2029 (%)
- 11.10 Germany - Market size and forecast 2024-2029
- Chart on Germany - Market size and forecast 2024-2029 ($ million)
- Data Table on Germany - Market size and forecast 2024-2029 ($ million)
- Chart on Germany - Year-over-year growth 2024-2029 (%)
- Data Table on Germany - Year-over-year growth 2024-2029 (%)
- 11.11 UK - Market size and forecast 2024-2029
- Chart on UK - Market size and forecast 2024-2029 ($ million)
- Data Table on UK - Market size and forecast 2024-2029 ($ million)
- Chart on UK - Year-over-year growth 2024-2029 (%)
- Data Table on UK - Year-over-year growth 2024-2029 (%)
- 11.12 Japan - Market size and forecast 2024-2029
- Chart on Japan - Market size and forecast 2024-2029 ($ million)
- Data Table on Japan - Market size and forecast 2024-2029 ($ million)
- Chart on Japan - Year-over-year growth 2024-2029 (%)
- Data Table on Japan - Year-over-year growth 2024-2029 (%)
- 11.13 France - Market size and forecast 2024-2029
- Chart on France - Market size and forecast 2024-2029 ($ million)
- Data Table on France - Market size and forecast 2024-2029 ($ million)
- Chart on France - Year-over-year growth 2024-2029 (%)
- Data Table on France - Year-over-year growth 2024-2029 (%)
- 11.14 India - Market size and forecast 2024-2029
- Chart on India - Market size and forecast 2024-2029 ($ million)
- Data Table on India - Market size and forecast 2024-2029 ($ million)
- Chart on India - Year-over-year growth 2024-2029 (%)
- Data Table on India - Year-over-year growth 2024-2029 (%)
- 11.15 Canada - Market size and forecast 2024-2029
- Chart on Canada - Market size and forecast 2024-2029 ($ million)
- Data Table on Canada - Market size and forecast 2024-2029 ($ million)
- Chart on Canada - Year-over-year growth 2024-2029 (%)
- Data Table on Canada - Year-over-year growth 2024-2029 (%)
- 11.16 Brazil - Market size and forecast 2024-2029
- Chart on Brazil - Market size and forecast 2024-2029 ($ million)
- Data Table on Brazil - Market size and forecast 2024-2029 ($ million)
- Chart on Brazil - Year-over-year growth 2024-2029 (%)
- Data Table on Brazil - Year-over-year growth 2024-2029 (%)
- 11.17 Saudi Arabia - Market size and forecast 2024-2029
- Chart on Saudi Arabia - Market size and forecast 2024-2029 ($ million)
- Data Table on Saudi Arabia - Market size and forecast 2024-2029 ($ million)
- Chart on Saudi Arabia - Year-over-year growth 2024-2029 (%)
- Data Table on Saudi Arabia - Year-over-year growth 2024-2029 (%)
- 11.18 Market opportunity By Geographical Landscape
- Market opportunity By Geographical Landscape ($ million)
- Data Tables on Market opportunity By Geographical Landscape ($ million)
12 Drivers, Challenges, and Opportunity/Restraints
- 12.1 Market drivers
- 12.2 Market challenges
- 12.3 Impact of drivers and challenges
- Impact of drivers and challenges in 2024 and 2029
- 12.4 Market opportunities/restraints
13 Competitive Landscape
- 13.1 Overview
- 13.2 Competitive Landscape
- Overview on criticality of inputs and factors of differentiation
- 13.3 Landscape disruption
- Overview on factors of disruption
- 13.4 Industry risks
- Impact of key risks on business
14 Competitive Analysis
- 14.1 Companies profiled
- Companies covered
- 14.2 Company ranking index
- Company ranking index
- 14.3 Market positioning of companies
- Matrix on companies position and classification
- 14.4 AAXA Technologies Inc.
- AAXA Technologies Inc. - Overview
- AAXA Technologies Inc. - Product / Service
- AAXA Technologies Inc. - Key offerings
- SWOT
- 14.5 Acer Inc.
- Acer Inc. - Overview
- Acer Inc. - Business segments
- Acer Inc. - Key news
- Acer Inc. - Key offerings
- Acer Inc. - Segment focus
- SWOT
- 14.6 ASUSTeK Computer Inc.
- ASUSTeK Computer Inc. - Overview
- ASUSTeK Computer Inc. - Product / Service
- ASUSTeK Computer Inc. - Key news
- ASUSTeK Computer Inc. - Key offerings
- SWOT
- 14.7 Canon Inc.
- Canon Inc. - Overview
- Canon Inc. - Business segments
- Canon Inc. - Key news
- Canon Inc. - Key offerings
- Canon Inc. - Segment focus
- SWOT
- 14.8 Hitachi Ltd.
- Hitachi Ltd. - Overview
- Hitachi Ltd. - Business segments
- Hitachi Ltd. - Key news
- Hitachi Ltd. - Key offerings
- Hitachi Ltd. - Segment focus
- SWOT
- 14.9 InFocus
- InFocus - Overview
- InFocus - Product / Service
- InFocus - Key offerings
- SWOT
- 14.10 JVCKENWOOD Corp.
- JVCKENWOOD Corp. - Overview
- JVCKENWOOD Corp. - Business segments
- JVCKENWOOD Corp. - Key news
- JVCKENWOOD Corp. - Key offerings
- JVCKENWOOD Corp. - Segment focus
- SWOT
- 14.11 Koninklijke Philips NV
- Koninklijke Philips NV - Overview
- Koninklijke Philips NV - Business segments
- Koninklijke Philips NV - Key news
- Koninklijke Philips NV - Key offerings
- Koninklijke Philips NV - Segment focus
- SWOT
- 14.12 Lenovo Group Ltd.
- Lenovo Group Ltd. - Overview
- Lenovo Group Ltd. - Business segments
- Lenovo Group Ltd. - Key news
- Lenovo Group Ltd. - Key offerings
- Lenovo Group Ltd. - Segment focus
- SWOT
- 14.13 LG Corp.
- LG Corp. - Overview
- LG Corp. - Product / Service
- LG Corp. - Key offerings
- SWOT
- 14.14 Magnasonic
- Magnasonic - Overview
- Magnasonic - Product / Service
- Magnasonic - Key offerings
- SWOT
- 14.15 Qisda Corp.
- Qisda Corp. - Overview
- Qisda Corp. - Product / Service
- Qisda Corp. - Key offerings
- SWOT
- 14.16 Samsung Electronics Co. Ltd.
- Samsung Electronics Co. Ltd. - Overview
- Samsung Electronics Co. Ltd. - Business segments
- Samsung Electronics Co. Ltd. - Key news
- Samsung Electronics Co. Ltd. - Key offerings
- Samsung Electronics Co. Ltd. - Segment focus
- SWOT
- 14.17 Sony Group Corp.
- Sony Group Corp. - Overview
- Sony Group Corp. - Business segments
- Sony Group Corp. - Key news
- Sony Group Corp. - Key offerings
- Sony Group Corp. - Segment focus
- SWOT
- 14.18 YABER
- YABER - Overview
- YABER - Product / Service
- YABER - Key offerings
- SWOT
15 Appendix
- 15.1 Scope of the report
- 15.2 Inclusions and exclusions checklist
- Inclusions checklist
- Exclusions checklist
- 15.3 Currency conversion rates for US$
- Currency conversion rates for US$
- 15.4 Research methodology
- Research methodology
- 15.5 Data procurement
- Information sources
- 15.6 Data validation
- Data validation
- 15.7 Validation techniques employed for market sizing
- Validation techniques employed for market sizing
- 15.8 Data synthesis
- Data synthesis
- 15.9 360 degree market analysis
- 360 degree market analysis
- 15.10 List of abbreviations
- List of abbreviations

