|
|
市場調査レポート
商品コード
1685027
装甲車の世界市場 2025-2029Global Armored Vehicles Market 2025-2029 |
||||||

|
|||||||
カスタマイズ可能
|
|||||||

| 装甲車の世界市場 2025-2029 |
|
出版日: 2025年03月06日
発行: TechNavio
ページ情報: 英文 234 Pages
納期: 即納可能
|

全表示
- 概要
- 図表
- 目次
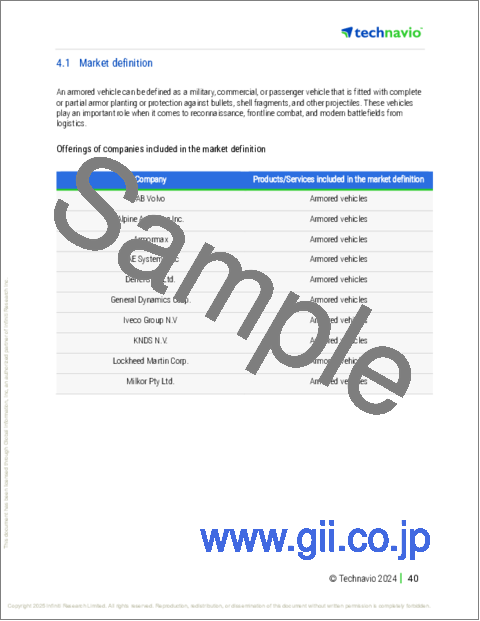
装甲車市場は、2024年から2029年にかけて83億1,680万米ドル成長し、予測期間中のCAGRは6.8%で成長すると予測されています。
当レポートでは、装甲車市場の全体的な分析、市場規模・予測、動向、成長促進要因、課題、約25のベンダーを網羅したベンダー分析などを掲載しています。
現在の市場シナリオ、最新動向と促進要因、市場環境全体に関する最新分析を提供しています。市場は、世界の非対称戦の勃発、新たな安全保障上の脅威に対抗するための防衛能力のアップグレード、MRAPにおけるハイブリッドドライブトレインの登場によって牽引されています。
| 市場範囲 | |
|---|---|
| 基準年 | 2025年 |
| 終了年 | 2029年 |
| 予測期間 | 2025年~2029年 |
| 成長モメンタム | 加速 |
| 前年比2025年 | 5.8% |
| CAGR | 6.8% |
| 増分額 | 83億1,680万米ドル |
本調査は、業界の主要参加者からのインプットを含め、一次情報と二次情報を客観的に組み合わせて実施しました。レポートには、主要企業の分析に加え、包括的な市場規模データ、地域分析によるセグメント、ベンダー情勢が含まれています。レポートには実績データと予測データがあります。
この調査レポートは、今後数年間の装甲車市場の成長を促進する主要な理由の一つとして、無人戦闘地上車両の採用増加を挙げています。また、指向性エネルギー兵器(DEW)と装甲車の統合やアクティブプロテクションシステム(APS)の出現は、市場の大きな需要につながると考えられています。
目次
第1章 エグゼクティブサマリー
- 市場概要
第2章 Technavio分析
- 価格反応性・ライフサイクル・顧客購入バスケット・採用率・購入基準の分析
- インプットの重要性と差別化の要因
- 混乱の要因
- 促進要因と課題の影響
第3章 市場情勢
- 市場エコシステム
- 市場の特徴
- バリューチェーン分析
第4章 市場規模
- 市場の定義
- 市場セグメント分析
- 市場規模、2024年
- 市場の見通し、2024年~2029年
第5章 市場規模実績
- 装甲車の世界市場、2019年~2023年
- モビリティタイプセグメント分析、2019年~2023年
- タイプセグメント分析、2019年~2023年
- 製品セグメント分析、2019年~2023年
- 用途セグメント分析、2019年~2023年
- 地域別セグメント分析、2019年~2023年
- 国別セグメント分析、2019年~2023年
第6章 定性分析
- AIの影響:装甲車の世界市場
第7章 ファイブフォース分析
- ファイブフォースの要約
- 買い手の交渉力
- 供給企業の交渉力
- 新規参入業者の脅威
- 代替品の脅威
- 競争の脅威
- 市況
第8章 市場セグメンテーション:モビリティタイプ別
- 市場セグメント
- 比較:モビリティタイプ別
- 車輪型:市場規模と予測、2024年~2029年
- 追跡型:市場規模と予測、2024年~2029年
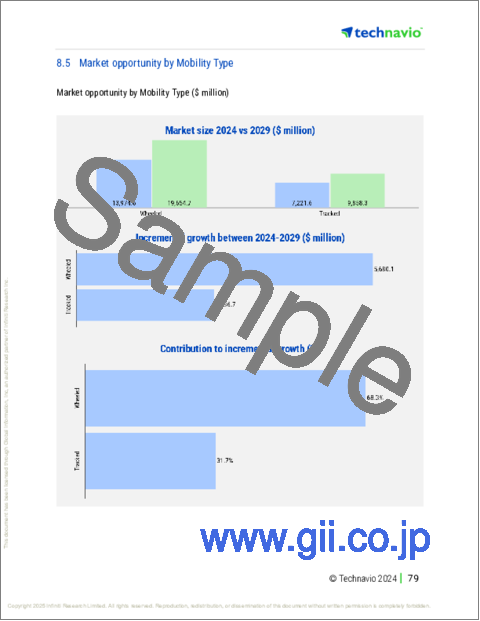
- 市場機会:モビリティタイプ別
第9章 市場セグメンテーション:タイプ別
- 市場セグメント
- 比較:タイプ別
- 従来型:市場規模と予測、2024年~2029年
- 電気:市場規模と予測、2024年~2029年
- 市場機会:タイプ別
第10章 市場セグメンテーション:製品別
- 市場セグメント
- 比較:製品別
- 有人装甲車:市場規模と予測、2024年~2029年
- 無人装甲車:市場規模と予測、2024年~2029年
- 市場機会:製品別
第11章 市場セグメンテーション:用途別
- 市場セグメント
- 比較:用途別
- 駆動システム:市場規模と予測、2024年~2029年
- 構造・メカニズム:市場規模と予測、2024年~2029年
- 武器・弾薬管理システム:市場規模と予測、2024年~2029年
- その他:市場規模と予測、2024年~2029年
- 市場機会:用途別
第12章 顧客情勢
- 顧客情勢の概要
第13章 地域別情勢
- 地域別セグメンテーション
- 地域別比較
- 北米:市場規模と予測、2024年~2029年
- 欧州:市場規模と予測、2024年~2029年
- アジア太平洋:市場規模と予測、2024年~2029年
- 南米:市場規模と予測、2024年~2029年
- 中東・アフリカ:市場規模と予測、2024年~2029年
- 米国:市場規模と予測、2024年~2029年
- 中国:市場規模と予測、2024年~2029年
- ドイツ:市場規模と予測、2024年~2029年
- カナダ:市場規模と予測、2024年~2029年
- 英国:市場規模と予測、2024年~2029年
- 日本:市場規模と予測、2024年~2029年
- フランス:市場規模と予測、2024年~2029年
- 韓国:市場規模と予測、2024年~2029年
- ブラジル:市場規模と予測、2024年~2029年
- インド:市場規模と予測、2024年~2029年
- 市場機会:地域情勢別
第14章 促進要因、課題、機会/抑制要因
- 市場促進要因
- 市場の課題
- 促進要因と課題の影響
- 市場の機会/抑制要因
第15章 競合情勢
- 概要
- 競合情勢
- 混乱の状況
- 業界のリスク
第16章 競合分析
- 企業プロファイル
- 企業ランキング指数
- 企業の市場ポジショニング
- AB Volvo
- Alpine Armoring Inc.
- Armormax
- BAE Systems Plc
- Denel SOC Ltd.
- General Dynamics Corp.
- Iveco Group N.V
- KNDS N.V.
- Lockheed Martin Corp.
- Milkor Pty Ltd.
- Oshkosh Corp.
- Rheinmetall AG
- Rostec
- Textron Inc.
- Traton SE
第17章 付録
Exhibits:
- Exhibits1: Executive Summary - Chart on Market Overview
- Exhibits2: Executive Summary - Data Table on Market Overview
- Exhibits3: Executive Summary - Chart on Global Market Characteristics
- Exhibits4: Executive Summary - Chart on Market By Geographical Landscape
- Exhibits5: Executive Summary - Chart on Market Segmentation by Mobility Type
- Exhibits6: Executive Summary - Chart on Market Segmentation by Type
- Exhibits7: Executive Summary - Chart on Market Segmentation by Product
- Exhibits8: Executive Summary - Chart on Market Segmentation by Application
- Exhibits9: Executive Summary - Chart on Incremental Growth
- Exhibits10: Executive Summary - Data Table on Incremental Growth
- Exhibits11: Executive Summary - Chart on Company Market Positioning
- Exhibits12: Analysis of price sensitivity, lifecycle, customer purchase basket, adoption rates, and purchase criteria
- Exhibits13: Overview on criticality of inputs and factors of differentiation
- Exhibits14: Overview on factors of disruption
- Exhibits15: Impact of drivers and challenges in 2024 and 2029
- Exhibits16: Parent Market
- Exhibits17: Data Table on - Parent Market
- Exhibits18: Market characteristics analysis
- Exhibits19: Value chain analysis
- Exhibits20: Offerings of companies included in the market definition
- Exhibits21: Market segments
- Exhibits22: Chart on Global - Market size and forecast 2024-2029 ($ million)
- Exhibits23: Data Table on Global - Market size and forecast 2024-2029 ($ million)
- Exhibits24: Chart on Global Market: Year-over-year growth 2024-2029 (%)
- Exhibits25: Data Table on Global Market: Year-over-year growth 2024-2029 (%)
- Exhibits26: Historic Market Size - Data Table on Global Armored Vehicles Market 2019 - 2023 ($ million)
- Exhibits27: Historic Market Size - Mobility Type Segment 2019 - 2023 ($ million)
- Exhibits28: Historic Market Size - Type Segment 2019 - 2023 ($ million)
- Exhibits29: Historic Market Size - Product Segment 2019 - 2023 ($ million)
- Exhibits30: Historic Market Size - Application Segment 2019 - 2023 ($ million)
- Exhibits31: Historic Market Size - Geography Segment 2019 - 2023 ($ million)
- Exhibits32: Historic Market Size - Country Segment 2019 - 2023 ($ million)
- Exhibits33: Five forces analysis - Comparison between 2024 and 2029
- Exhibits34: Bargaining power of buyers - Impact of key factors 2024 and 2029
- Exhibits35: Bargaining power of suppliers - Impact of key factors in 2024 and 2029
- Exhibits36: Threat of new entrants - Impact of key factors in 2024 and 2029
- Exhibits37: Threat of substitutes - Impact of key factors in 2024 and 2029
- Exhibits38: Threat of rivalry - Impact of key factors in 2024 and 2029
- Exhibits39: Chart on Market condition - Five forces 2024 and 2029
- Exhibits40: Chart on Mobility Type - Market share 2024-2029 (%)
- Exhibits41: Data Table on Mobility Type - Market share 2024-2029 (%)
- Exhibits42: Chart on Comparison by Mobility Type
- Exhibits43: Data Table on Comparison by Mobility Type
- Exhibits44: Chart on Wheeled - Market size and forecast 2024-2029 ($ million)
- Exhibits45: Data Table on Wheeled - Market size and forecast 2024-2029 ($ million)
- Exhibits46: Chart on Wheeled - Year-over-year growth 2024-2029 (%)
- Exhibits47: Data Table on Wheeled - Year-over-year growth 2024-2029 (%)
- Exhibits48: Chart on Tracked - Market size and forecast 2024-2029 ($ million)
- Exhibits49: Data Table on Tracked - Market size and forecast 2024-2029 ($ million)
- Exhibits50: Chart on Tracked - Year-over-year growth 2024-2029 (%)
- Exhibits51: Data Table on Tracked - Year-over-year growth 2024-2029 (%)
- Exhibits52: Market opportunity by Mobility Type ($ million)
- Exhibits53: Data Table on Market opportunity by Mobility Type ($ million)
- Exhibits54: Chart on Type - Market share 2024-2029 (%)
- Exhibits55: Data Table on Type - Market share 2024-2029 (%)
- Exhibits56: Chart on Comparison by Type
- Exhibits57: Data Table on Comparison by Type
- Exhibits58: Chart on Conventional - Market size and forecast 2024-2029 ($ million)
- Exhibits59: Data Table on Conventional - Market size and forecast 2024-2029 ($ million)
- Exhibits60: Chart on Conventional - Year-over-year growth 2024-2029 (%)
- Exhibits61: Data Table on Conventional - Year-over-year growth 2024-2029 (%)
- Exhibits62: Chart on Electric - Market size and forecast 2024-2029 ($ million)
- Exhibits63: Data Table on Electric - Market size and forecast 2024-2029 ($ million)
- Exhibits64: Chart on Electric - Year-over-year growth 2024-2029 (%)
- Exhibits65: Data Table on Electric - Year-over-year growth 2024-2029 (%)
- Exhibits66: Market opportunity by Type ($ million)
- Exhibits67: Data Table on Market opportunity by Type ($ million)
- Exhibits68: Chart on Product - Market share 2024-2029 (%)
- Exhibits69: Data Table on Product - Market share 2024-2029 (%)
- Exhibits70: Chart on Comparison by Product
- Exhibits71: Data Table on Comparison by Product
- Exhibits72: Chart on Manned armored vehicles - Market size and forecast 2024-2029 ($ million)
- Exhibits73: Data Table on Manned armored vehicles - Market size and forecast 2024-2029 ($ million)
- Exhibits74: Chart on Manned armored vehicles - Year-over-year growth 2024-2029 (%)
- Exhibits75: Data Table on Manned armored vehicles - Year-over-year growth 2024-2029 (%)
- Exhibits76: Chart on Unmanned armored vehicles - Market size and forecast 2024-2029 ($ million)
- Exhibits77: Data Table on Unmanned armored vehicles - Market size and forecast 2024-2029 ($ million)
- Exhibits78: Chart on Unmanned armored vehicles - Year-over-year growth 2024-2029 (%)
- Exhibits79: Data Table on Unmanned armored vehicles - Year-over-year growth 2024-2029 (%)
- Exhibits80: Market opportunity by Product ($ million)
- Exhibits81: Data Table on Market opportunity by Product ($ million)
- Exhibits82: Chart on Application - Market share 2024-2029 (%)
- Exhibits83: Data Table on Application - Market share 2024-2029 (%)
- Exhibits84: Chart on Comparison by Application
- Exhibits85: Data Table on Comparison by Application
- Exhibits86: Chart on Drive systems - Market size and forecast 2024-2029 ($ million)
- Exhibits87: Data Table on Drive systems - Market size and forecast 2024-2029 ($ million)
- Exhibits88: Chart on Drive systems - Year-over-year growth 2024-2029 (%)
- Exhibits89: Data Table on Drive systems - Year-over-year growth 2024-2029 (%)
- Exhibits90: Chart on Structures and mechanisms - Market size and forecast 2024-2029 ($ million)
- Exhibits91: Data Table on Structures and mechanisms - Market size and forecast 2024-2029 ($ million)
- Exhibits92: Chart on Structures and mechanisms - Year-over-year growth 2024-2029 (%)
- Exhibits93: Data Table on Structures and mechanisms - Year-over-year growth 2024-2029 (%)
- Exhibits94: Chart on Weapons and ammunition control systems - Market size and forecast 2024-2029 ($ million)
- Exhibits95: Data Table on Weapons and ammunition control systems - Market size and forecast 2024-2029 ($ million)
- Exhibits96: Chart on Weapons and ammunition control systems - Year-over-year growth 2024-2029 (%)
- Exhibits97: Data Table on Weapons and ammunition control systems - Year-over-year growth 2024-2029 (%)
- Exhibits98: Chart on Others - Market size and forecast 2024-2029 ($ million)
- Exhibits99: Data Table on Others - Market size and forecast 2024-2029 ($ million)
- Exhibits100: Chart on Others - Year-over-year growth 2024-2029 (%)
- Exhibits101: Data Table on Others - Year-over-year growth 2024-2029 (%)
- Exhibits102: Market opportunity by Application ($ million)
- Exhibits103: Data Table on Market opportunity by Application ($ million)
- Exhibits104: Analysis of price sensitivity, lifecycle, customer purchase basket, adoption rates, and purchase criteria
- Exhibits105: Chart on Market share By Geographical Landscape 2024-2029 (%)
- Exhibits106: Data Table on Market share By Geographical Landscape 2024-2029 (%)
- Exhibits107: Chart on Geographic comparison
- Exhibits108: Data Table on Geographic comparison
- Exhibits109: Chart on North America - Market size and forecast 2024-2029 ($ million)
- Exhibits110: Data Table on North America - Market size and forecast 2024-2029 ($ million)
- Exhibits111: Chart on North America - Year-over-year growth 2024-2029 (%)
- Exhibits112: Data Table on North America - Year-over-year growth 2024-2029 (%)
- Exhibits113: Chart on Europe - Market size and forecast 2024-2029 ($ million)
- Exhibits114: Data Table on Europe - Market size and forecast 2024-2029 ($ million)
- Exhibits115: Chart on Europe - Year-over-year growth 2024-2029 (%)
- Exhibits116: Data Table on Europe - Year-over-year growth 2024-2029 (%)
- Exhibits117: Chart on APAC - Market size and forecast 2024-2029 ($ million)
- Exhibits118: Data Table on APAC - Market size and forecast 2024-2029 ($ million)
- Exhibits119: Chart on APAC - Year-over-year growth 2024-2029 (%)
- Exhibits120: Data Table on APAC - Year-over-year growth 2024-2029 (%)
- Exhibits121: Chart on South America - Market size and forecast 2024-2029 ($ million)
- Exhibits122: Data Table on South America - Market size and forecast 2024-2029 ($ million)
- Exhibits123: Chart on South America - Year-over-year growth 2024-2029 (%)
- Exhibits124: Data Table on South America - Year-over-year growth 2024-2029 (%)
- Exhibits125: Chart on Middle East and Africa - Market size and forecast 2024-2029 ($ million)
- Exhibits126: Data Table on Middle East and Africa - Market size and forecast 2024-2029 ($ million)
- Exhibits127: Chart on Middle East and Africa - Year-over-year growth 2024-2029 (%)
- Exhibits128: Data Table on Middle East and Africa - Year-over-year growth 2024-2029 (%)
- Exhibits129: Chart on US - Market size and forecast 2024-2029 ($ million)
- Exhibits130: Data Table on US - Market size and forecast 2024-2029 ($ million)
- Exhibits131: Chart on US - Year-over-year growth 2024-2029 (%)
- Exhibits132: Data Table on US - Year-over-year growth 2024-2029 (%)
- Exhibits133: Chart on China - Market size and forecast 2024-2029 ($ million)
- Exhibits134: Data Table on China - Market size and forecast 2024-2029 ($ million)
- Exhibits135: Chart on China - Year-over-year growth 2024-2029 (%)
- Exhibits136: Data Table on China - Year-over-year growth 2024-2029 (%)
- Exhibits137: Chart on Germany - Market size and forecast 2024-2029 ($ million)
- Exhibits138: Data Table on Germany - Market size and forecast 2024-2029 ($ million)
- Exhibits139: Chart on Germany - Year-over-year growth 2024-2029 (%)
- Exhibits140: Data Table on Germany - Year-over-year growth 2024-2029 (%)
- Exhibits141: Chart on Canada - Market size and forecast 2024-2029 ($ million)
- Exhibits142: Data Table on Canada - Market size and forecast 2024-2029 ($ million)
- Exhibits143: Chart on Canada - Year-over-year growth 2024-2029 (%)
- Exhibits144: Data Table on Canada - Year-over-year growth 2024-2029 (%)
- Exhibits145: Chart on UK - Market size and forecast 2024-2029 ($ million)
- Exhibits146: Data Table on UK - Market size and forecast 2024-2029 ($ million)
- Exhibits147: Chart on UK - Year-over-year growth 2024-2029 (%)
- Exhibits148: Data Table on UK - Year-over-year growth 2024-2029 (%)
- Exhibits149: Chart on Japan - Market size and forecast 2024-2029 ($ million)
- Exhibits150: Data Table on Japan - Market size and forecast 2024-2029 ($ million)
- Exhibits151: Chart on Japan - Year-over-year growth 2024-2029 (%)
- Exhibits152: Data Table on Japan - Year-over-year growth 2024-2029 (%)
- Exhibits153: Chart on France - Market size and forecast 2024-2029 ($ million)
- Exhibits154: Data Table on France - Market size and forecast 2024-2029 ($ million)
- Exhibits155: Chart on France - Year-over-year growth 2024-2029 (%)
- Exhibits156: Data Table on France - Year-over-year growth 2024-2029 (%)
- Exhibits157: Chart on South Korea - Market size and forecast 2024-2029 ($ million)
- Exhibits158: Data Table on South Korea - Market size and forecast 2024-2029 ($ million)
- Exhibits159: Chart on South Korea - Year-over-year growth 2024-2029 (%)
- Exhibits160: Data Table on South Korea - Year-over-year growth 2024-2029 (%)
- Exhibits161: Chart on Brazil - Market size and forecast 2024-2029 ($ million)
- Exhibits162: Data Table on Brazil - Market size and forecast 2024-2029 ($ million)
- Exhibits163: Chart on Brazil - Year-over-year growth 2024-2029 (%)
- Exhibits164: Data Table on Brazil - Year-over-year growth 2024-2029 (%)
- Exhibits165: Chart on India - Market size and forecast 2024-2029 ($ million)
- Exhibits166: Data Table on India - Market size and forecast 2024-2029 ($ million)
- Exhibits167: Chart on India - Year-over-year growth 2024-2029 (%)
- Exhibits168: Data Table on India - Year-over-year growth 2024-2029 (%)
- Exhibits169: Market opportunity By Geographical Landscape ($ million)
- Exhibits170: Data Tables on Market opportunity By Geographical Landscape ($ million)
- Exhibits171: Impact of drivers and challenges in 2024 and 2029
- Exhibits172: Overview on criticality of inputs and factors of differentiation
- Exhibits173: Overview on factors of disruption
- Exhibits174: Impact of key risks on business
- Exhibits175: Companies covered
- Exhibits176: Company ranking index
- Exhibits177: Matrix on companies position and classification
- Exhibits178: AB Volvo - Overview
- Exhibits179: AB Volvo - Business segments
- Exhibits180: AB Volvo - Key news
- Exhibits181: AB Volvo - Key offerings
- Exhibits182: AB Volvo - Segment focus
- Exhibits183: SWOT
- Exhibits184: Alpine Armoring Inc. - Overview
- Exhibits185: Alpine Armoring Inc. - Product / Service
- Exhibits186: Alpine Armoring Inc. - Key offerings
- Exhibits187: SWOT
- Exhibits188: Armormax - Overview
- Exhibits189: Armormax - Product / Service
- Exhibits190: Armormax - Key offerings
- Exhibits191: SWOT
- Exhibits192: BAE Systems Plc - Overview
- Exhibits193: BAE Systems Plc - Business segments
- Exhibits194: BAE Systems Plc - Key news
- Exhibits195: BAE Systems Plc - Key offerings
- Exhibits196: BAE Systems Plc - Segment focus
- Exhibits197: SWOT
- Exhibits198: Denel SOC Ltd. - Overview
- Exhibits199: Denel SOC Ltd. - Product / Service
- Exhibits200: Denel SOC Ltd. - Key offerings
- Exhibits201: SWOT
- Exhibits202: General Dynamics Corp. - Overview
- Exhibits203: General Dynamics Corp. - Business segments
- Exhibits204: General Dynamics Corp. - Key news
- Exhibits205: General Dynamics Corp. - Key offerings
- Exhibits206: General Dynamics Corp. - Segment focus
- Exhibits207: SWOT
- Exhibits208: Iveco Group N.V - Overview
- Exhibits209: Iveco Group N.V - Business segments
- Exhibits210: Iveco Group N.V - Key offerings
- Exhibits211: Iveco Group N.V - Segment focus
- Exhibits212: SWOT
- Exhibits213: KNDS N.V. - Overview
- Exhibits214: KNDS N.V. - Product / Service
- Exhibits215: KNDS N.V. - Key offerings
- Exhibits216: SWOT
- Exhibits217: Lockheed Martin Corp. - Overview
- Exhibits218: Lockheed Martin Corp. - Business segments
- Exhibits219: Lockheed Martin Corp. - Key news
- Exhibits220: Lockheed Martin Corp. - Key offerings
- Exhibits221: Lockheed Martin Corp. - Segment focus
- Exhibits222: SWOT
- Exhibits223: Milkor Pty Ltd. - Overview
- Exhibits224: Milkor Pty Ltd. - Product / Service
- Exhibits225: Milkor Pty Ltd. - Key offerings
- Exhibits226: SWOT
- Exhibits227: Oshkosh Corp. - Overview
- Exhibits228: Oshkosh Corp. - Business segments
- Exhibits229: Oshkosh Corp. - Key news
- Exhibits230: Oshkosh Corp. - Key offerings
- Exhibits231: Oshkosh Corp. - Segment focus
- Exhibits232: SWOT
- Exhibits233: Rheinmetall AG - Overview
- Exhibits234: Rheinmetall AG - Business segments
- Exhibits235: Rheinmetall AG - Key news
- Exhibits236: Rheinmetall AG - Key offerings
- Exhibits237: Rheinmetall AG - Segment focus
- Exhibits238: SWOT
- Exhibits239: Rostec - Overview
- Exhibits240: Rostec - Product / Service
- Exhibits241: Rostec - Key offerings
- Exhibits242: SWOT
- Exhibits243: Textron Inc. - Overview
- Exhibits244: Textron Inc. - Business segments
- Exhibits245: Textron Inc. - Key offerings
- Exhibits246: Textron Inc. - Segment focus
- Exhibits247: SWOT
- Exhibits248: Traton SE - Overview
- Exhibits249: Traton SE - Business segments
- Exhibits250: Traton SE - Key offerings
- Exhibits251: Traton SE - Segment focus
- Exhibits252: SWOT
- Exhibits253: Inclusions checklist
- Exhibits254: Exclusions checklist
- Exhibits255: Currency conversion rates for US$
- Exhibits256: Research methodology
- Exhibits257: Information sources
- Exhibits258: Data validation
- Exhibits259: Validation techniques employed for market sizing
- Exhibits260: Data synthesis
- Exhibits261: 360 degree market analysis
- Exhibits262: List of abbreviations
The armored vehicles market is forecasted to grow by USD 8316.8 million during 2024-2029, accelerating at a CAGR of 6.8% during the forecast period. The report on the armored vehicles market provides a holistic analysis, market size and forecast, trends, growth drivers, and challenges, as well as vendor analysis covering around 25 vendors.
The report offers an up-to-date analysis regarding the current market scenario, the latest trends and drivers, and the overall market environment. The market is driven by rising incidences of asymmetric warfare globally, upgrade of defense capabilities to counter emerging security threats, and advent of hybrid drivetrains in MRAPs.
| Market Scope | |
|---|---|
| Base Year | 2025 |
| End Year | 2029 |
| Series Year | 2025-2029 |
| Growth Momentum | Accelerate |
| YOY 2025 | 5.8% |
| CAGR | 6.8% |
| Incremental Value | $8316.8 mn |
The study was conducted using an objective combination of primary and secondary information including inputs from key participants in the industry. The report contains a comprehensive market size data, segment with regional analysis and vendor landscape in addition to an analysis of the key companies. Reports have historic and forecast data.
Technavio's armored vehicles market is segmented as below:
By Mobility Type
- Wheeled
- Tracked
By Type
- Conventional
- Electric
By Product
- Manned armored vehicles
- Unmanned armored vehicles
By Application
- Drive systems
- Structures and mechanisms
- Weapons and ammunition control systems
- Others
By Geographical Landscape
- North America
- Europe
- APAC
- South America
- Middle East and Africa
This study identifies the increased adoption of unmanned combat ground vehicles as one of the prime reasons driving the armored vehicles market growth during the next few years. Also, integration of directed energy weapons (DEW) with armored vehicles and emergence of active protection systems (APS) will lead to sizable demand in the market.
The report on the armored vehicles market covers the following areas:
- Armored Vehicles Market sizing
- Armored Vehicles Market forecast
- Armored Vehicles Market industry analysis
The robust vendor analysis is designed to help clients improve their market position, and in line with this, this report provides a detailed analysis of several leading armored vehicles market vendors that include AB Volvo, Alpine Armoring Inc., Armormax, BAE Systems PLC, Denel SOC Ltd., General Dynamics Corp., International Armored Group, Iveco Group N.V, KNDS N.V., Lockheed Martin Corp., Mahindra and Mahindra Ltd., Milkor Pty Ltd., Oshkosh Corp., Otokar Automotive and Defense Industry Inc., Rheinmetall AG, Rostec, STREIT Group, SVI ENGINEERING, Textron Inc., and Traton SE. Also, the armored vehicles market analysis report includes information on upcoming trends and challenges that will influence market growth. This is to help companies strategize and leverage all forthcoming growth opportunities.
The publisher presents a detailed picture of the market by the way of study, synthesis, and summation of data from multiple sources by an analysis of key parameters such as profit, pricing, competition, and promotions. It presents various market facets by identifying the key industry influencers. The data presented is comprehensive, reliable, and a result of extensive primary and secondary research. The market research reports provide a complete competitive landscape and an in-depth vendor selection methodology and analysis using qualitative and quantitative research to forecast accurate market growth.
Table of Contents
1 Executive Summary
- 1.1 Market overview
- Executive Summary - Chart on Market Overview
- Executive Summary - Data Table on Market Overview
- Executive Summary - Chart on Global Market Characteristics
- Executive Summary - Chart on Market By Geographical Landscape
- Executive Summary - Chart on Market Segmentation by Mobility Type
- Executive Summary - Chart on Market Segmentation by Type
- Executive Summary - Chart on Market Segmentation by Product
- Executive Summary - Chart on Market Segmentation by Application
- Executive Summary - Chart on Incremental Growth
- Executive Summary - Data Table on Incremental Growth
- Executive Summary - Chart on Company Market Positioning
2 Technavio Analysis
- 2.1 Analysis of price sensitivity, lifecycle, customer purchase basket, adoption rates, and purchase criteria
- Analysis of price sensitivity, lifecycle, customer purchase basket, adoption rates, and purchase criteria
- 2.2 Criticality of inputs and Factors of differentiation
- Overview on criticality of inputs and factors of differentiation
- 2.3 Factors of disruption
- Overview on factors of disruption
- 2.4 Impact of drivers and challenges
- Impact of drivers and challenges in 2024 and 2029
3 Market Landscape
- 3.1 Market ecosystem
- Parent Market
- Data Table on - Parent Market
- 3.2 Market characteristics
- Market characteristics analysis
- 3.3 Value chain analysis
- Value chain analysis
4 Market Sizing
- 4.1 Market definition
- Offerings of companies included in the market definition
- 4.2 Market segment analysis
- Market segments
- 4.3 Market size 2024
- 4.4 Market outlook: Forecast for 2024-2029
- Chart on Global - Market size and forecast 2024-2029 ($ million)
- Data Table on Global - Market size and forecast 2024-2029 ($ million)
- Chart on Global Market: Year-over-year growth 2024-2029 (%)
- Data Table on Global Market: Year-over-year growth 2024-2029 (%)
5 Historic Market Size
- 5.1 Global Armored Vehicles Market 2019 - 2023
- Historic Market Size - Data Table on Global Armored Vehicles Market 2019 - 2023 ($ million)
- 5.2 Mobility Type segment analysis 2019 - 2023
- Historic Market Size - Mobility Type Segment 2019 - 2023 ($ million)
- 5.3 Type segment analysis 2019 - 2023
- Historic Market Size - Type Segment 2019 - 2023 ($ million)
- 5.4 Product segment analysis 2019 - 2023
- Historic Market Size - Product Segment 2019 - 2023 ($ million)
- 5.5 Application segment analysis 2019 - 2023
- Historic Market Size - Application Segment 2019 - 2023 ($ million)
- 5.6 Geography segment analysis 2019 - 2023
- Historic Market Size - Geography Segment 2019 - 2023 ($ million)
- 5.7 Country segment analysis 2019 - 2023
- Historic Market Size - Country Segment 2019 - 2023 ($ million)
6 Qualitative Analysis
- 6.1 The AI impact on global armored vehicles market
7 Five Forces Analysis
- 7.1 Five forces summary
- Five forces analysis - Comparison between 2024 and 2029
- 7.2 Bargaining power of buyers
- Bargaining power of buyers - Impact of key factors 2024 and 2029
- 7.3 Bargaining power of suppliers
- Bargaining power of suppliers - Impact of key factors in 2024 and 2029
- 7.4 Threat of new entrants
- Threat of new entrants - Impact of key factors in 2024 and 2029
- 7.5 Threat of substitutes
- Threat of substitutes - Impact of key factors in 2024 and 2029
- 7.6 Threat of rivalry
- Threat of rivalry - Impact of key factors in 2024 and 2029
- 7.7 Market condition
- Chart on Market condition - Five forces 2024 and 2029
8 Market Segmentation by Mobility Type
- 8.1 Market segments
- Chart on Mobility Type - Market share 2024-2029 (%)
- Data Table on Mobility Type - Market share 2024-2029 (%)
- 8.2 Comparison by Mobility Type
- Chart on Comparison by Mobility Type
- Data Table on Comparison by Mobility Type
- 8.3 Wheeled - Market size and forecast 2024-2029
- Chart on Wheeled - Market size and forecast 2024-2029 ($ million)
- Data Table on Wheeled - Market size and forecast 2024-2029 ($ million)
- Chart on Wheeled - Year-over-year growth 2024-2029 (%)
- Data Table on Wheeled - Year-over-year growth 2024-2029 (%)
- 8.4 Tracked - Market size and forecast 2024-2029
- Chart on Tracked - Market size and forecast 2024-2029 ($ million)
- Data Table on Tracked - Market size and forecast 2024-2029 ($ million)
- Chart on Tracked - Year-over-year growth 2024-2029 (%)
- Data Table on Tracked - Year-over-year growth 2024-2029 (%)
- 8.5 Market opportunity by Mobility Type
- Market opportunity by Mobility Type ($ million)
- Data Table on Market opportunity by Mobility Type ($ million)
9 Market Segmentation by Type
- 9.1 Market segments
- Chart on Type - Market share 2024-2029 (%)
- Data Table on Type - Market share 2024-2029 (%)
- 9.2 Comparison by Type
- Chart on Comparison by Type
- Data Table on Comparison by Type
- 9.3 Conventional - Market size and forecast 2024-2029
- Chart on Conventional - Market size and forecast 2024-2029 ($ million)
- Data Table on Conventional - Market size and forecast 2024-2029 ($ million)
- Chart on Conventional - Year-over-year growth 2024-2029 (%)
- Data Table on Conventional - Year-over-year growth 2024-2029 (%)
- 9.4 Electric - Market size and forecast 2024-2029
- Chart on Electric - Market size and forecast 2024-2029 ($ million)
- Data Table on Electric - Market size and forecast 2024-2029 ($ million)
- Chart on Electric - Year-over-year growth 2024-2029 (%)
- Data Table on Electric - Year-over-year growth 2024-2029 (%)
- 9.5 Market opportunity by Type
- Market opportunity by Type ($ million)
- Data Table on Market opportunity by Type ($ million)
10 Market Segmentation by Product
- 10.1 Market segments
- Chart on Product - Market share 2024-2029 (%)
- Data Table on Product - Market share 2024-2029 (%)
- 10.2 Comparison by Product
- Chart on Comparison by Product
- Data Table on Comparison by Product
- 10.3 Manned armored vehicles - Market size and forecast 2024-2029
- Chart on Manned armored vehicles - Market size and forecast 2024-2029 ($ million)
- Data Table on Manned armored vehicles - Market size and forecast 2024-2029 ($ million)
- Chart on Manned armored vehicles - Year-over-year growth 2024-2029 (%)
- Data Table on Manned armored vehicles - Year-over-year growth 2024-2029 (%)
- 10.4 Unmanned armored vehicles - Market size and forecast 2024-2029
- Chart on Unmanned armored vehicles - Market size and forecast 2024-2029 ($ million)
- Data Table on Unmanned armored vehicles - Market size and forecast 2024-2029 ($ million)
- Chart on Unmanned armored vehicles - Year-over-year growth 2024-2029 (%)
- Data Table on Unmanned armored vehicles - Year-over-year growth 2024-2029 (%)
- 10.5 Market opportunity by Product
- Market opportunity by Product ($ million)
- Data Table on Market opportunity by Product ($ million)
11 Market Segmentation by Application
- 11.1 Market segments
- Chart on Application - Market share 2024-2029 (%)
- Data Table on Application - Market share 2024-2029 (%)
- 11.2 Comparison by Application
- Chart on Comparison by Application
- Data Table on Comparison by Application
- 11.3 Drive systems - Market size and forecast 2024-2029
- Chart on Drive systems - Market size and forecast 2024-2029 ($ million)
- Data Table on Drive systems - Market size and forecast 2024-2029 ($ million)
- Chart on Drive systems - Year-over-year growth 2024-2029 (%)
- Data Table on Drive systems - Year-over-year growth 2024-2029 (%)
- 11.4 Structures and mechanisms - Market size and forecast 2024-2029
- Chart on Structures and mechanisms - Market size and forecast 2024-2029 ($ million)
- Data Table on Structures and mechanisms - Market size and forecast 2024-2029 ($ million)
- Chart on Structures and mechanisms - Year-over-year growth 2024-2029 (%)
- Data Table on Structures and mechanisms - Year-over-year growth 2024-2029 (%)
- 11.5 Weapons and ammunition control systems - Market size and forecast 2024-2029
- Chart on Weapons and ammunition control systems - Market size and forecast 2024-2029 ($ million)
- Data Table on Weapons and ammunition control systems - Market size and forecast 2024-2029 ($ million)
- Chart on Weapons and ammunition control systems - Year-over-year growth 2024-2029 (%)
- Data Table on Weapons and ammunition control systems - Year-over-year growth 2024-2029 (%)
- 11.6 Others - Market size and forecast 2024-2029
- Chart on Others - Market size and forecast 2024-2029 ($ million)
- Data Table on Others - Market size and forecast 2024-2029 ($ million)
- Chart on Others - Year-over-year growth 2024-2029 (%)
- Data Table on Others - Year-over-year growth 2024-2029 (%)
- 11.7 Market opportunity by Application
- Market opportunity by Application ($ million)
- Data Table on Market opportunity by Application ($ million)
12 Customer Landscape
- 12.1 Customer landscape overview
- Analysis of price sensitivity, lifecycle, customer purchase basket, adoption rates, and purchase criteria
13 Geographic Landscape
- 13.1 Geographic segmentation
- Chart on Market share By Geographical Landscape 2024-2029 (%)
- Data Table on Market share By Geographical Landscape 2024-2029 (%)
- 13.2 Geographic comparison
- Chart on Geographic comparison
- Data Table on Geographic comparison
- 13.3 North America - Market size and forecast 2024-2029
- Chart on North America - Market size and forecast 2024-2029 ($ million)
- Data Table on North America - Market size and forecast 2024-2029 ($ million)
- Chart on North America - Year-over-year growth 2024-2029 (%)
- Data Table on North America - Year-over-year growth 2024-2029 (%)
- 13.4 Europe - Market size and forecast 2024-2029
- Chart on Europe - Market size and forecast 2024-2029 ($ million)
- Data Table on Europe - Market size and forecast 2024-2029 ($ million)
- Chart on Europe - Year-over-year growth 2024-2029 (%)
- Data Table on Europe - Year-over-year growth 2024-2029 (%)
- 13.5 APAC - Market size and forecast 2024-2029
- Chart on APAC - Market size and forecast 2024-2029 ($ million)
- Data Table on APAC - Market size and forecast 2024-2029 ($ million)
- Chart on APAC - Year-over-year growth 2024-2029 (%)
- Data Table on APAC - Year-over-year growth 2024-2029 (%)
- 13.6 South America - Market size and forecast 2024-2029
- Chart on South America - Market size and forecast 2024-2029 ($ million)
- Data Table on South America - Market size and forecast 2024-2029 ($ million)
- Chart on South America - Year-over-year growth 2024-2029 (%)
- Data Table on South America - Year-over-year growth 2024-2029 (%)
- 13.7 Middle East and Africa - Market size and forecast 2024-2029
- Chart on Middle East and Africa - Market size and forecast 2024-2029 ($ million)
- Data Table on Middle East and Africa - Market size and forecast 2024-2029 ($ million)
- Chart on Middle East and Africa - Year-over-year growth 2024-2029 (%)
- Data Table on Middle East and Africa - Year-over-year growth 2024-2029 (%)
- 13.8 US - Market size and forecast 2024-2029
- Chart on US - Market size and forecast 2024-2029 ($ million)
- Data Table on US - Market size and forecast 2024-2029 ($ million)
- Chart on US - Year-over-year growth 2024-2029 (%)
- Data Table on US - Year-over-year growth 2024-2029 (%)
- 13.9 China - Market size and forecast 2024-2029
- Chart on China - Market size and forecast 2024-2029 ($ million)
- Data Table on China - Market size and forecast 2024-2029 ($ million)
- Chart on China - Year-over-year growth 2024-2029 (%)
- Data Table on China - Year-over-year growth 2024-2029 (%)
- 13.10 Germany - Market size and forecast 2024-2029
- Chart on Germany - Market size and forecast 2024-2029 ($ million)
- Data Table on Germany - Market size and forecast 2024-2029 ($ million)
- Chart on Germany - Year-over-year growth 2024-2029 (%)
- Data Table on Germany - Year-over-year growth 2024-2029 (%)
- 13.11 Canada - Market size and forecast 2024-2029
- Chart on Canada - Market size and forecast 2024-2029 ($ million)
- Data Table on Canada - Market size and forecast 2024-2029 ($ million)
- Chart on Canada - Year-over-year growth 2024-2029 (%)
- Data Table on Canada - Year-over-year growth 2024-2029 (%)
- 13.12 UK - Market size and forecast 2024-2029
- Chart on UK - Market size and forecast 2024-2029 ($ million)
- Data Table on UK - Market size and forecast 2024-2029 ($ million)
- Chart on UK - Year-over-year growth 2024-2029 (%)
- Data Table on UK - Year-over-year growth 2024-2029 (%)
- 13.13 Japan - Market size and forecast 2024-2029
- Chart on Japan - Market size and forecast 2024-2029 ($ million)
- Data Table on Japan - Market size and forecast 2024-2029 ($ million)
- Chart on Japan - Year-over-year growth 2024-2029 (%)
- Data Table on Japan - Year-over-year growth 2024-2029 (%)
- 13.14 France - Market size and forecast 2024-2029
- Chart on France - Market size and forecast 2024-2029 ($ million)
- Data Table on France - Market size and forecast 2024-2029 ($ million)
- Chart on France - Year-over-year growth 2024-2029 (%)
- Data Table on France - Year-over-year growth 2024-2029 (%)
- 13.15 South Korea - Market size and forecast 2024-2029
- Chart on South Korea - Market size and forecast 2024-2029 ($ million)
- Data Table on South Korea - Market size and forecast 2024-2029 ($ million)
- Chart on South Korea - Year-over-year growth 2024-2029 (%)
- Data Table on South Korea - Year-over-year growth 2024-2029 (%)
- 13.16 Brazil - Market size and forecast 2024-2029
- Chart on Brazil - Market size and forecast 2024-2029 ($ million)
- Data Table on Brazil - Market size and forecast 2024-2029 ($ million)
- Chart on Brazil - Year-over-year growth 2024-2029 (%)
- Data Table on Brazil - Year-over-year growth 2024-2029 (%)
- 13.17 India - Market size and forecast 2024-2029
- Chart on India - Market size and forecast 2024-2029 ($ million)
- Data Table on India - Market size and forecast 2024-2029 ($ million)
- Chart on India - Year-over-year growth 2024-2029 (%)
- Data Table on India - Year-over-year growth 2024-2029 (%)
- 13.18 Market opportunity By Geographical Landscape
- Market opportunity By Geographical Landscape ($ million)
- Data Tables on Market opportunity By Geographical Landscape ($ million)
14 Drivers, Challenges, and Opportunity/Restraints
- 14.1 Market drivers
- 14.2 Market challenges
- 14.3 Impact of drivers and challenges
- Impact of drivers and challenges in 2024 and 2029
- 14.4 Market opportunities/restraints
15 Competitive Landscape
- 15.1 Overview
- 15.2 Competitive Landscape
- Overview on criticality of inputs and factors of differentiation
- 15.3 Landscape disruption
- Overview on factors of disruption
- 15.4 Industry risks
- Impact of key risks on business
16 Competitive Analysis
- 16.1 Companies profiled
- Companies covered
- 16.2 Company ranking index
- Company ranking index
- 16.3 Market positioning of companies
- Matrix on companies position and classification
- 16.4 AB Volvo
- AB Volvo - Overview
- AB Volvo - Business segments
- AB Volvo - Key news
- AB Volvo - Key offerings
- AB Volvo - Segment focus
- SWOT
- 16.5 Alpine Armoring Inc.
- Alpine Armoring Inc. - Overview
- Alpine Armoring Inc. - Product / Service
- Alpine Armoring Inc. - Key offerings
- SWOT
- 16.6 Armormax
- Armormax - Overview
- Armormax - Product / Service
- Armormax - Key offerings
- SWOT
- 16.7 BAE Systems Plc
- BAE Systems Plc - Overview
- BAE Systems Plc - Business segments
- BAE Systems Plc - Key news
- BAE Systems Plc - Key offerings
- BAE Systems Plc - Segment focus
- SWOT
- 16.8 Denel SOC Ltd.
- Denel SOC Ltd. - Overview
- Denel SOC Ltd. - Product / Service
- Denel SOC Ltd. - Key offerings
- SWOT
- 16.9 General Dynamics Corp.
- General Dynamics Corp. - Overview
- General Dynamics Corp. - Business segments
- General Dynamics Corp. - Key news
- General Dynamics Corp. - Key offerings
- General Dynamics Corp. - Segment focus
- SWOT
- 16.10 Iveco Group N.V
- Iveco Group N.V - Overview
- Iveco Group N.V - Business segments
- Iveco Group N.V - Key offerings
- Iveco Group N.V - Segment focus
- SWOT
- 16.11 KNDS N.V.
- KNDS N.V. - Overview
- KNDS N.V. - Product / Service
- KNDS N.V. - Key offerings
- SWOT
- 16.12 Lockheed Martin Corp.
- Lockheed Martin Corp. - Overview
- Lockheed Martin Corp. - Business segments
- Lockheed Martin Corp. - Key news
- Lockheed Martin Corp. - Key offerings
- Lockheed Martin Corp. - Segment focus
- SWOT
- 16.13 Milkor Pty Ltd.
- Milkor Pty Ltd. - Overview
- Milkor Pty Ltd. - Product / Service
- Milkor Pty Ltd. - Key offerings
- SWOT
- 16.14 Oshkosh Corp.
- Oshkosh Corp. - Overview
- Oshkosh Corp. - Business segments
- Oshkosh Corp. - Key news
- Oshkosh Corp. - Key offerings
- Oshkosh Corp. - Segment focus
- SWOT
- 16.15 Rheinmetall AG
- Rheinmetall AG - Overview
- Rheinmetall AG - Business segments
- Rheinmetall AG - Key news
- Rheinmetall AG - Key offerings
- Rheinmetall AG - Segment focus
- SWOT
- 16.16 Rostec
- Rostec - Overview
- Rostec - Product / Service
- Rostec - Key offerings
- SWOT
- 16.17 Textron Inc.
- Textron Inc. - Overview
- Textron Inc. - Business segments
- Textron Inc. - Key offerings
- Textron Inc. - Segment focus
- SWOT
- 16.18 Traton SE
- Traton SE - Overview
- Traton SE - Business segments
- Traton SE - Key offerings
- Traton SE - Segment focus
- SWOT
17 Appendix
- 17.1 Scope of the report
- 17.2 Inclusions and exclusions checklist
- Inclusions checklist
- Exclusions checklist
- 17.3 Currency conversion rates for US$
- Currency conversion rates for US$
- 17.4 Research methodology
- Research methodology
- 17.5 Data procurement
- Information sources
- 17.6 Data validation
- Data validation
- 17.7 Validation techniques employed for market sizing
- Validation techniques employed for market sizing
- 17.8 Data synthesis
- Data synthesis
- 17.9 360 degree market analysis
- 360 degree market analysis
- 17.10 List of abbreviations
- List of abbreviations

