|
|
市場調査レポート
商品コード
1859835
フェノール樹脂の世界市場 2025-2029Global Phenolic Resin Market 2025-2029 |
||||||
|
|||||||
カスタマイズ可能
|
|||||||

| フェノール樹脂の世界市場 2025-2029 |
|
出版日: 2025年08月30日
発行: TechNavio
ページ情報: 英文 233 Pages
納期: 即納可能
|

概要
フェノール樹脂市場は2024-2029年に45億5,880万米ドル、予測期間中のCAGRは5.4%で成長すると予測されます。
当レポートでは、フェノール樹脂市場の全体的な分析、市場規模・予測、動向、成長促進要因、課題、約25のベンダーを網羅したベンダー分析などを掲載しています。
現在の市場シナリオ、最新動向と促進要因、市場環境全体に関する最新分析を提供しています。自動車産業におけるフェノール樹脂の需要増加、市場開拓におけるフェノール樹脂へのニーズの高まり、フェノール樹脂の利点がフェノール樹脂市場の成長を後押ししています。
| 市場範囲 | |
|---|---|
| 基準年 | 2025 |
| 終了年 | 2029 |
| 予測期間 | 2025-2029 |
| 成長モメンタム | 加速 |
| 前年比 | 5% |
| CAGR | 5.4% |
| 増分額 | 45億5,880万米ドル |
本調査は、業界の主要参加者からのインプットを含め、一次情報と二次情報を客観的に組み合わせて実施しました。レポートには、主要企業の分析に加え、包括的な市場規模データ、地域別分析によるセグメント、ベンダー情勢が含まれています。レポートには過去データと予測データがあります。
本調査では、今後数年間のフェノール樹脂市場の成長を促進する主な要因の1つとして、フェノール樹脂製造の代替品導入の増加を挙げています。また、カーボンナノファイバーの導入と新製品の開拓が進むことで、市場の需要も大きくなるでしょう。
目次
第1章 エグゼクティブサマリー
- 市場概要
第2章 Technavio分析
- 価格・ライフサイクル・顧客購入バスケット・採用率・購入基準の分析
- インプットの重要性と差別化の要因
- 混乱の要因
- 促進要因と課題の影響
第3章 市場情勢
- 市場エコシステム
- 市場の特徴
- バリューチェーン分析
第4章 市場規模
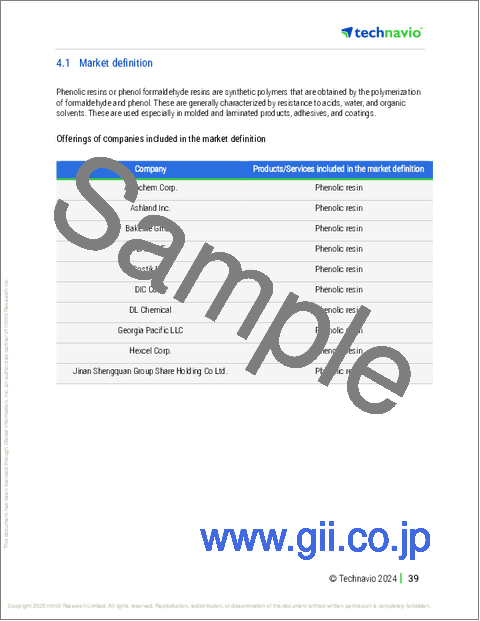
- 市場の定義
- 市場セグメント分析
- 市場規模 2024
- 市場の見通し 2024-2029
第5章 市場規模実績
- フェノール樹脂の世界市場 2019-2023
- 製品セグメント分析 2019-2023
- 用途別セグメント分析 2019-2023
- エンドユーザーセグメント分析 2019-2023
- 地域別セグメント分析 2019-2023
- 国別セグメント分析 2019-2023
第6章 定性分析
- AIの影響:フェノール樹脂の世界市場
第7章 ファイブフォース分析
- ファイブフォースの要約
- 買い手の交渉力
- 供給企業の交渉力
- 新規参入業者の脅威
- 代替品の脅威
- 競争の脅威
- 市況
第8章 市場セグメンテーション:製品別
- 市場セグメント
- 比較:製品別
- ノボラック樹脂:市場規模と予測 2024-2029
- レゾール樹脂:市場規模と予測 2024-2029
- その他:市場規模と予測 2024-2029
- 市場機会:製品別
第9章 市場セグメンテーション:用途別
- 市場セグメント
- 比較:用途別
- 成形:市場規模と予測 2024-2029
- 断熱材:市場規模と予測 2024-2029
- 木材用接着剤:市場規模と予測 2024-2029
- ラミネート:市場規模と予測 2024-2029
- その他:市場規模と予測 2024-2029
- 市場機会:用途別
第10章 市場セグメンテーション:エンドユーザー別
- 市場セグメント
- 比較:エンドユーザー別
- 建設機械:市場規模と予測 2024-2029
- 自動車:市場規模と予測 2024-2029
- エレクトロニクス:市場規模と予測 2024-2029
- 家具:市場規模と予測 2024-2029
- 産業機械:市場規模と予測 2024-2029
- 市場機会:エンドユーザー別
第11章 顧客情勢
- 顧客情勢の概要
第12章 地域別情勢
- 地域別セグメンテーション
- 地域別比較
- アジア太平洋:市場規模と予測 2024-2029
- 北米:市場規模と予測 2024-2029
- 欧州:市場規模と予測 2024-2029
- 南米:市場規模と予測 2024-2029
- 中東・アフリカ:市場規模と予測 2024-2029
- 米国:市場規模と予測 2024-2029
- 日本:市場規模と予測 2024-2029
- 中国:市場規模と予測 2024-2029
- インド:市場規模と予測 2024-2029
- 韓国:市場規模と予測 2024-2029
- カナダ:市場規模と予測 2024-2029
- オーストラリア:市場規模と予測 2024-2029
- ドイツ:市場規模と予測 2024-2029
- 英国:市場規模と予測 2024-2029
- メキシコ:市場規模と予測 2024-2029
- 市場機会:地域情勢別
第13章 促進要因・課題・機会・抑制要因
- 市場促進要因
- 市場の課題
- 促進要因と課題の影響
- 市場の機会・抑制要因
第14章 競合情勢
- 概要
- 競合情勢
- 混乱の状況
- 業界のリスク
第15章 競合分析
- 企業プロファイル
- 企業ランキング
- 企業の市場ポジショニング
- Akrochem Corp.
- Ashland Inc.
- Bakelite GmbH
- BASF SE
- Bostik Ltd.
- DIC Corp.
- DL Chemical
- Georgia Pacific LLC
- Hexcel Corp.
- Jinan Shengquan Group Share Holding Co Ltd.
- Kolon Industries Inc.
- Momentive Performance Materials
- Sasol Ltd.
- SI Group Inc.
- Sumitomo Bakelite Co. Ltd.

