|
|
市場調査レポート
商品コード
1626734
エッジデータセンターの世界市場 2025~2029年Global Edge Data Center Market 2025-2029 |
||||||

|
|||||||
カスタマイズ可能
|
|||||||


| エッジデータセンターの世界市場 2025~2029年 |
|
出版日: 2024年12月25日
発行: TechNavio
ページ情報: 英文 224 Pages
納期: 即納可能
|

全表示
- 概要
- 図表
- 目次
エッジデータセンター市場 2025~2029年
エッジデータセンター市場は2024~2029年に451億200万米ドル、予測期間中のCAGRは32.8%で成長すると予測されます。当レポートでは、エッジデータセンター市場の全体的な分析、市場規模・予測、動向、成長促進要因、課題、約25のベンダーを網羅したベンダー分析などを掲載しています。
現在の市場シナリオ、最新動向と促進要因、市場環境全体に関する最新分析を提供しています。市場は、動画ストリーミングサービスの需要増加、マルチクラウドの採用増加、5G対応へのネットワークアップグレード、モバイルデータトラフィックの増加などが牽引しています。
| 市場範囲 | |
|---|---|
| 基準年 | 2025 |
| 終了年 | 2029 |
| 予測期間 | 2025-2029 |
| 成長モメンタム | 加速 |
| 前年比2025年 | 24.8% |
| CAGR | 32.8% |
| 増分額 | 451億200万米ドル |
本調査では、今後数年間のエッジデータセンター市場成長を牽引する主な要因の1つとして、データセンターへのAI導入を挙げています。また、企業全体でhpcの採用が増加し、エッジデータセンターが統合されることで、同市場では大きな需要が見込まれます。
目次
第1章 エグゼクティブサマリー
- 市場概要
第2章 Technavio別分析
- 価格・ライフサイクル・顧客購入バスケット・採用率・購入基準の分析
- インプットの重要性と差別化の要因
- 混乱の要因
- 促進要因と課題の影響
第3章 市場情勢
- 市場エコシステム
- 市場の特徴
- バリューチェーン分析
第4章 市場規模
- 市場の定義
- 市場セグメント分析
- 市場規模 2024年
- 市場の見通し 2024~2029年
第5章 市場規模実績
- エッジデータセンターの世界市場 2019~2023年
- エンドユーザー別セグメント分析
- コンポーネント別セグメント分析
- 地域別セグメント分析
- 国別セグメント分析
第6章 定性分析
- AIの影響:エッジデータセンターの世界市場
第7章 ファイブフォース分析
- ファイブフォースの要約
- 買い手の交渉力
- 供給企業の交渉力
- 新規参入業者の脅威
- 代替品の脅威
- 競争の脅威
- 市況
第8章 市場セグメンテーション:エンドユーザー別
- 市場セグメント
- 比較:エンドユーザー別
- IT・通信
- 製造業と自動車
- BFSI
- ヘルスケアとライフサイエンス
- その他
- 市場機会:エンドユーザー別
第9章 市場セグメンテーション:コンポーネント別
- 市場セグメント
- 比較:コンポーネント別
- ITインフラストラクチャ
- 一般建設
- 電力管理システム
- 冷却システム
- その他
- 市場機会:コンポーネント別
第10章 顧客情勢
- 顧客情勢の概要
第11章 地域別情勢
- 地域別セグメンテーション
- 地域別比較
- 北米
- アジア太平洋
- 欧州
- 南米
- 中東・アフリカ
- 米国
- カナダ
- 中国
- ドイツ
- 英国
- メキシコ
- 日本
- フランス
- ブラジル
- インド
- 市場機会:地域情勢別
第12章 促進要因・課題・機会・抑制要因
- 市場促進要因
- 市場の課題
- 促進要因と課題の影響
- 市場の機会・抑制要因
第13章 競合情勢
- 概要
- 競合情勢
- 混乱の状況
- 業界のリスク
第14章 競合分析
- 企業プロファイル
- 企業ランキング指数
- 企業の市場ポジショニング
- Compass Datacenters LLC
- DC BLOX Inc.
- Eaton Corp plc
- EdgeConneX Inc.
- Equinix Inc.
- Friedhelm Loh Stiftung and Co. KG
- Fujitsu Ltd.
- Hewlett Packard Enterprise Co.
- Hitachi Ltd.
- Huawei Technologies Co. Ltd.
- International Business Machines Corp.
- Panduit Corp.
- Schneider Electric SE
- Vertiv Holdings Co.
第15章 付録
Exhibits:
- Exhibits1: Executive Summary - Chart on Market Overview
- Exhibits2: Executive Summary - Data Table on Market Overview
- Exhibits3: Executive Summary - Chart on Global Market Characteristics
- Exhibits4: Executive Summary - Chart on Market By Geographical Landscape
- Exhibits5: Executive Summary - Chart on Market Segmentation by End-user
- Exhibits6: Executive Summary - Chart on Market Segmentation by Component
- Exhibits7: Executive Summary - Chart on Incremental Growth
- Exhibits8: Executive Summary - Data Table on Incremental Growth
- Exhibits9: Executive Summary - Chart on Company Market Positioning
- Exhibits10: Analysis of price sensitivity, lifecycle, customer purchase basket, adoption rates, and purchase criteria
- Exhibits11: Overview on criticality of inputs and factors of differentiation
- Exhibits12: Overview on factors of disruption
- Exhibits13: Impact of drivers and challenges in 2024 and 2029
- Exhibits14: Parent Market
- Exhibits15: Data Table on - Parent Market
- Exhibits16: Market characteristics analysis
- Exhibits17: Value chain analysis
- Exhibits18: Offerings of companies included in the market definition
- Exhibits19: Market segments
- Exhibits20: Chart on Global - Market size and forecast 2024-2029 ($ million)
- Exhibits21: Data Table on Global - Market size and forecast 2024-2029 ($ million)
- Exhibits22: Chart on Global Market: Year-over-year growth 2024-2029 (%)
- Exhibits23: Data Table on Global Market: Year-over-year growth 2024-2029 (%)
- Exhibits24: Historic Market Size - Data Table on Global Edge Data Center Market 2019 - 2023 ($ million)
- Exhibits25: Historic Market Size - End-user Segment 2019 - 2023 ($ million)
- Exhibits26: Historic Market Size - Component Segment 2019 - 2023 ($ million)
- Exhibits27: Historic Market Size - Geography Segment 2019 - 2023 ($ million)
- Exhibits28: Historic Market Size - Country Segment 2019 - 2023 ($ million)
- Exhibits29: Five forces analysis - Comparison between 2024 and 2029
- Exhibits30: Bargaining power of buyers - Impact of key factors 2024 and 2029
- Exhibits31: Bargaining power of suppliers - Impact of key factors in 2024 and 2029
- Exhibits32: Threat of new entrants - Impact of key factors in 2024 and 2029
- Exhibits33: Threat of substitutes - Impact of key factors in 2024 and 2029
- Exhibits34: Threat of rivalry - Impact of key factors in 2024 and 2029
- Exhibits35: Chart on Market condition - Five forces 2024 and 2029
- Exhibits36: Chart on End-user - Market share 2024-2029 (%)
- Exhibits37: Data Table on End-user - Market share 2024-2029 (%)
- Exhibits38: Chart on Comparison by End-user
- Exhibits39: Data Table on Comparison by End-user
- Exhibits40: Chart on IT and telecommunication - Market size and forecast 2024-2029 ($ million)
- Exhibits41: Data Table on IT and telecommunication - Market size and forecast 2024-2029 ($ million)
- Exhibits42: Chart on IT and telecommunication - Year-over-year growth 2024-2029 (%)
- Exhibits43: Data Table on IT and telecommunication - Year-over-year growth 2024-2029 (%)
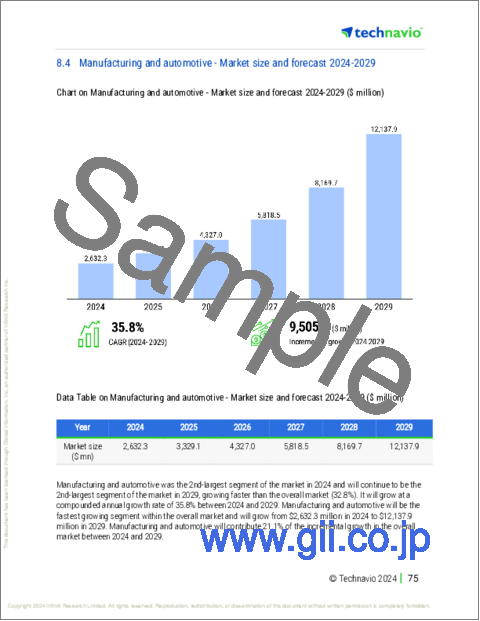
- Exhibits44: Chart on Manufacturing and automotive - Market size and forecast 2024-2029 ($ million)
- Exhibits45: Data Table on Manufacturing and automotive - Market size and forecast 2024-2029 ($ million)
- Exhibits46: Chart on Manufacturing and automotive - Year-over-year growth 2024-2029 (%)
- Exhibits47: Data Table on Manufacturing and automotive - Year-over-year growth 2024-2029 (%)
- Exhibits48: Chart on BFSI - Market size and forecast 2024-2029 ($ million)
- Exhibits49: Data Table on BFSI - Market size and forecast 2024-2029 ($ million)
- Exhibits50: Chart on BFSI - Year-over-year growth 2024-2029 (%)
- Exhibits51: Data Table on BFSI - Year-over-year growth 2024-2029 (%)
- Exhibits52: Chart on Healthcare and life sciences - Market size and forecast 2024-2029 ($ million)
- Exhibits53: Data Table on Healthcare and life sciences - Market size and forecast 2024-2029 ($ million)
- Exhibits54: Chart on Healthcare and life sciences - Year-over-year growth 2024-2029 (%)
- Exhibits55: Data Table on Healthcare and life sciences - Year-over-year growth 2024-2029 (%)
- Exhibits56: Chart on Others - Market size and forecast 2024-2029 ($ million)
- Exhibits57: Data Table on Others - Market size and forecast 2024-2029 ($ million)
- Exhibits58: Chart on Others - Year-over-year growth 2024-2029 (%)
- Exhibits59: Data Table on Others - Year-over-year growth 2024-2029 (%)
- Exhibits60: Market opportunity by End-user ($ million)
- Exhibits61: Data Table on Market opportunity by End-user ($ million)
- Exhibits62: Chart on Component - Market share 2024-2029 (%)
- Exhibits63: Data Table on Component - Market share 2024-2029 (%)
- Exhibits64: Chart on Comparison by Component
- Exhibits65: Data Table on Comparison by Component
- Exhibits66: Chart on IT infrastructure - Market size and forecast 2024-2029 ($ million)
- Exhibits67: Data Table on IT infrastructure - Market size and forecast 2024-2029 ($ million)
- Exhibits68: Chart on IT infrastructure - Year-over-year growth 2024-2029 (%)
- Exhibits69: Data Table on IT infrastructure - Year-over-year growth 2024-2029 (%)
- Exhibits70: Chart on General construction - Market size and forecast 2024-2029 ($ million)
- Exhibits71: Data Table on General construction - Market size and forecast 2024-2029 ($ million)
- Exhibits72: Chart on General construction - Year-over-year growth 2024-2029 (%)
- Exhibits73: Data Table on General construction - Year-over-year growth 2024-2029 (%)
- Exhibits74: Chart on Power management systems - Market size and forecast 2024-2029 ($ million)
- Exhibits75: Data Table on Power management systems - Market size and forecast 2024-2029 ($ million)
- Exhibits76: Chart on Power management systems - Year-over-year growth 2024-2029 (%)
- Exhibits77: Data Table on Power management systems - Year-over-year growth 2024-2029 (%)
- Exhibits78: Chart on Cooling systems - Market size and forecast 2024-2029 ($ million)
- Exhibits79: Data Table on Cooling systems - Market size and forecast 2024-2029 ($ million)
- Exhibits80: Chart on Cooling systems - Year-over-year growth 2024-2029 (%)
- Exhibits81: Data Table on Cooling systems - Year-over-year growth 2024-2029 (%)
- Exhibits82: Chart on Others - Market size and forecast 2024-2029 ($ million)
- Exhibits83: Data Table on Others - Market size and forecast 2024-2029 ($ million)
- Exhibits84: Chart on Others - Year-over-year growth 2024-2029 (%)
- Exhibits85: Data Table on Others - Year-over-year growth 2024-2029 (%)
- Exhibits86: Market opportunity by Component ($ million)
- Exhibits87: Data Table on Market opportunity by Component ($ million)
- Exhibits88: Analysis of price sensitivity, lifecycle, customer purchase basket, adoption rates, and purchase criteria
- Exhibits89: Chart on Market share By Geographical Landscape 2024-2029 (%)
- Exhibits90: Data Table on Market share By Geographical Landscape 2024-2029 (%)
- Exhibits91: Chart on Geographic comparison
- Exhibits92: Data Table on Geographic comparison
- Exhibits93: Chart on North America - Market size and forecast 2024-2029 ($ million)
- Exhibits94: Data Table on North America - Market size and forecast 2024-2029 ($ million)
- Exhibits95: Chart on North America - Year-over-year growth 2024-2029 (%)
- Exhibits96: Data Table on North America - Year-over-year growth 2024-2029 (%)
- Exhibits97: Chart on APAC - Market size and forecast 2024-2029 ($ million)
- Exhibits98: Data Table on APAC - Market size and forecast 2024-2029 ($ million)
- Exhibits99: Chart on APAC - Year-over-year growth 2024-2029 (%)
- Exhibits100: Data Table on APAC - Year-over-year growth 2024-2029 (%)
- Exhibits101: Chart on Europe - Market size and forecast 2024-2029 ($ million)
- Exhibits102: Data Table on Europe - Market size and forecast 2024-2029 ($ million)
- Exhibits103: Chart on Europe - Year-over-year growth 2024-2029 (%)
- Exhibits104: Data Table on Europe - Year-over-year growth 2024-2029 (%)
- Exhibits105: Chart on South America - Market size and forecast 2024-2029 ($ million)
- Exhibits106: Data Table on South America - Market size and forecast 2024-2029 ($ million)
- Exhibits107: Chart on South America - Year-over-year growth 2024-2029 (%)
- Exhibits108: Data Table on South America - Year-over-year growth 2024-2029 (%)
- Exhibits109: Chart on Middle East and Africa - Market size and forecast 2024-2029 ($ million)
- Exhibits110: Data Table on Middle East and Africa - Market size and forecast 2024-2029 ($ million)
- Exhibits111: Chart on Middle East and Africa - Year-over-year growth 2024-2029 (%)
- Exhibits112: Data Table on Middle East and Africa - Year-over-year growth 2024-2029 (%)
- Exhibits113: Chart on US - Market size and forecast 2024-2029 ($ million)
- Exhibits114: Data Table on US - Market size and forecast 2024-2029 ($ million)
- Exhibits115: Chart on US - Year-over-year growth 2024-2029 (%)
- Exhibits116: Data Table on US - Year-over-year growth 2024-2029 (%)
- Exhibits117: Chart on Canada - Market size and forecast 2024-2029 ($ million)
- Exhibits118: Data Table on Canada - Market size and forecast 2024-2029 ($ million)
- Exhibits119: Chart on Canada - Year-over-year growth 2024-2029 (%)
- Exhibits120: Data Table on Canada - Year-over-year growth 2024-2029 (%)
- Exhibits121: Chart on China - Market size and forecast 2024-2029 ($ million)
- Exhibits122: Data Table on China - Market size and forecast 2024-2029 ($ million)
- Exhibits123: Chart on China - Year-over-year growth 2024-2029 (%)
- Exhibits124: Data Table on China - Year-over-year growth 2024-2029 (%)
- Exhibits125: Chart on Germany - Market size and forecast 2024-2029 ($ million)
- Exhibits126: Data Table on Germany - Market size and forecast 2024-2029 ($ million)
- Exhibits127: Chart on Germany - Year-over-year growth 2024-2029 (%)
- Exhibits128: Data Table on Germany - Year-over-year growth 2024-2029 (%)
- Exhibits129: Chart on UK - Market size and forecast 2024-2029 ($ million)
- Exhibits130: Data Table on UK - Market size and forecast 2024-2029 ($ million)
- Exhibits131: Chart on UK - Year-over-year growth 2024-2029 (%)
- Exhibits132: Data Table on UK - Year-over-year growth 2024-2029 (%)
- Exhibits133: Chart on Mexico - Market size and forecast 2024-2029 ($ million)
- Exhibits134: Data Table on Mexico - Market size and forecast 2024-2029 ($ million)
- Exhibits135: Chart on Mexico - Year-over-year growth 2024-2029 (%)
- Exhibits136: Data Table on Mexico - Year-over-year growth 2024-2029 (%)
- Exhibits137: Chart on Japan - Market size and forecast 2024-2029 ($ million)
- Exhibits138: Data Table on Japan - Market size and forecast 2024-2029 ($ million)
- Exhibits139: Chart on Japan - Year-over-year growth 2024-2029 (%)
- Exhibits140: Data Table on Japan - Year-over-year growth 2024-2029 (%)
- Exhibits141: Chart on France - Market size and forecast 2024-2029 ($ million)
- Exhibits142: Data Table on France - Market size and forecast 2024-2029 ($ million)
- Exhibits143: Chart on France - Year-over-year growth 2024-2029 (%)
- Exhibits144: Data Table on France - Year-over-year growth 2024-2029 (%)
- Exhibits145: Chart on Brazil - Market size and forecast 2024-2029 ($ million)
- Exhibits146: Data Table on Brazil - Market size and forecast 2024-2029 ($ million)
- Exhibits147: Chart on Brazil - Year-over-year growth 2024-2029 (%)
- Exhibits148: Data Table on Brazil - Year-over-year growth 2024-2029 (%)
- Exhibits149: Chart on India - Market size and forecast 2024-2029 ($ million)
- Exhibits150: Data Table on India - Market size and forecast 2024-2029 ($ million)
- Exhibits151: Chart on India - Year-over-year growth 2024-2029 (%)
- Exhibits152: Data Table on India - Year-over-year growth 2024-2029 (%)
- Exhibits153: Market opportunity By Geographical Landscape ($ million)
- Exhibits154: Data Tables on Market opportunity By Geographical Landscape ($ million)
- Exhibits155: Impact of drivers and challenges in 2024 and 2029
- Exhibits156: Overview on criticality of inputs and factors of differentiation
- Exhibits157: Overview on factors of disruption
- Exhibits158: Impact of key risks on business
- Exhibits159: Companies covered
- Exhibits160: Company ranking index
- Exhibits161: Matrix on companies position and classification
- Exhibits162: 365 Data Centers - Overview
- Exhibits163: 365 Data Centers - Product / Service
- Exhibits164: 365 Data Centers - Key offerings
- Exhibits165: SWOT
- Exhibits166: Compass Datacenters LLC - Overview
- Exhibits167: Compass Datacenters LLC - Product / Service
- Exhibits168: Compass Datacenters LLC - Key offerings
- Exhibits169: SWOT
- Exhibits170: DC BLOX Inc. - Overview
- Exhibits171: DC BLOX Inc. - Product / Service
- Exhibits172: DC BLOX Inc. - Key offerings
- Exhibits173: SWOT
- Exhibits174: Eaton Corp plc - Overview
- Exhibits175: Eaton Corp plc - Business segments
- Exhibits176: Eaton Corp plc - Key news
- Exhibits177: Eaton Corp plc - Key offerings
- Exhibits178: Eaton Corp plc - Segment focus
- Exhibits179: SWOT
- Exhibits180: EdgeConneX Inc. - Overview
- Exhibits181: EdgeConneX Inc. - Product / Service
- Exhibits182: EdgeConneX Inc. - Key offerings
- Exhibits183: SWOT
- Exhibits184: Equinix Inc. - Overview
- Exhibits185: Equinix Inc. - Business segments
- Exhibits186: Equinix Inc. - Key news
- Exhibits187: Equinix Inc. - Key offerings
- Exhibits188: Equinix Inc. - Segment focus
- Exhibits189: SWOT
- Exhibits190: Friedhelm Loh Stiftung and Co. KG - Overview
- Exhibits191: Friedhelm Loh Stiftung and Co. KG - Product / Service
- Exhibits192: Friedhelm Loh Stiftung and Co. KG - Key offerings
- Exhibits193: SWOT
- Exhibits194: Fujitsu Ltd. - Overview
- Exhibits195: Fujitsu Ltd. - Business segments
- Exhibits196: Fujitsu Ltd. - Key news
- Exhibits197: Fujitsu Ltd. - Key offerings
- Exhibits198: Fujitsu Ltd. - Segment focus
- Exhibits199: SWOT
- Exhibits200: Hewlett Packard Enterprise Co. - Overview
- Exhibits201: Hewlett Packard Enterprise Co. - Business segments
- Exhibits202: Hewlett Packard Enterprise Co. - Key news
- Exhibits203: Hewlett Packard Enterprise Co. - Key offerings
- Exhibits204: Hewlett Packard Enterprise Co. - Segment focus
- Exhibits205: SWOT
- Exhibits206: Hitachi Ltd. - Overview
- Exhibits207: Hitachi Ltd. - Business segments
- Exhibits208: Hitachi Ltd. - Key news
- Exhibits209: Hitachi Ltd. - Key offerings
- Exhibits210: Hitachi Ltd. - Segment focus
- Exhibits211: SWOT
- Exhibits212: Huawei Technologies Co. Ltd. - Overview
- Exhibits213: Huawei Technologies Co. Ltd. - Product / Service
- Exhibits214: Huawei Technologies Co. Ltd. - Key news
- Exhibits215: Huawei Technologies Co. Ltd. - Key offerings
- Exhibits216: SWOT
- Exhibits217: International Business Machines Corp. - Overview
- Exhibits218: International Business Machines Corp. - Business segments
- Exhibits219: Int
Edge Data Center Market 2025-2029
The edge data center market is forecasted to grow by USD 45102 mn during 2024-2029, accelerating at a CAGR of 32.8% during the forecast period. The report on the edge data center market provides a holistic analysis, market size and forecast, trends, growth drivers, and challenges, as well as vendor analysis covering around 25 vendors.
The report offers an up-to-date analysis regarding the current market scenario, the latest trends and drivers, and the overall market environment. The market is driven by rising demand for video streaming services, rise in adoption of multi-cloud and network upgrades to support 5g, and increasing mobile data traffic.
| Market Scope | |
|---|---|
| Base Year | 2025 |
| End Year | 2029 |
| Series Year | 2025-2029 |
| Growth Momentum | Accelerate |
| YOY 2025 | 24.8% |
| CAGR | 32.8% |
| Incremental Value | $45102 mn |
Technavio's edge data center market is segmented as below:
By End-user
- IT and telecommunication
- Manufacturing and automotive
- BFSI
- Healthcare and life sciences
- Others
By Component
- IT infrastructure
- General construction
- Power management systems
- Cooling systems
- Others
By Geographical Landscape
- North America
- APAC
- Europe
- South America
- Middle East and Africa
This study identifies the implementation of ai in data centers as one of the prime reasons driving the edge data center market growth during the next few years. Also, increased adoption of hpc across enterprises and consolidation of edge data centers will lead to sizable demand in the market.
The report on the edge data center market covers the following areas:
- Edge Data Center Market sizing
- Edge Data Center Market forecast
- Edge Data Center Market industry analysis
The robust vendor analysis is designed to help clients improve their market position, and in line with this, this report provides a detailed analysis of several leading edge data center market vendors that include 365 Data Centers, Compass Datacenters LLC, DC BLOX Inc., Dell Technologies Inc., Digital Realty Trust Inc., Eaton Corp plc, EdgeConneX Inc., Equinix Inc., Flexential Corp., Friedhelm Loh Stiftung and Co. KG, Fujitsu Ltd., Hewlett Packard Enterprise Co., Hitachi Ltd., Huawei Technologies Co. Ltd., International Business Machines Corp., Johnson Controls International Plc, Panduit Corp., Schneider Electric SE, Vapor IO Inc., and Vertiv Holdings Co.. Also, the edge data center market analysis report includes information on upcoming trends and challenges that will influence market growth. This is to help companies strategize and leverage all forthcoming growth opportunities.
The study was conducted using an objective combination of primary and secondary information including inputs from key participants in the industry. The report contains a comprehensive market and vendor landscape in addition to an analysis of the key vendors.
The publisher presents a detailed picture of the market by the way of study, synthesis, and summation of data from multiple sources by an analysis of key parameters such as profit, pricing, competition, and promotions. It presents various market facets by identifying the key industry influencers. The data presented is comprehensive, reliable, and a result of extensive primary and secondary research. The market research reports provide a complete competitive landscape and an in-depth vendor selection methodology and analysis using qualitative and quantitative research to forecast accurate market growth.
Table of Contents
1 Executive Summary
- 1.1 Market overview
- Executive Summary - Chart on Market Overview
- Executive Summary - Data Table on Market Overview
- Executive Summary - Chart on Global Market Characteristics
- Executive Summary - Chart on Market By Geographical Landscape
- Executive Summary - Chart on Market Segmentation by End-user
- Executive Summary - Chart on Market Segmentation by Component
- Executive Summary - Chart on Incremental Growth
- Executive Summary - Data Table on Incremental Growth
- Executive Summary - Chart on Company Market Positioning
2 Technavio Analysis
- 2.1 Analysis of price sensitivity, lifecycle, customer purchase basket, adoption rates, and purchase criteria
- Analysis of price sensitivity, lifecycle, customer purchase basket, adoption rates, and purchase criteria
- 2.2 Criticality of inputs and Factors of differentiation
- Overview on criticality of inputs and factors of differentiation
- 2.3 Factors of disruption
- Overview on factors of disruption
- 2.4 Impact of drivers and challenges
- Impact of drivers and challenges in 2024 and 2029
3 Market Landscape
- 3.1 Market ecosystem
- Parent Market
- Data Table on - Parent Market
- 3.2 Market characteristics
- Market characteristics analysis
- 3.3 Value chain analysis
- Value chain analysis
4 Market Sizing
- 4.1 Market definition
- Offerings of companies included in the market definition
- 4.2 Market segment analysis
- Market segments
- 4.3 Market size 2024
- 4.4 Market outlook: Forecast for 2024-2029
- Chart on Global - Market size and forecast 2024-2029 ($ million)
- Data Table on Global - Market size and forecast 2024-2029 ($ million)
- Chart on Global Market: Year-over-year growth 2024-2029 (%)
- Data Table on Global Market: Year-over-year growth 2024-2029 (%)
5 Historic Market Size
- 5.1 Global Edge Data Center Market 2019 - 2023
- Historic Market Size - Data Table on Global Edge Data Center Market 2019 - 2023 ($ million)
- 5.2 End-user segment analysis 2019 - 2023
- Historic Market Size - End-user Segment 2019 - 2023 ($ million)
- 5.3 Component segment analysis 2019 - 2023
- Historic Market Size - Component Segment 2019 - 2023 ($ million)
- 5.4 Geography segment analysis 2019 - 2023
- Historic Market Size - Geography Segment 2019 - 2023 ($ million)
- 5.5 Country segment analysis 2019 - 2023
- Historic Market Size - Country Segment 2019 - 2023 ($ million)
6 Qualitative Analysis
- 6.1 Impact of AI on Global Edge Data Center Market
7 Five Forces Analysis
- 7.1 Five forces summary
- Five forces analysis - Comparison between 2024 and 2029
- 7.2 Bargaining power of buyers
- Bargaining power of buyers - Impact of key factors 2024 and 2029
- 7.3 Bargaining power of suppliers
- Bargaining power of suppliers - Impact of key factors in 2024 and 2029
- 7.4 Threat of new entrants
- Threat of new entrants - Impact of key factors in 2024 and 2029
- 7.5 Threat of substitutes
- Threat of substitutes - Impact of key factors in 2024 and 2029
- 7.6 Threat of rivalry
- Threat of rivalry - Impact of key factors in 2024 and 2029
- 7.7 Market condition
- Chart on Market condition - Five forces 2024 and 2029
8 Market Segmentation by End-user
- 8.1 Market segments
- Chart on End-user - Market share 2024-2029 (%)
- Data Table on End-user - Market share 2024-2029 (%)
- 8.2 Comparison by End-user
- Chart on Comparison by End-user
- Data Table on Comparison by End-user
- 8.3 IT and telecommunication - Market size and forecast 2024-2029
- Chart on IT and telecommunication - Market size and forecast 2024-2029 ($ million)
- Data Table on IT and telecommunication - Market size and forecast 2024-2029 ($ million)
- Chart on IT and telecommunication - Year-over-year growth 2024-2029 (%)
- Data Table on IT and telecommunication - Year-over-year growth 2024-2029 (%)
- 8.4 Manufacturing and automotive - Market size and forecast 2024-2029
- Chart on Manufacturing and automotive - Market size and forecast 2024-2029 ($ million)
- Data Table on Manufacturing and automotive - Market size and forecast 2024-2029 ($ million)
- Chart on Manufacturing and automotive - Year-over-year growth 2024-2029 (%)
- Data Table on Manufacturing and automotive - Year-over-year growth 2024-2029 (%)
- 8.5 BFSI - Market size and forecast 2024-2029
- Chart on BFSI - Market size and forecast 2024-2029 ($ million)
- Data Table on BFSI - Market size and forecast 2024-2029 ($ million)
- Chart on BFSI - Year-over-year growth 2024-2029 (%)
- Data Table on BFSI - Year-over-year growth 2024-2029 (%)
- 8.6 Healthcare and life sciences - Market size and forecast 2024-2029
- Chart on Healthcare and life sciences - Market size and forecast 2024-2029 ($ million)
- Data Table on Healthcare and life sciences - Market size and forecast 2024-2029 ($ million)
- Chart on Healthcare and life sciences - Year-over-year growth 2024-2029 (%)
- Data Table on Healthcare and life sciences - Year-over-year growth 2024-2029 (%)
- 8.7 Others - Market size and forecast 2024-2029
- Chart on Others - Market size and forecast 2024-2029 ($ million)
- Data Table on Others - Market size and forecast 2024-2029 ($ million)
- Chart on Others - Year-over-year growth 2024-2029 (%)
- Data Table on Others - Year-over-year growth 2024-2029 (%)
- 8.8 Market opportunity by End-user
- Market opportunity by End-user ($ million)
- Data Table on Market opportunity by End-user ($ million)
9 Market Segmentation by Component
- 9.1 Market segments
- Chart on Component - Market share 2024-2029 (%)
- Data Table on Component - Market share 2024-2029 (%)
- 9.2 Comparison by Component
- Chart on Comparison by Component
- Data Table on Comparison by Component
- 9.3 IT infrastructure - Market size and forecast 2024-2029
- Chart on IT infrastructure - Market size and forecast 2024-2029 ($ million)
- Data Table on IT infrastructure - Market size and forecast 2024-2029 ($ million)
- Chart on IT infrastructure - Year-over-year growth 2024-2029 (%)
- Data Table on IT infrastructure - Year-over-year growth 2024-2029 (%)
- 9.4 General construction - Market size and forecast 2024-2029
- Chart on General construction - Market size and forecast 2024-2029 ($ million)
- Data Table on General construction - Market size and forecast 2024-2029 ($ million)
- Chart on General construction - Year-over-year growth 2024-2029 (%)
- Data Table on General construction - Year-over-year growth 2024-2029 (%)
- 9.5 Power management systems - Market size and forecast 2024-2029
- Chart on Power management systems - Market size and forecast 2024-2029 ($ million)
- Data Table on Power management systems - Market size and forecast 2024-2029 ($ million)
- Chart on Power management systems - Year-over-year growth 2024-2029 (%)
- Data Table on Power management systems - Year-over-year growth 2024-2029 (%)
- 9.6 Cooling systems - Market size and forecast 2024-2029
- Chart on Cooling systems - Market size and forecast 2024-2029 ($ million)
- Data Table on Cooling systems - Market size and forecast 2024-2029 ($ million)
- Chart on Cooling systems - Year-over-year growth 2024-2029 (%)
- Data Table on Cooling systems - Year-over-year growth 2024-2029 (%)
- 9.7 Others - Market size and forecast 2024-2029
- Chart on Others - Market size and forecast 2024-2029 ($ million)
- Data Table on Others - Market size and forecast 2024-2029 ($ million)
- Chart on Others - Year-over-year growth 2024-2029 (%)
- Data Table on Others - Year-over-year growth 2024-2029 (%)
- 9.8 Market opportunity by Component
- Market opportunity by Component ($ million)
- Data Table on Market opportunity by Component ($ million)
10 Customer Landscape
- 10.1 Customer landscape overview
- Analysis of price sensitivity, lifecycle, customer purchase basket, adoption rates, and purchase criteria
11 Geographic Landscape
- 11.1 Geographic segmentation
- Chart on Market share By Geographical Landscape 2024-2029 (%)
- Data Table on Market share By Geographical Landscape 2024-2029 (%)
- 11.2 Geographic comparison
- Chart on Geographic comparison
- Data Table on Geographic comparison
- 11.3 North America - Market size and forecast 2024-2029
- Chart on North America - Market size and forecast 2024-2029 ($ million)
- Data Table on North America - Market size and forecast 2024-2029 ($ million)
- Chart on North America - Year-over-year growth 2024-2029 (%)
- Data Table on North America - Year-over-year growth 2024-2029 (%)
- 11.4 APAC - Market size and forecast 2024-2029
- Chart on APAC - Market size and forecast 2024-2029 ($ million)
- Data Table on APAC - Market size and forecast 2024-2029 ($ million)
- Chart on APAC - Year-over-year growth 2024-2029 (%)
- Data Table on APAC - Year-over-year growth 2024-2029 (%)
- 11.5 Europe - Market size and forecast 2024-2029
- Chart on Europe - Market size and forecast 2024-2029 ($ million)
- Data Table on Europe - Market size and forecast 2024-2029 ($ million)
- Chart on Europe - Year-over-year growth 2024-2029 (%)
- Data Table on Europe - Year-over-year growth 2024-2029 (%)
- 11.6 South America - Market size and forecast 2024-2029
- Chart on South America - Market size and forecast 2024-2029 ($ million)
- Data Table on South America - Market size and forecast 2024-2029 ($ million)
- Chart on South America - Year-over-year growth 2024-2029 (%)
- Data Table on South America - Year-over-year growth 2024-2029 (%)
- 11.7 Middle East and Africa - Market size and forecast 2024-2029
- Chart on Middle East and Africa - Market size and forecast 2024-2029 ($ million)
- Data Table on Middle East and Africa - Market size and forecast 2024-2029 ($ million)
- Chart on Middle East and Africa - Year-over-year growth 2024-2029 (%)
- Data Table on Middle East and Africa - Year-over-year growth 2024-2029 (%)
- 11.8 US - Market size and forecast 2024-2029
- Chart on US - Market size and forecast 2024-2029 ($ million)
- Data Table on US - Market size and forecast 2024-2029 ($ million)
- Chart on US - Year-over-year growth 2024-2029 (%)
- Data Table on US - Year-over-year growth 2024-2029 (%)
- 11.9 Canada - Market size and forecast 2024-2029
- Chart on Canada - Market size and forecast 2024-2029 ($ million)
- Data Table on Canada - Market size and forecast 2024-2029 ($ million)
- Chart on Canada - Year-over-year growth 2024-2029 (%)
- Data Table on Canada - Year-over-year growth 2024-2029 (%)
- 11.10 China - Market size and forecast 2024-2029
- Chart on China - Market size and forecast 2024-2029 ($ million)
- Data Table on China - Market size and forecast 2024-2029 ($ million)
- Chart on China - Year-over-year growth 2024-2029 (%)
- Data Table on China - Year-over-year growth 2024-2029 (%)
- 11.11 Germany - Market size and forecast 2024-2029
- Chart on Germany - Market size and forecast 2024-2029 ($ million)
- Data Table on Germany - Market size and forecast 2024-2029 ($ million)
- Chart on Germany - Year-over-year growth 2024-2029 (%)
- Data Table on Germany - Year-over-year growth 2024-2029 (%)
- 11.12 UK - Market size and forecast 2024-2029
- Chart on UK - Market size and forecast 2024-2029 ($ million)
- Data Table on UK - Market size and forecast 2024-2029 ($ million)
- Chart on UK - Year-over-year growth 2024-2029 (%)
- Data Table on UK - Year-over-year growth 2024-2029 (%)
- 11.13 Mexico - Market size and forecast 2024-2029
- Chart on Mexico - Market size and forecast 2024-2029 ($ million)
- Data Table on Mexico - Market size and forecast 2024-2029 ($ million)
- Chart on Mexico - Year-over-year growth 2024-2029 (%)
- Data Table on Mexico - Year-over-year growth 2024-2029 (%)
- 11.14 Japan - Market size and forecast 2024-2029
- Chart on Japan - Market size and forecast 2024-2029 ($ million)
- Data Table on Japan - Market size and forecast 2024-2029 ($ million)
- Chart on Japan - Year-over-year growth 2024-2029 (%)
- Data Table on Japan - Year-over-year growth 2024-2029 (%)
- 11.15 France - Market size and forecast 2024-2029
- Chart on France - Market size and forecast 2024-2029 ($ million)
- Data Table on France - Market size and forecast 2024-2029 ($ million)
- Chart on France - Year-over-year growth 2024-2029 (%)
- Data Table on France - Year-over-year growth 2024-2029 (%)
- 11.16 Brazil - Market size and forecast 2024-2029
- Chart on Brazil - Market size and forecast 2024-2029 ($ million)
- Data Table on Brazil - Market size and forecast 2024-2029 ($ million)
- Chart on Brazil - Year-over-year growth 2024-2029 (%)
- Data Table on Brazil - Year-over-year growth 2024-2029 (%)
- 11.17 India - Market size and forecast 2024-2029
- Chart on India - Market size and forecast 2024-2029 ($ million)
- Data Table on India - Market size and forecast 2024-2029 ($ million)
- Chart on India - Year-over-year growth 2024-2029 (%)
- Data Table on India - Year-over-year growth 2024-2029 (%)
- 11.18 Market opportunity By Geographical Landscape
- Market opportunity By Geographical Landscape ($ million)
- Data Tables on Market opportunity By Geographical Landscape ($ million)
12 Drivers, Challenges, and Opportunity/Restraints
- 12.1 Market drivers
- 12.2 Market challenges
- 12.3 Impact of drivers and challenges
- Impact of drivers and challenges in 2024 and 2029
- 12.4 Market opportunities/restraints
13 Competitive Landscape
- 13.1 Overview
- 13.2 Competitive Landscape
- Overview on criticality of inputs and factors of differentiation
- 13.3 Landscape disruption
- Overview on factors of disruption
- 13.4 Industry risks
- Impact of key risks on business
14 Competitive Analysis
- 14.1 Companies profiled
- Companies covered
- 14.2 Company ranking index
- Company ranking index
- 14.3 Market positioning of companies
- Matrix on companies position and classification
- 365 Data Centers
- 365 Data Centers - Overview
- 365 Data Centers - Product / Service
- 365 Data Centers - Key offerings
- SWOT
- 14.5 Compass Datacenters LLC
- Compass Datacenters LLC - Overview
- Compass Datacenters LLC - Product / Service
- Compass Datacenters LLC - Key offerings
- SWOT
- 14.6 DC BLOX Inc.
- DC BLOX Inc. - Overview
- DC BLOX Inc. - Product / Service
- DC BLOX Inc. - Key offerings
- SWOT
- 14.7 Eaton Corp plc
- Eaton Corp plc - Overview
- Eaton Corp plc - Business segments
- Eaton Corp plc - Key news
- Eaton Corp plc - Key offerings
- Eaton Corp plc - Segment focus
- SWOT
- 14.8 EdgeConneX Inc.
- EdgeConneX Inc. - Overview
- EdgeConneX Inc. - Product / Service
- EdgeConneX Inc. - Key offerings
- SWOT
- 14.9 Equinix Inc.
- Equinix Inc. - Overview
- Equinix Inc. - Business segments
- Equinix Inc. - Key news
- Equinix Inc. - Key offerings
- Equinix Inc. - Segment focus
- SWOT
- 14.10 Friedhelm Loh Stiftung and Co. KG
- Friedhelm Loh Stiftung and Co. KG - Overview
- Friedhelm Loh Stiftung and Co. KG - Product / Service
- Friedhelm Loh Stiftung and Co. KG - Key offerings
- SWOT
- 14.11 Fujitsu Ltd.
- Fujitsu Ltd. - Overview
- Fujitsu Ltd. - Business segments
- Fujitsu Ltd. - Key news
- Fujitsu Ltd. - Key offerings
- Fujitsu Ltd. - Segment focus
- SWOT
- 14.12 Hewlett Packard Enterprise Co.
- Hewlett Packard Enterprise Co. - Overview
- Hewlett Packard Enterprise Co. - Business segments
- Hewlett Packard Enterprise Co. - Key news
- Hewlett Packard Enterprise Co. - Key offerings
- Hewlett Packard Enterprise Co. - Segment focus
- SWOT
- 14.13 Hitachi Ltd.
- Hitachi Ltd. - Overview
- Hitachi Ltd. - Business segments
- Hitachi Ltd. - Key news
- Hitachi Ltd. - Key offerings
- Hitachi Ltd. - Segment focus
- SWOT
- 14.14 Huawei Technologies Co. Ltd.
- Huawei Technologies Co. Ltd. - Overview
- Huawei Technologies Co. Ltd. - Product / Service
- Huawei Technologies Co. Ltd. - Key news
- Huawei Technologies Co. Ltd. - Key offerings
- SWOT
- 14.15 International Business Machines Corp.
- International Business Machines Corp. - Overview
- International Business Machines Corp. - Business segments
- International Business Machines Corp. - Key news
- International Business Machines Corp. - Key offerings
- International Business Machines Corp. - Segment focus
- SWOT
- 14.16 Panduit Corp.
- Panduit Corp. - Overview
- Panduit Corp. - Product / Service
- Panduit Corp. - Key offerings
- SWOT
- 14.17 Schneider Electric SE
- Schneider Electric SE - Overview
- Schneider Electric SE - Business segments
- Schneider Electric SE - Key news
- Schneider Electric SE - Key offerings
- Schneider Electric SE - Segment focus
- SWOT
- 14.18 Vertiv Holdings Co.
- Vertiv Holdings Co. - Overview
- Vertiv Holdings Co. - Business segments
- Vertiv Holdings Co. - Key offerings
- Vertiv Holdings Co. - Segment focus
- SWOT
15 Appendix
- 15.1 Scope of the report
- 15.2 Inclusions and exclusions checklist
- Inclusions checklist
- Exclusions checklist
- 15.3 Currency conversion rates for US$
- Currency conversion rates for US$
- 15.4 Research methodology
- Research methodology
- 15.5 Data procurement
- Information sources
- 15.6 Data validation
- Data validation
- 15.7 Validation techniques employed for market sizing
- Validation techniques employed for market sizing
- 15.8 Data synthesis
- Data synthesis
- 15.9 360 degree market analysis
- 360 degree market analysis
- 15.10 List of abbreviations
- List of abbreviations

