|
|
市場調査レポート
商品コード
1685012
農業用アジュバントの世界市場 2025-2029Global Agricultural Adjuvant Market 2025-2029 |
||||||
|
|||||||
カスタマイズ可能
|
|||||||

| 農業用アジュバントの世界市場 2025-2029 |
|
出版日: 2025年03月06日
発行: TechNavio
ページ情報: 英文 241 Pages
納期: 即納可能
|

全表示
- 概要
- 図表
- 目次
農業用アジュバント市場は2024年から2029年に12億9,710万米ドル成長し、予測期間中のCAGRは5.7%で成長すると予測されます。
当レポートでは、農業用アジュバント市場の全体的な分析、市場規模、予測、動向、成長促進要因、課題、約25のベンダーを網羅したベンダー分析などを掲載しています。
現在の市場シナリオ、最新動向と促進要因、市場環境全体に関する最新分析を提供しています。市場は、除草剤使用の増加、新興国市場における農業用アジュバント需要の増加、耕地面積の減少によって牽引されています。
| 市場範囲 | |
|---|---|
| 基準年 | 2025年 |
| 終了年 | 2029年 |
| 予測期間 | 2025年~2029年 |
| 成長モメンタム | 加速 |
| 前年比2025年 | 5.3% |
| CAGR | 5.7% |
| 増分額 | 12億9,710万米ドル |
本調査は、業界の主要参加者からのインプットを含め、一次情報と二次情報を客観的に組み合わせて実施しました。レポートには、主要企業の分析に加え、包括的な市場規模データ、地域分析によるセグメント、ベンダー情勢が含まれています。レポートには履歴データと予測データがあります。
本調査では、今後数年間の農業用アジュバント市場の成長を促進する主な理由の一つとして、精密農業の採用が増加していることを挙げています。また、農業用アジュバントにおいて持続可能な農業が重視され、生物学的製剤の使用が増加していることも、市場の大きな需要につながると考えられます。
目次
第1章 エグゼクティブサマリー
- 市場概要
第2章 Technavio分析
- 価格・ライフサイクル・顧客購入バスケット・採用率・購入基準の分析
- インプットの重要性と差別化の要因
- 混乱の要因
- 促進要因と課題の影響
第3章 市場情勢
- 市場エコシステム
- 市場の特徴
- バリューチェーン分析
第4章 市場規模
- 市場の定義
- 市場セグメント分析
- 市場規模、2024年
- 市場の見通し、2024年~2029年
第5章 市場規模実績
- 農業用アジュバントの世界市場、2019年~2023年
- タイプセグメント分析、2019年~2023年
- 用途セグメント分析、2019年~2023年
- 作物タイプセグメント分析、2019年~2023年
- 処方セグメント分析、2019年~2023年
- 地域別セグメント分析、2019年~2023年
- 国別セグメント分析、2019年~2023年
第6章 定性分析
- AIの影響:農業用アジュバントの世界市場
第7章 ファイブフォース分析
- ファイブフォースの要約
- 買い手の交渉力
- 供給企業の交渉力
- 新規参入業者の脅威
- 代替品の脅威
- 競争の脅威
- 市況
第8章 市場セグメンテーション:タイプ別
- 市場セグメント
- 比較:タイプ別
- 活性化補助剤:市場規模と予測、2024年~2029年
- ユーティリティアジュバント:市場規模と予測、2024年~2029年
- 市場機会:タイプ別
第9章 市場セグメンテーション:用途別
- 市場セグメント
- 比較:用途別
- 除草剤:市場規模と予測、2024年~2029年
- 殺菌剤:市場規模と予測、2024年~2029年
- 殺虫剤:市場規模と予測、2024年~2029年
- その他:市場規模と予測、2024年~2029年
- 市場機会:用途別
第10章 市場セグメンテーション:作物タイプ別
- 市場セグメント
- 比較:作物タイプ別
- 穀物:市場規模と予測、2024年~2029年
- 油糧種子・豆類:市場規模と予測、2024年~2029年
- 果物と野菜:市場規模と予測、2024年~2029年
- その他:市場規模と予測、2024年~2029年
- 市場機会:作物タイプ別
第11章 市場セグメンテーション:処方別
- 市場セグメント
- 比較:処方別
- 乳化濃縮剤:市場規模と予測、2024年~2029年
- 懸濁液濃縮物:市場規模と予測、2024年~2029年
- 市場機会:処方別
第12章 顧客情勢
- 顧客情勢の概要
第13章 地域別情勢
- 地域別セグメンテーション
- 地域別比較
- 北米:市場規模と予測、2024年~2029年
- 欧州:市場規模と予測、2024年~2029年
- アジア太平洋:市場規模と予測、2024年~2029年
- 南米:市場規模と予測、2024年~2029年
- 中東・アフリカ:市場規模と予測、2024年~2029年
- 米国:市場規模と予測、2024年~2029年
- 中国:市場規模と予測、2024年~2029年
- ドイツ:市場規模と予測、2024年~2029年
- 英国:市場規模と予測、2024年~2029年
- カナダ:市場規模と予測、2024年~2029年
- インド:市場規模と予測、2024年~2029年
- 日本:市場規模と予測、2024年~2029年
- ブラジル:市場規模と予測、2024年~2029年
- フランス:市場規模と予測、2024年~2029年
- イタリア:市場規模と予測、2024年~2029年
- 市場機会:地域情勢別
第14章 促進要因、課題、機会/抑制要因
- 市場促進要因
- 市場の課題
- 促進要因と課題の影響
- 市場の機会/抑制要因
第15章 競合情勢
- 概要
- 競合情勢
- 混乱の状況
- 業界のリスク
第16章 競合分析
- 企業プロファイル
- 企業ランキング指数
- 企業の市場ポジショニング
- BASF SE
- BRANDT Inc.
- Clariant International Ltd.
- Corteva Inc.
- Croda International Plc
- GarrCo Products Inc.
- Huntsman Corp.
- Interagro UK Ltd.
- Lamberti SpA
- Marubeni Corp.
- Nufarm Ltd.
- RAG Stiftung
- Simplot Grower Solutions
- Solvay SA
- Stepan Co.
第17章 付録
Exhibits:
- Exhibits1: Executive Summary - Chart on Market Overview
- Exhibits2: Executive Summary - Data Table on Market Overview
- Exhibits3: Executive Summary - Chart on Global Market Characteristics
- Exhibits4: Executive Summary - Chart on Market By Geographical Landscape
- Exhibits5: Executive Summary - Chart on Market Segmentation by Type
- Exhibits6: Executive Summary - Chart on Market Segmentation by Application
- Exhibits7: Executive Summary - Chart on Market Segmentation by Crop Type
- Exhibits8: Executive Summary - Chart on Market Segmentation by Formulation
- Exhibits9: Executive Summary - Chart on Incremental Growth
- Exhibits10: Executive Summary - Data Table on Incremental Growth
- Exhibits11: Executive Summary - Chart on Company Market Positioning
- Exhibits12: Analysis of price sensitivity, lifecycle, customer purchase basket, adoption rates, and purchase criteria
- Exhibits13: Overview on criticality of inputs and factors of differentiation
- Exhibits14: Overview on factors of disruption
- Exhibits15: Impact of drivers and challenges in 2024 and 2029
- Exhibits16: Parent Market
- Exhibits17: Data Table on - Parent Market
- Exhibits18: Market characteristics analysis
- Exhibits19: Value chain analysis
- Exhibits20: Offerings of companies included in the market definition
- Exhibits21: Market segments
- Exhibits22: Chart on Global - Market size and forecast 2024-2029 ($ million)
- Exhibits23: Data Table on Global - Market size and forecast 2024-2029 ($ million)
- Exhibits24: Chart on Global Market: Year-over-year growth 2024-2029 (%)
- Exhibits25: Data Table on Global Market: Year-over-year growth 2024-2029 (%)
- Exhibits26: Historic Market Size - Data Table on Global Agricultural Adjuvant Market 2019 - 2023 ($ million)
- Exhibits27: Historic Market Size - Type Segment 2019 - 2023 ($ million)
- Exhibits28: Historic Market Size - Application Segment 2019 - 2023 ($ million)
- Exhibits29: Historic Market Size - Crop Type Segment 2019 - 2023 ($ million)
- Exhibits30: Historic Market Size - Formulation Segment 2019 - 2023 ($ million)
- Exhibits31: Historic Market Size - Geography Segment 2019 - 2023 ($ million)
- Exhibits32: Historic Market Size - Country Segment 2019 - 2023 ($ million)
- Exhibits33: Five forces analysis - Comparison between 2024 and 2029
- Exhibits34: Bargaining power of buyers - Impact of key factors 2024 and 2029
- Exhibits35: Bargaining power of suppliers - Impact of key factors in 2024 and 2029
- Exhibits36: Threat of new entrants - Impact of key factors in 2024 and 2029
- Exhibits37: Threat of substitutes - Impact of key factors in 2024 and 2029
- Exhibits38: Threat of rivalry - Impact of key factors in 2024 and 2029
- Exhibits39: Chart on Market condition - Five forces 2024 and 2029
- Exhibits40: Chart on Type - Market share 2024-2029 (%)
- Exhibits41: Data Table on Type - Market share 2024-2029 (%)
- Exhibits42: Chart on Comparison by Type
- Exhibits43: Data Table on Comparison by Type
- Exhibits44: Chart on Activator adjuvants - Market size and forecast 2024-2029 ($ million)
- Exhibits45: Data Table on Activator adjuvants - Market size and forecast 2024-2029 ($ million)
- Exhibits46: Chart on Activator adjuvants - Year-over-year growth 2024-2029 (%)
- Exhibits47: Data Table on Activator adjuvants - Year-over-year growth 2024-2029 (%)
- Exhibits48: Chart on Utility adjuvants - Market size and forecast 2024-2029 ($ million)
- Exhibits49: Data Table on Utility adjuvants - Market size and forecast 2024-2029 ($ million)
- Exhibits50: Chart on Utility adjuvants - Year-over-year growth 2024-2029 (%)
- Exhibits51: Data Table on Utility adjuvants - Year-over-year growth 2024-2029 (%)
- Exhibits52: Market opportunity by Type ($ million)
- Exhibits53: Data Table on Market opportunity by Type ($ million)
- Exhibits54: Chart on Application - Market share 2024-2029 (%)
- Exhibits55: Data Table on Application - Market share 2024-2029 (%)
- Exhibits56: Chart on Comparison by Application
- Exhibits57: Data Table on Comparison by Application
- Exhibits58: Chart on Herbicide - Market size and forecast 2024-2029 ($ million)
- Exhibits59: Data Table on Herbicide - Market size and forecast 2024-2029 ($ million)
- Exhibits60: Chart on Herbicide - Year-over-year growth 2024-2029 (%)
- Exhibits61: Data Table on Herbicide - Year-over-year growth 2024-2029 (%)
- Exhibits62: Chart on Fungicide - Market size and forecast 2024-2029 ($ million)
- Exhibits63: Data Table on Fungicide - Market size and forecast 2024-2029 ($ million)
- Exhibits64: Chart on Fungicide - Year-over-year growth 2024-2029 (%)
- Exhibits65: Data Table on Fungicide - Year-over-year growth 2024-2029 (%)
- Exhibits66: Chart on Insecticide - Market size and forecast 2024-2029 ($ million)
- Exhibits67: Data Table on Insecticide - Market size and forecast 2024-2029 ($ million)
- Exhibits68: Chart on Insecticide - Year-over-year growth 2024-2029 (%)
- Exhibits69: Data Table on Insecticide - Year-over-year growth 2024-2029 (%)
- Exhibits70: Chart on Others - Market size and forecast 2024-2029 ($ million)
- Exhibits71: Data Table on Others - Market size and forecast 2024-2029 ($ million)
- Exhibits72: Chart on Others - Year-over-year growth 2024-2029 (%)
- Exhibits73: Data Table on Others - Year-over-year growth 2024-2029 (%)
- Exhibits74: Market opportunity by Application ($ million)
- Exhibits75: Data Table on Market opportunity by Application ($ million)
- Exhibits76: Chart on Crop Type - Market share 2024-2029 (%)
- Exhibits77: Data Table on Crop Type - Market share 2024-2029 (%)
- Exhibits78: Chart on Comparison by Crop Type
- Exhibits79: Data Table on Comparison by Crop Type
- Exhibits80: Chart on Cereals and grains - Market size and forecast 2024-2029 ($ million)
- Exhibits81: Data Table on Cereals and grains - Market size and forecast 2024-2029 ($ million)
- Exhibits82: Chart on Cereals and grains - Year-over-year growth 2024-2029 (%)
- Exhibits83: Data Table on Cereals and grains - Year-over-year growth 2024-2029 (%)
- Exhibits84: Chart on Oilseeds and pulses - Market size and forecast 2024-2029 ($ million)
- Exhibits85: Data Table on Oilseeds and pulses - Market size and forecast 2024-2029 ($ million)
- Exhibits86: Chart on Oilseeds and pulses - Year-over-year growth 2024-2029 (%)
- Exhibits87: Data Table on Oilseeds and pulses - Year-over-year growth 2024-2029 (%)
- Exhibits88: Chart on Fruits and vegetables - Market size and forecast 2024-2029 ($ million)
- Exhibits89: Data Table on Fruits and vegetables - Market size and forecast 2024-2029 ($ million)
- Exhibits90: Chart on Fruits and vegetables - Year-over-year growth 2024-2029 (%)
- Exhibits91: Data Table on Fruits and vegetables - Year-over-year growth 2024-2029 (%)
- Exhibits92: Chart on Others - Market size and forecast 2024-2029 ($ million)
- Exhibits93: Data Table on Others - Market size and forecast 2024-2029 ($ million)
- Exhibits94: Chart on Others - Year-over-year growth 2024-2029 (%)
- Exhibits95: Data Table on Others - Year-over-year growth 2024-2029 (%)
- Exhibits96: Market opportunity by Crop Type ($ million)
- Exhibits97: Data Table on Market opportunity by Crop Type ($ million)
- Exhibits98: Chart on Formulation - Market share 2024-2029 (%)
- Exhibits99: Data Table on Formulation - Market share 2024-2029 (%)
- Exhibits100: Chart on Comparison by Formulation
- Exhibits101: Data Table on Comparison by Formulation
- Exhibits102: Chart on Emulsifiable concentrators - Market size and forecast 2024-2029 ($ million)
- Exhibits103: Data Table on Emulsifiable concentrators - Market size and forecast 2024-2029 ($ million)
- Exhibits104: Chart on Emulsifiable concentrators - Year-over-year growth 2024-2029 (%)
- Exhibits105: Data Table on Emulsifiable concentrators - Year-over-year growth 2024-2029 (%)
- Exhibits106: Chart on Suspension concentrates - Market size and forecast 2024-2029 ($ million)
- Exhibits107: Data Table on Suspension concentrates - Market size and forecast 2024-2029 ($ million)
- Exhibits108: Chart on Suspension concentrates - Year-over-year growth 2024-2029 (%)
- Exhibits109: Data Table on Suspension concentrates - Year-over-year growth 2024-2029 (%)
- Exhibits110: Market opportunity by Formulation ($ million)
- Exhibits111: Data Table on Market opportunity by Formulation ($ million)
- Exhibits112: Analysis of price sensitivity, lifecycle, customer purchase basket, adoption rates, and purchase criteria
- Exhibits113: Chart on Market share By Geographical Landscape 2024-2029 (%)
- Exhibits114: Data Table on Market share By Geographical Landscape 2024-2029 (%)
- Exhibits115: Chart on Geographic comparison
- Exhibits116: Data Table on Geographic comparison
- Exhibits117: Chart on North America - Market size and forecast 2024-2029 ($ million)
- Exhibits118: Data Table on North America - Market size and forecast 2024-2029 ($ million)
- Exhibits119: Chart on North America - Year-over-year growth 2024-2029 (%)
- Exhibits120: Data Table on North America - Year-over-year growth 2024-2029 (%)
- Exhibits121: Chart on Europe - Market size and forecast 2024-2029 ($ million)
- Exhibits122: Data Table on Europe - Market size and forecast 2024-2029 ($ million)
- Exhibits123: Chart on Europe - Year-over-year growth 2024-2029 (%)
- Exhibits124: Data Table on Europe - Year-over-year growth 2024-2029 (%)
- Exhibits125: Chart on APAC - Market size and forecast 2024-2029 ($ million)
- Exhibits126: Data Table on APAC - Market size and forecast 2024-2029 ($ million)
- Exhibits127: Chart on APAC - Year-over-year growth 2024-2029 (%)
- Exhibits128: Data Table on APAC - Year-over-year growth 2024-2029 (%)
- Exhibits129: Chart on South America - Market size and forecast 2024-2029 ($ million)
- Exhibits130: Data Table on South America - Market size and forecast 2024-2029 ($ million)
- Exhibits131: Chart on South America - Year-over-year growth 2024-2029 (%)
- Exhibits132: Data Table on South America - Year-over-year growth 2024-2029 (%)
- Exhibits133: Chart on Middle East and Africa - Market size and forecast 2024-2029 ($ million)
- Exhibits134: Data Table on Middle East and Africa - Market size and forecast 2024-2029 ($ million)
- Exhibits135: Chart on Middle East and Africa - Year-over-year growth 2024-2029 (%)
- Exhibits136: Data Table on Middle East and Africa - Year-over-year growth 2024-2029 (%)
- Exhibits137: Chart on US - Market size and forecast 2024-2029 ($ million)
- Exhibits138: Data Table on US - Market size and forecast 2024-2029 ($ million)
- Exhibits139: Chart on US - Year-over-year growth 2024-2029 (%)
- Exhibits140: Data Table on US - Year-over-year growth 2024-2029 (%)
- Exhibits141: Chart on China - Market size and forecast 2024-2029 ($ million)
- Exhibits142: Data Table on China - Market size and forecast 2024-2029 ($ million)
- Exhibits143: Chart on China - Year-over-year growth 2024-2029 (%)
- Exhibits144: Data Table on China - Year-over-year growth 2024-2029 (%)
- Exhibits145: Chart on Germany - Market size and forecast 2024-2029 ($ million)
- Exhibits146: Data Table on Germany - Market size and forecast 2024-2029 ($ million)
- Exhibits147: Chart on Germany - Year-over-year growth 2024-2029 (%)
- Exhibits148: Data Table on Germany - Year-over-year growth 2024-2029 (%)
- Exhibits149: Chart on UK - Market size and forecast 2024-2029 ($ million)
- Exhibits150: Data Table on UK - Market size and forecast 2024-2029 ($ million)
- Exhibits151: Chart on UK - Year-over-year growth 2024-2029 (%)
- Exhibits152: Data Table on UK - Year-over-year growth 2024-2029 (%)
- Exhibits153: Chart on Canada - Market size and forecast 2024-2029 ($ million)
- Exhibits154: Data Table on Canada - Market size and forecast 2024-2029 ($ million)
- Exhibits155: Chart on Canada - Year-over-year growth 2024-2029 (%)
- Exhibits156: Data Table on Canada - Year-over-year growth 2024-2029 (%)
- Exhibits157: Chart on India - Market size and forecast 2024-2029 ($ million)
- Exhibits158: Data Table on India - Market size and forecast 2024-2029 ($ million)
- Exhibits159: Chart on India - Year-over-year growth 2024-2029 (%)
- Exhibits160: Data Table on India - Year-over-year growth 2024-2029 (%)
- Exhibits161: Chart on Japan - Market size and forecast 2024-2029 ($ million)
- Exhibits162: Data Table on Japan - Market size and forecast 2024-2029 ($ million)
- Exhibits163: Chart on Japan - Year-over-year growth 2024-2029 (%)
- Exhibits164: Data Table on Japan - Year-over-year growth 2024-2029 (%)
- Exhibits165: Chart on Brazil - Market size and forecast 2024-2029 ($ million)
- Exhibits166: Data Table on Brazil - Market size and forecast 2024-2029 ($ million)
- Exhibits167: Chart on Brazil - Year-over-year growth 2024-2029 (%)
- Exhibits168: Data Table on Brazil - Year-over-year growth 2024-2029 (%)
- Exhibits169: Chart on France - Market size and forecast 2024-2029 ($ million)
- Exhibits170: Data Table on France - Market size and forecast 2024-2029 ($ million)
- Exhibits171: Chart on France - Year-over-year growth 2024-2029 (%)
- Exhibits172: Data Table on France - Year-over-year growth 2024-2029 (%)
- Exhibits173: Chart on Italy - Market size and forecast 2024-2029 ($ million)
- Exhibits174: Data Table on Italy - Market size and forecast 2024-2029 ($ million)
- Exhibits175: Chart on Italy - Year-over-year growth 2024-2029 (%)
- Exhibits176: Data Table on Italy - Year-over-year growth 2024-2029 (%)
- Exhibits177: Market opportunity By Geographical Landscape ($ million)
- Exhibits178: Data Tables on Market opportunity By Geographical Landscape ($ million)
- Exhibits179: Impact of drivers and challenges in 2024 and 2029
- Exhibits180: Overview on criticality of inputs and factors of differentiation
- Exhibits181: Overview on factors of disruption
- Exhibits182: Impact of key risks on business
- Exhibits183: Companies covered
- Exhibits184: Company ranking index
- Exhibits185: Matrix on companies position and classification
- Exhibits186: BASF SE - Overview
- Exhibits187: BASF SE - Business segments
- Exhibits188: BASF SE - Key news
- Exhibits189: BASF SE - Key offerings
- Exhibits190: BASF SE - Segment focus
- Exhibits191: SWOT
- Exhibits192: BRANDT Inc. - Overview
- Exhibits193: BRANDT Inc. - Product / Service
- Exhibits194: BRANDT Inc. - Key offerings
- Exhibits195: SWOT
- Exhibits196: Clariant International Ltd. - Overview
- Exhibits197: Clariant International Ltd. - Business segments
- Exhibits198: Clariant International Ltd. - Key news
- Exhibits199: Clariant International Ltd. - Key offerings
- Exhibits200: Clariant International Ltd. - Segment focus
- Exhibits201: SWOT
- Exhibits202: Corteva Inc. - Overview
- Exhibits203: Corteva Inc. - Business segments
- Exhibits204: Corteva Inc. - Key news
- Exhibits205: Corteva Inc. - Key offerings
- Exhibits206: Corteva Inc. - Segment focus
- Exhibits207: SWOT
- Exhibits208: Croda International Plc - Overview
- Exhibits209: Croda International Plc - Business segments
- Exhibits210: Croda International Plc - Key news
- Exhibits211: Croda International Plc - Key offerings
- Exhibits212: Croda International Plc - Segment focus
- Exhibits213: SWOT
- Exhibits214: GarrCo Products Inc. - Overview
- Exhibits215: GarrCo Products Inc. - Product / Service
- Exhibits216: GarrCo Products Inc. - Key offerings
- Exhibits217: SWOT
- Exhibits218: Huntsman Corp. - Overview
- Exhibits219: Huntsman Corp. - Business segments
- Exhibits220: Huntsman Corp. - Key news
- Exhibits221: Huntsman Corp. - Key offerings
- Exhibits222: Huntsman Corp. - Segment focus
- Exhibits223: SWOT
- Exhibits224: Interagro UK Ltd. - Overview
- Exhibits225: Interagro UK Ltd. - Product / Service
- Exhibits226: Interagro UK Ltd. - Key offerings
- Exhibits227: SWOT
- Exhibits228: Lamberti SpA - Overview
- Exhibits229: Lamberti SpA - Product / Service
- Exhibits230: Lamberti SpA - Key offerings
- Exhibits231: SWOT
- Exhibits232: Marubeni Corp. - Overview
- Exhibits233: Marubeni Corp. - Business segments
- Exhibits234: Marubeni Corp. - Key offerings
- Exhibits235: Marubeni Corp. - Segment focus
- Exhibits236: SWOT
- Exhibits237: Nufarm Ltd. - Overview
- Exhibits238: Nufarm Ltd. - Business segments
- Exhibits239: Nufarm Ltd. - Key offerings
- Exhibits240: Nufarm Ltd. - Segment focus
- Exhibits241: SWOT
- Exhibits242: RAG Stiftung - Overview
- Exhibits243: RAG Stiftung - Product / Service
- Exhibits244: RAG Stiftung - Key offerings
- Exhibits245: SWOT
- Exhibits246: Simplot Grower Solutions - Overview
- Exhibits247: Simplot Grower Solutions - Product / Service
- Exhibits248: Simplot Grower Solutions - Key offerings
- Exhibits249: SWOT
- Exhibits250: Solvay SA - Overview
- Exhibits251: Solvay SA - Business segments
- Exhibits252: Solvay SA - Key news
- Exhibits253: Solvay SA - Key offerings
- Exhibits254: Solvay SA - Segment focus
- Exhibits255: SWOT
- Exhibits256: Stepan Co. - Overview
- Exhibits257: Stepan Co. - Business segments
- Exhibits258: Stepan Co. - Key news
- Exhibits259: Stepan Co. - Key offerings
- Exhibits260: Stepan Co. - Segment focus
- Exhibits261: SWOT
- Exhibits262: Inclusions checklist
- Exhibits263: Exclusions checklist
- Exhibits264: Currency conversion rates for US$
- Exhibits265: Research methodology
- Exhibits266: Information sources
- Exhibits267: Data validation
- Exhibits268: Validation techniques employed for market sizing
- Exhibits269: Data synthesis
- Exhibits270: 360 degree market analysis
- Exhibits271: List of abbreviations
The agricultural adjuvant market is forecasted to grow by USD 1297.1 million during 2024-2029, accelerating at a CAGR of 5.7% during the forecast period. The report on the agricultural adjuvant market provides a holistic analysis, market size and forecast, trends, growth drivers, and challenges, as well as vendor analysis covering around 25 vendors.
The report offers an up-to-date analysis regarding the current market scenario, the latest trends and drivers, and the overall market environment. The market is driven by increased use of herbicides, rise in demand for agricultural adjuvants in developing countries, and decreasing arable land.
| Market Scope | |
|---|---|
| Base Year | 2025 |
| End Year | 2029 |
| Series Year | 2025-2029 |
| Growth Momentum | Accelerate |
| YOY 2025 | 5.3% |
| CAGR | 5.7% |
| Incremental Value | $1297.1 mn |
The study was conducted using an objective combination of primary and secondary information including inputs from key participants in the industry. The report contains a comprehensive market size data, segment with regional analysis and vendor landscape in addition to an analysis of the key companies. Reports have historic and forecast data.
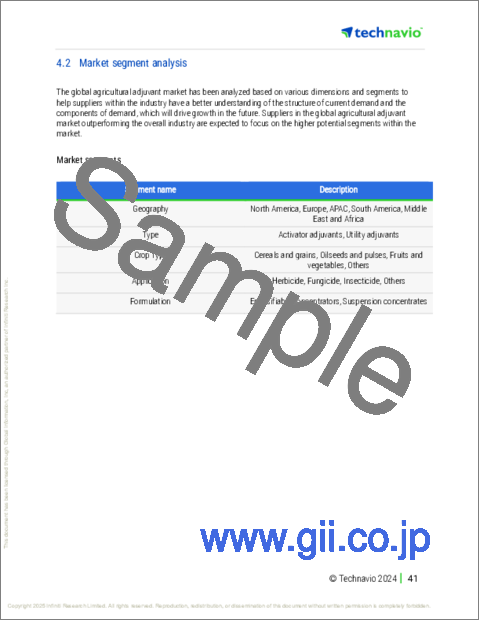
Technavio's agricultural adjuvant market is segmented as below:
By Type
- Activator adjuvants
- Utility adjuvants
By Application
- Herbicide
- Fungicide
- Insecticide
- Others
By Crop Type
- Cereals and grains
- Oilseeds and pulses
- Fruits and vegetables
- Others
By Formulation
- Emulsifiable concentrators
- Suspension concentrates
By Geographical Landscape
- North America
- Europe
- APAC
- South America
- Middle East and Africa
This study identifies the increasing adoption of precision farming as one of the prime reasons driving the agricultural adjuvant market growth during the next few years. Also, growing emphasis on sustainable agriculture and increased use of biologicals in agricultural adjuvant will lead to sizable demand in the market.
The report on the agricultural adjuvant market covers the following areas:
- Agricultural Adjuvant Market sizing
- Agricultural Adjuvant Market forecast
- Agricultural Adjuvant Market industry analysis
The robust vendor analysis is designed to help clients improve their market position, and in line with this, this report provides a detailed analysis of several leading agricultural adjuvant market vendors that include BASF SE, Bayer AG, BRANDT Inc., Clariant International Ltd., Corteva Inc., Croda International PLC, GarrCo Products Inc., Huntsman Corp., Interagro UK Ltd., Lamberti SpA, Land O Lakes Inc., Marubeni Corp., Nouryon Chemicals Holding B.V., Nufarm Ltd., Precision Laboratories LLC, RAG Stiftung, Simplot Grower Solutions, Solvay SA, Stepan Co., and Wilbur Ellis Holdings Inc.. Also, the agricultural adjuvant market analysis report includes information on upcoming trends and challenges that will influence market growth. This is to help companies strategize and leverage all forthcoming growth opportunities.
The publisher presents a detailed picture of the market by the way of study, synthesis, and summation of data from multiple sources by an analysis of key parameters such as profit, pricing, competition, and promotions. It presents various market facets by identifying the key industry influencers. The data presented is comprehensive, reliable, and a result of extensive primary and secondary research. The market research reports provide a complete competitive landscape and an in-depth vendor selection methodology and analysis using qualitative and quantitative research to forecast accurate market growth.
Table of Contents
1 Executive Summary
- 1.1 Market overview
- Executive Summary - Chart on Market Overview
- Executive Summary - Data Table on Market Overview
- Executive Summary - Chart on Global Market Characteristics
- Executive Summary - Chart on Market By Geographical Landscape
- Executive Summary - Chart on Market Segmentation by Type
- Executive Summary - Chart on Market Segmentation by Application
- Executive Summary - Chart on Market Segmentation by Crop Type
- Executive Summary - Chart on Market Segmentation by Formulation
- Executive Summary - Chart on Incremental Growth
- Executive Summary - Data Table on Incremental Growth
- Executive Summary - Chart on Company Market Positioning
2 Technavio Analysis
- 2.1 Analysis of price sensitivity, lifecycle, customer purchase basket, adoption rates, and purchase criteria
- Analysis of price sensitivity, lifecycle, customer purchase basket, adoption rates, and purchase criteria
- 2.2 Criticality of inputs and Factors of differentiation
- Overview on criticality of inputs and factors of differentiation
- 2.3 Factors of disruption
- Overview on factors of disruption
- 2.4 Impact of drivers and challenges
- Impact of drivers and challenges in 2024 and 2029
3 Market Landscape
- 3.1 Market ecosystem
- Parent Market
- Data Table on - Parent Market
- 3.2 Market characteristics
- Market characteristics analysis
- 3.3 Value chain analysis
- Value chain analysis
4 Market Sizing
- 4.1 Market definition
- Offerings of companies included in the market definition
- 4.2 Market segment analysis
- Market segments
- 4.3 Market size 2024
- 4.4 Market outlook: Forecast for 2024-2029
- Chart on Global - Market size and forecast 2024-2029 ($ million)
- Data Table on Global - Market size and forecast 2024-2029 ($ million)
- Chart on Global Market: Year-over-year growth 2024-2029 (%)
- Data Table on Global Market: Year-over-year growth 2024-2029 (%)
5 Historic Market Size
- 5.1 Global Agricultural Adjuvant Market 2019 - 2023
- Historic Market Size - Data Table on Global Agricultural Adjuvant Market 2019 - 2023 ($ million)
- 5.2 Type segment analysis 2019 - 2023
- Historic Market Size - Type Segment 2019 - 2023 ($ million)
- 5.3 Application segment analysis 2019 - 2023
- Historic Market Size - Application Segment 2019 - 2023 ($ million)
- 5.4 Crop Type segment analysis 2019 - 2023
- Historic Market Size - Crop Type Segment 2019 - 2023 ($ million)
- 5.5 Formulation segment analysis 2019 - 2023
- Historic Market Size - Formulation Segment 2019 - 2023 ($ million)
- 5.6 Geography segment analysis 2019 - 2023
- Historic Market Size - Geography Segment 2019 - 2023 ($ million)
- 5.7 Country segment analysis 2019 - 2023
- Historic Market Size - Country Segment 2019 - 2023 ($ million)
6 Qualitative Analysis
- 6.1 Impact of AI on Global Agricultural Adjuvant Market
7 Five Forces Analysis
- 7.1 Five forces summary
- Five forces analysis - Comparison between 2024 and 2029
- 7.2 Bargaining power of buyers
- Bargaining power of buyers - Impact of key factors 2024 and 2029
- 7.3 Bargaining power of suppliers
- Bargaining power of suppliers - Impact of key factors in 2024 and 2029
- 7.4 Threat of new entrants
- Threat of new entrants - Impact of key factors in 2024 and 2029
- 7.5 Threat of substitutes
- Threat of substitutes - Impact of key factors in 2024 and 2029
- 7.6 Threat of rivalry
- Threat of rivalry - Impact of key factors in 2024 and 2029
- 7.7 Market condition
- Chart on Market condition - Five forces 2024 and 2029
8 Market Segmentation by Type
- 8.1 Market segments
- Chart on Type - Market share 2024-2029 (%)
- Data Table on Type - Market share 2024-2029 (%)
- 8.2 Comparison by Type
- Chart on Comparison by Type
- Data Table on Comparison by Type
- 8.3 Activator adjuvants - Market size and forecast 2024-2029
- Chart on Activator adjuvants - Market size and forecast 2024-2029 ($ million)
- Data Table on Activator adjuvants - Market size and forecast 2024-2029 ($ million)
- Chart on Activator adjuvants - Year-over-year growth 2024-2029 (%)
- Data Table on Activator adjuvants - Year-over-year growth 2024-2029 (%)
- 8.4 Utility adjuvants - Market size and forecast 2024-2029
- Chart on Utility adjuvants - Market size and forecast 2024-2029 ($ million)
- Data Table on Utility adjuvants - Market size and forecast 2024-2029 ($ million)
- Chart on Utility adjuvants - Year-over-year growth 2024-2029 (%)
- Data Table on Utility adjuvants - Year-over-year growth 2024-2029 (%)
- 8.5 Market opportunity by Type
- Market opportunity by Type ($ million)
- Data Table on Market opportunity by Type ($ million)
9 Market Segmentation by Application
- 9.1 Market segments
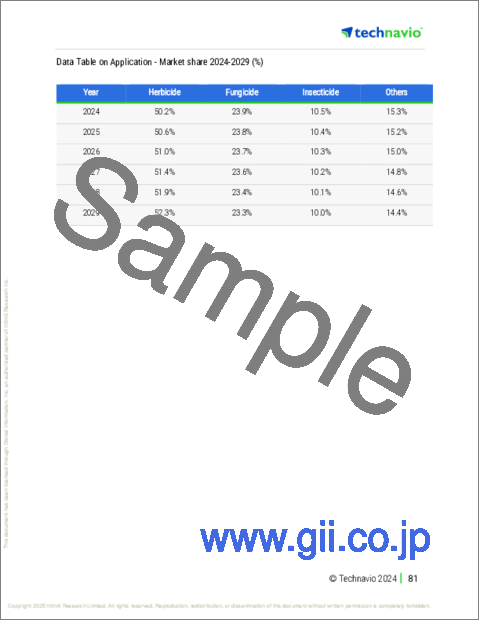
- Chart on Application - Market share 2024-2029 (%)
- Data Table on Application - Market share 2024-2029 (%)
- 9.2 Comparison by Application
- Chart on Comparison by Application
- Data Table on Comparison by Application
- 9.3 Herbicide - Market size and forecast 2024-2029
- Chart on Herbicide - Market size and forecast 2024-2029 ($ million)
- Data Table on Herbicide - Market size and forecast 2024-2029 ($ million)
- Chart on Herbicide - Year-over-year growth 2024-2029 (%)
- Data Table on Herbicide - Year-over-year growth 2024-2029 (%)
- 9.4 Fungicide - Market size and forecast 2024-2029
- Chart on Fungicide - Market size and forecast 2024-2029 ($ million)
- Data Table on Fungicide - Market size and forecast 2024-2029 ($ million)
- Chart on Fungicide - Year-over-year growth 2024-2029 (%)
- Data Table on Fungicide - Year-over-year growth 2024-2029 (%)
- 9.5 Insecticide - Market size and forecast 2024-2029
- Chart on Insecticide - Market size and forecast 2024-2029 ($ million)
- Data Table on Insecticide - Market size and forecast 2024-2029 ($ million)
- Chart on Insecticide - Year-over-year growth 2024-2029 (%)
- Data Table on Insecticide - Year-over-year growth 2024-2029 (%)
- 9.6 Others - Market size and forecast 2024-2029
- Chart on Others - Market size and forecast 2024-2029 ($ million)
- Data Table on Others - Market size and forecast 2024-2029 ($ million)
- Chart on Others - Year-over-year growth 2024-2029 (%)
- Data Table on Others - Year-over-year growth 2024-2029 (%)
- 9.7 Market opportunity by Application
- Market opportunity by Application ($ million)
- Data Table on Market opportunity by Application ($ million)
10 Market Segmentation by Crop Type
- 10.1 Market segments
- Chart on Crop Type - Market share 2024-2029 (%)
- Data Table on Crop Type - Market share 2024-2029 (%)
- 10.2 Comparison by Crop Type
- Chart on Comparison by Crop Type
- Data Table on Comparison by Crop Type
- 10.3 Cereals and grains - Market size and forecast 2024-2029
- Chart on Cereals and grains - Market size and forecast 2024-2029 ($ million)
- Data Table on Cereals and grains - Market size and forecast 2024-2029 ($ million)
- Chart on Cereals and grains - Year-over-year growth 2024-2029 (%)
- Data Table on Cereals and grains - Year-over-year growth 2024-2029 (%)
- 10.4 Oilseeds and pulses - Market size and forecast 2024-2029
- Chart on Oilseeds and pulses - Market size and forecast 2024-2029 ($ million)
- Data Table on Oilseeds and pulses - Market size and forecast 2024-2029 ($ million)
- Chart on Oilseeds and pulses - Year-over-year growth 2024-2029 (%)
- Data Table on Oilseeds and pulses - Year-over-year growth 2024-2029 (%)
- 10.5 Fruits and vegetables - Market size and forecast 2024-2029
- Chart on Fruits and vegetables - Market size and forecast 2024-2029 ($ million)
- Data Table on Fruits and vegetables - Market size and forecast 2024-2029 ($ million)
- Chart on Fruits and vegetables - Year-over-year growth 2024-2029 (%)
- Data Table on Fruits and vegetables - Year-over-year growth 2024-2029 (%)
- 10.6 Others - Market size and forecast 2024-2029
- Chart on Others - Market size and forecast 2024-2029 ($ million)
- Data Table on Others - Market size and forecast 2024-2029 ($ million)
- Chart on Others - Year-over-year growth 2024-2029 (%)
- Data Table on Others - Year-over-year growth 2024-2029 (%)
- 10.7 Market opportunity by Crop Type
- Market opportunity by Crop Type ($ million)
- Data Table on Market opportunity by Crop Type ($ million)
11 Market Segmentation by Formulation
- 11.1 Market segments
- Chart on Formulation - Market share 2024-2029 (%)
- Data Table on Formulation - Market share 2024-2029 (%)
- 11.2 Comparison by Formulation
- Chart on Comparison by Formulation
- Data Table on Comparison by Formulation
- 11.3 Emulsifiable concentrators - Market size and forecast 2024-2029
- Chart on Emulsifiable concentrators - Market size and forecast 2024-2029 ($ million)
- Data Table on Emulsifiable concentrators - Market size and forecast 2024-2029 ($ million)
- Chart on Emulsifiable concentrators - Year-over-year growth 2024-2029 (%)
- Data Table on Emulsifiable concentrators - Year-over-year growth 2024-2029 (%)
- 11.4 Suspension concentrates - Market size and forecast 2024-2029
- Chart on Suspension concentrates - Market size and forecast 2024-2029 ($ million)
- Data Table on Suspension concentrates - Market size and forecast 2024-2029 ($ million)
- Chart on Suspension concentrates - Year-over-year growth 2024-2029 (%)
- Data Table on Suspension concentrates - Year-over-year growth 2024-2029 (%)
- 11.5 Market opportunity by Formulation
- Market opportunity by Formulation ($ million)
- Data Table on Market opportunity by Formulation ($ million)
12 Customer Landscape
- 12.1 Customer landscape overview
- Analysis of price sensitivity, lifecycle, customer purchase basket, adoption rates, and purchase criteria
13 Geographic Landscape
- 13.1 Geographic segmentation
- Chart on Market share By Geographical Landscape 2024-2029 (%)
- Data Table on Market share By Geographical Landscape 2024-2029 (%)
- 13.2 Geographic comparison
- Chart on Geographic comparison
- Data Table on Geographic comparison
- 13.3 North America - Market size and forecast 2024-2029
- Chart on North America - Market size and forecast 2024-2029 ($ million)
- Data Table on North America - Market size and forecast 2024-2029 ($ million)
- Chart on North America - Year-over-year growth 2024-2029 (%)
- Data Table on North America - Year-over-year growth 2024-2029 (%)
- 13.4 Europe - Market size and forecast 2024-2029
- Chart on Europe - Market size and forecast 2024-2029 ($ million)
- Data Table on Europe - Market size and forecast 2024-2029 ($ million)
- Chart on Europe - Year-over-year growth 2024-2029 (%)
- Data Table on Europe - Year-over-year growth 2024-2029 (%)
- 13.5 APAC - Market size and forecast 2024-2029
- Chart on APAC - Market size and forecast 2024-2029 ($ million)
- Data Table on APAC - Market size and forecast 2024-2029 ($ million)
- Chart on APAC - Year-over-year growth 2024-2029 (%)
- Data Table on APAC - Year-over-year growth 2024-2029 (%)
- 13.6 South America - Market size and forecast 2024-2029
- Chart on South America - Market size and forecast 2024-2029 ($ million)
- Data Table on South America - Market size and forecast 2024-2029 ($ million)
- Chart on South America - Year-over-year growth 2024-2029 (%)
- Data Table on South America - Year-over-year growth 2024-2029 (%)
- 13.7 Middle East and Africa - Market size and forecast 2024-2029
- Chart on Middle East and Africa - Market size and forecast 2024-2029 ($ million)
- Data Table on Middle East and Africa - Market size and forecast 2024-2029 ($ million)
- Chart on Middle East and Africa - Year-over-year growth 2024-2029 (%)
- Data Table on Middle East and Africa - Year-over-year growth 2024-2029 (%)
- 13.8 US - Market size and forecast 2024-2029
- Chart on US - Market size and forecast 2024-2029 ($ million)
- Data Table on US - Market size and forecast 2024-2029 ($ million)
- Chart on US - Year-over-year growth 2024-2029 (%)
- Data Table on US - Year-over-year growth 2024-2029 (%)
- 13.9 China - Market size and forecast 2024-2029
- Chart on China - Market size and forecast 2024-2029 ($ million)
- Data Table on China - Market size and forecast 2024-2029 ($ million)
- Chart on China - Year-over-year growth 2024-2029 (%)
- Data Table on China - Year-over-year growth 2024-2029 (%)
- 13.10 Germany - Market size and forecast 2024-2029
- Chart on Germany - Market size and forecast 2024-2029 ($ million)
- Data Table on Germany - Market size and forecast 2024-2029 ($ million)
- Chart on Germany - Year-over-year growth 2024-2029 (%)
- Data Table on Germany - Year-over-year growth 2024-2029 (%)
- 13.11 UK - Market size and forecast 2024-2029
- Chart on UK - Market size and forecast 2024-2029 ($ million)
- Data Table on UK - Market size and forecast 2024-2029 ($ million)
- Chart on UK - Year-over-year growth 2024-2029 (%)
- Data Table on UK - Year-over-year growth 2024-2029 (%)
- 13.12 Canada - Market size and forecast 2024-2029
- Chart on Canada - Market size and forecast 2024-2029 ($ million)
- Data Table on Canada - Market size and forecast 2024-2029 ($ million)
- Chart on Canada - Year-over-year growth 2024-2029 (%)
- Data Table on Canada - Year-over-year growth 2024-2029 (%)
- 13.13 India - Market size and forecast 2024-2029
- Chart on India - Market size and forecast 2024-2029 ($ million)
- Data Table on India - Market size and forecast 2024-2029 ($ million)
- Chart on India - Year-over-year growth 2024-2029 (%)
- Data Table on India - Year-over-year growth 2024-2029 (%)
- 13.14 Japan - Market size and forecast 2024-2029
- Chart on Japan - Market size and forecast 2024-2029 ($ million)
- Data Table on Japan - Market size and forecast 2024-2029 ($ million)
- Chart on Japan - Year-over-year growth 2024-2029 (%)
- Data Table on Japan - Year-over-year growth 2024-2029 (%)
- 13.15 Brazil - Market size and forecast 2024-2029
- Chart on Brazil - Market size and forecast 2024-2029 ($ million)
- Data Table on Brazil - Market size and forecast 2024-2029 ($ million)
- Chart on Brazil - Year-over-year growth 2024-2029 (%)
- Data Table on Brazil - Year-over-year growth 2024-2029 (%)
- 13.16 France - Market size and forecast 2024-2029
- Chart on France - Market size and forecast 2024-2029 ($ million)
- Data Table on France - Market size and forecast 2024-2029 ($ million)
- Chart on France - Year-over-year growth 2024-2029 (%)
- Data Table on France - Year-over-year growth 2024-2029 (%)
- 13.17 Italy - Market size and forecast 2024-2029
- Chart on Italy - Market size and forecast 2024-2029 ($ million)
- Data Table on Italy - Market size and forecast 2024-2029 ($ million)
- Chart on Italy - Year-over-year growth 2024-2029 (%)
- Data Table on Italy - Year-over-year growth 2024-2029 (%)
- 13.18 Market opportunity By Geographical Landscape
- Market opportunity By Geographical Landscape ($ million)
- Data Tables on Market opportunity By Geographical Landscape ($ million)
14 Drivers, Challenges, and Opportunity/Restraints
- 14.1 Market drivers
- 14.2 Market challenges
- 14.3 Impact of drivers and challenges
- Impact of drivers and challenges in 2024 and 2029
- 14.4 Market opportunities/restraints
15 Competitive Landscape
- 15.1 Overview
- 15.2 Competitive Landscape
- Overview on criticality of inputs and factors of differentiation
- 15.3 Landscape disruption
- Overview on factors of disruption
- 15.4 Industry risks
- Impact of key risks on business
16 Competitive Analysis
- 16.1 Companies profiled
- Companies covered
- 16.2 Company ranking index
- Company ranking index
- 16.3 Market positioning of companies
- Matrix on companies position and classification
- 16.4 BASF SE
- BASF SE - Overview
- BASF SE - Business segments
- BASF SE - Key news
- BASF SE - Key offerings
- BASF SE - Segment focus
- SWOT
- 16.5 BRANDT Inc.
- BRANDT Inc. - Overview
- BRANDT Inc. - Product / Service
- BRANDT Inc. - Key offerings
- SWOT
- 16.6 Clariant International Ltd.
- Clariant International Ltd. - Overview
- Clariant International Ltd. - Business segments
- Clariant International Ltd. - Key news
- Clariant International Ltd. - Key offerings
- Clariant International Ltd. - Segment focus
- SWOT
- 16.7 Corteva Inc.
- Corteva Inc. - Overview
- Corteva Inc. - Business segments
- Corteva Inc. - Key news
- Corteva Inc. - Key offerings
- Corteva Inc. - Segment focus
- SWOT
- 16.8 Croda International Plc
- Croda International Plc - Overview
- Croda International Plc - Business segments
- Croda International Plc - Key news
- Croda International Plc - Key offerings
- Croda International Plc - Segment focus
- SWOT
- 16.9 GarrCo Products Inc.
- GarrCo Products Inc. - Overview
- GarrCo Products Inc. - Product / Service
- GarrCo Products Inc. - Key offerings
- SWOT
- 16.10 Huntsman Corp.
- Huntsman Corp. - Overview
- Huntsman Corp. - Business segments
- Huntsman Corp. - Key news
- Huntsman Corp. - Key offerings
- Huntsman Corp. - Segment focus
- SWOT
- 16.11 Interagro UK Ltd.
- Interagro UK Ltd. - Overview
- Interagro UK Ltd. - Product / Service
- Interagro UK Ltd. - Key offerings
- SWOT
- 16.12 Lamberti SpA
- Lamberti SpA - Overview
- Lamberti SpA - Product / Service
- Lamberti SpA - Key offerings
- SWOT
- 16.13 Marubeni Corp.
- Marubeni Corp. - Overview
- Marubeni Corp. - Business segments
- Marubeni Corp. - Key offerings
- Marubeni Corp. - Segment focus
- SWOT
- 16.14 Nufarm Ltd.
- Nufarm Ltd. - Overview
- Nufarm Ltd. - Business segments
- Nufarm Ltd. - Key offerings
- Nufarm Ltd. - Segment focus
- SWOT
- 16.15 RAG Stiftung
- RAG Stiftung - Overview
- RAG Stiftung - Product / Service
- RAG Stiftung - Key offerings
- SWOT
- 16.16 Simplot Grower Solutions
- Simplot Grower Solutions - Overview
- Simplot Grower Solutions - Product / Service
- Simplot Grower Solutions - Key offerings
- SWOT
- 16.17 Solvay SA
- Solvay SA - Overview
- Solvay SA - Business segments
- Solvay SA - Key news
- Solvay SA - Key offerings
- Solvay SA - Segment focus
- SWOT
- 16.18 Stepan Co.
- Stepan Co. - Overview
- Stepan Co. - Business segments
- Stepan Co. - Key news
- Stepan Co. - Key offerings
- Stepan Co. - Segment focus
- SWOT
17 Appendix
- 17.1 Scope of the report
- 17.2 Inclusions and exclusions checklist
- Inclusions checklist
- Exclusions checklist
- 17.3 Currency conversion rates for US$
- Currency conversion rates for US$
- 17.4 Research methodology
- Research methodology
- 17.5 Data procurement
- Information sources
- 17.6 Data validation
- Data validation
- 17.7 Validation techniques employed for market sizing
- Validation techniques employed for market sizing
- 17.8 Data synthesis
- Data synthesis
- 17.9 360 degree market analysis
- 360 degree market analysis
- 17.10 List of abbreviations
- List of abbreviations

