|
|
市場調査レポート
商品コード
1652898
リチウムイオン電池リサイクルの世界市場(2025年~2029年)Global Lithium-ion Battery Recycling Market 2025-2029 |
||||||
|
|||||||
カスタマイズ可能
|
|||||||

| リチウムイオン電池リサイクルの世界市場(2025年~2029年) |
|
出版日: 2025年01月25日
発行: TechNavio
ページ情報: 英文 198 Pages
納期: 即納可能
|

全表示
- 概要
- 目次
世界のリチウムイオン電池リサイクルの市場規模は、2024年~2029年に55億3,770万米ドルに達し、予測期間中のCAGRは28.9%で成長すると予測されます。
当レポートでは、リチウムイオン電池リサイクル市場の全体的な分析、市場規模・予測、動向、成長促進要因、課題、約25のベンダーを網羅したベンダー分析などを掲載しています。
当レポートは、現在の市場シナリオ、最新動向と促進要因、市場環境全体に関する最新分析を提供しています。EV需要の増加、リチウムイオン電池リサイクルに対する政府の支援、新興市場における都市化の進展などが市場を牽引しています。
| 市場範囲 | |
|---|---|
| 基準年 | 2025年 |
| 終了年 | 2029年 |
| 予測期間 | 2025年~2029年 |
| 成長モメンタム | 加速 |
| 前年比2025年 | 24.1% |
| CAGR | 28.9% |
| 増分額 | 55億3,770万米ドル |
本調査は、業界の主要参入企業からのインプットを含め、一次情報と二次情報を客観的に組み合わせて実施しました。レポートには、主要企業の分析に加え、包括的な市場規模データ、地域分析によるセグメント、ベンダー情勢が含まれています。レポートには実績データと予測データがあります。
本調査では、今後数年間のリチウムイオン電池リサイクル市場の成長を促進する主な要因の1つとして、新たなバッテリーリサイクル施設の開設を挙げています。また、電池リサイクルのためのスチュワードシップ協力の高まりや、リチウム需給ギャップの拡大は、市場の大きな需要につながります。
目次
第1章 エグゼクティブサマリー
- 市場概要
第2章 Technavioの分析
- 価格感度・ライフサイクル・顧客購入バスケット・採用率・購入基準の分析
- インプットの重要性と差別化の要因
- ディスラプションの要因
- 促進要因と課題の影響
第3章 市場情勢
- 市場エコシステム
- 市場の特徴
- バリューチェーン分析
第4章 市場規模
- 市場の定義
- 市場セグメント分析
- 市場規模(2024年)
- 市場の見通し(2024年~2029年)
第5章 市場規模実績
- リチウムイオン電池リサイクルの世界市場(2019年~2023年)
- 供給源セグメント分析(2019年~2023年)
- 方法セグメント分析(2019年~2023年)
- 地域セグメント分析(2019年~2023年)
- 国セグメント分析(2019年~2023年)
第6章 定性分析
- AIの影響:リチウムイオン電池リサイクルの世界市場
第7章 ファイブフォース分析
- ファイブフォースの要約
- 買い手の交渉力
- 供給企業の交渉力
- 新規参入業者の脅威
- 代替品の脅威
- 競争の脅威
- 市況
第8章 市場セグメンテーション:供給源別
- 市場セグメント
- 比較:供給源別
- モビリティ以外の分野:市場規模と予測(2024年~2029年)
- モビリティ分野:市場規模と予測(2024年~2029年)
- 市場機会:供給源別
第9章 市場セグメンテーション:方法別
- 市場セグメント
- 比較:方法別
- 湿式冶金:市場規模と予測(2024年~2029年)
- 物理的および機械的:市場規模と予測(2024年~2029年)
- 高温冶金:市場規模と予測(2024年~2029年)
- 市場機会:方法別
第10章 顧客情勢
- 顧客情勢の概要
第11章 地域別情勢
- 地域別セグメンテーション
- 地域別比較
- アジア太平洋:市場規模と予測(2024年~2029年)
- 欧州:市場規模と予測(2024年~2029年)
- 北米:市場規模と予測(2024年~2029年)
- 南米:市場規模と予測(2024年~2029年)
- 中東・アフリカ:市場規模と予測(2024年~2029年)
- 米国:市場規模と予測(2024年~2029年)
- 中国:市場規模と予測(2024年~2029年)
- ドイツ:市場規模と予測(2024年~2029年)
- カナダ:市場規模と予測(2024年~2029年)
- 英国:市場規模と予測(2024年~2029年)
- 日本:市場規模と予測(2024年~2029年)
- フランス:市場規模と予測(2024年~2029年)
- イタリア:市場規模と予測(2024年~2029年)
- インド:市場規模と予測(2024年~2029年)
- 韓国:市場規模と予測(2024年~2029年)
- 市場機会:地域情勢別
第12章 促進要因・課題・機会・抑制要因
- 市場促進要因
- 市場の課題
- 促進要因と課題の影響
- 市場の機会・抑制要因
第13章 競合情勢
- 概要
- 競合情勢
- ディスラプションの状況
- 業界のリスク
第14章 競合分析
- 企業プロファイル
- 企業ランキング指数
- 企業の市場ポジショニング
- Battery Solutions LLC
- Befesa SA
- Contemporary Amperex Technology Co. Ltd.
- Ecobat LLC
- Fortum Oyj
- GEM Co. Ltd.
- Glencore Plc
- Li Cycle Holdings Corp.
- Neometals Ltd.
- RecycLiCo Battery Materials Inc.
- Sistemas de Tubo Ambiental SA de CV
- Tata Chemicals Ltd.
- TES Singapore Pte Ltd.
- Umicore SA
- Veolia
第15章 付録
The lithium-ion battery recycling market is forecasted to grow by USD 5537.7 mn during 2024-2029, accelerating at a CAGR of 28.9% during the forecast period. The report on the lithium-ion battery recycling market provides a holistic analysis, market size and forecast, trends, growth drivers, and challenges, as well as vendor analysis covering around 25 vendors.
The report offers an up-to-date analysis regarding the current market scenario, the latest trends and drivers, and the overall market environment. The market is driven by increase in demand for evs, government support for lithium-ion battery recycling, and increasing urbanization in emerging markets.
| Market Scope | |
|---|---|
| Base Year | 2025 |
| End Year | 2029 |
| Series Year | 2025-2029 |
| Growth Momentum | Accelerate |
| YOY 2025 | 24.1% |
| CAGR | 28.9% |
| Incremental Value | $5537.7 mn |
The study was conducted using an objective combination of primary and secondary information including inputs from key participants in the industry. The report contains a comprehensive market size data, segment with regional analysis and vendor landscape in addition to an analysis of the key companies. Reports have historic and forecast data.
Technavio's lithium-ion battery recycling market is segmented as below:
By Source
- Non-mobility
- Mobility
By Method
- Hydrometallurgical
- Physical and mechanical
- Pyrometallurgical
By Geographical Landscape
- APAC
- Europe
- North America
- South America
- Middle East and Africa
This study identifies the opening of new battery recycling facilities as one of the prime reasons driving the lithium-ion battery recycling market growth during the next few years. Also, rising stewardship collaboration for battery recycling and widening lithium supply-demand gap will lead to sizable demand in the market.
The report on the lithium-ion battery recycling market covers the following areas:
- Lithium-Ion Battery Recycling Market sizing
- Lithium-Ion Battery Recycling Market forecast
- Lithium-Ion Battery Recycling Market industry analysis
The robust vendor analysis is designed to help clients improve their market position, and in line with this, this report provides a detailed analysis of several leading lithium-ion battery recycling market vendors that include Akkuser Oy, Battery Solutions LLC, Befesa SA, Contemporary Amperex Technology Co. Ltd., Duesenfeld GmbH, Ecobat LLC, Fortum Oyj, GEM Co. Ltd., Glencore Plc, Gopher Resource LLC, Li Cycle Holdings Corp., Lithion Recycling, Neometals Ltd., Onto Technology LLC, RecycLiCo Battery Materials Inc., Sistemas de Tubo Ambiental SA de CV, Tata Chemicals Ltd., TES Singapore Pte Ltd., Umicore SA, and Veolia. Also, the lithium-ion battery recycling market analysis report includes information on upcoming trends and challenges that will influence market growth. This is to help companies strategize and leverage all forthcoming growth opportunities.
The publisher presents a detailed picture of the market by the way of study, synthesis, and summation of data from multiple sources by an analysis of key parameters such as profit, pricing, competition, and promotions. It presents various market facets by identifying the key industry influencers. The data presented is comprehensive, reliable, and a result of extensive primary and secondary research. The market research reports provide a complete competitive landscape and an in-depth vendor selection methodology and analysis using qualitative and quantitative research to forecast accurate market growth.
Table of Contents
1 Executive Summary
- 1.1 Market overview
- Executive Summary - Chart on Market Overview
- Executive Summary - Data Table on Market Overview
- Executive Summary - Chart on Global Market Characteristics
- Executive Summary - Chart on Market By Geographical Landscape
- Executive Summary - Chart on Market Segmentation by Source
- Executive Summary - Chart on Market Segmentation by Method
- Executive Summary - Chart on Incremental Growth
- Executive Summary - Data Table on Incremental Growth
- Executive Summary - Chart on Company Market Positioning
2 Technavio Analysis
- 2.1 Analysis of price sensitivity, lifecycle, customer purchase basket, adoption rates, and purchase criteria
- Analysis of price sensitivity, lifecycle, customer purchase basket, adoption rates, and purchase criteria
- 2.2 Criticality of inputs and Factors of differentiation
- Overview on criticality of inputs and factors of differentiation
- 2.3 Factors of disruption
- Overview on factors of disruption
- 2.4 Impact of drivers and challenges
- Impact of drivers and challenges in 2024 and 2029
3 Market Landscape
- 3.1 Market ecosystem
- Parent Market
- Data Table on - Parent Market
- 3.2 Market characteristics
- Market characteristics analysis
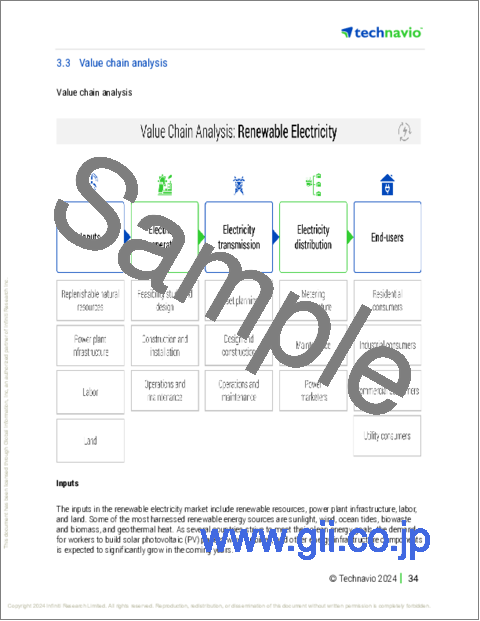
- 3.3 Value chain analysis
- Value chain analysis
4 Market Sizing
- 4.1 Market definition
- Offerings of companies included in the market definition
- 4.2 Market segment analysis
- Market segments
- 4.3 Market size 2024
- 4.4 Market outlook: Forecast for 2024-2029
- Chart on Global - Market size and forecast 2024-2029 ($ million)
- Data Table on Global - Market size and forecast 2024-2029 ($ million)
- Chart on Global Market: Year-over-year growth 2024-2029 (%)
- Data Table on Global Market: Year-over-year growth 2024-2029 (%)
5 Historic Market Size
- 5.1 Global Lithium-Ion Battery Recycling Market 2019 - 2023
- Historic Market Size - Data Table on Global Lithium-Ion Battery Recycling Market 2019 - 2023 ($ million)
- 5.2 Source segment analysis 2019 - 2023
- Historic Market Size - Source Segment 2019 - 2023 ($ million)
- 5.3 Method segment analysis 2019 - 2023
- Historic Market Size - Method Segment 2019 - 2023 ($ million)
- 5.4 Geography segment analysis 2019 - 2023
- Historic Market Size - Geography Segment 2019 - 2023 ($ million)
- 5.5 Country segment analysis 2019 - 2023
- Historic Market Size - Country Segment 2019 - 2023 ($ million)
6 Qualitative Analysis
- 6.1 Impact of AI in the Global Lithium-Ion Battery Recycling Market
7 Five Forces Analysis
- 7.1 Five forces summary
- Five forces analysis - Comparison between 2024 and 2029
- 7.2 Bargaining power of buyers
- Bargaining power of buyers - Impact of key factors 2024 and 2029
- 7.3 Bargaining power of suppliers
- Bargaining power of suppliers - Impact of key factors in 2024 and 2029
- 7.4 Threat of new entrants
- Threat of new entrants - Impact of key factors in 2024 and 2029
- 7.5 Threat of substitutes
- Threat of substitutes - Impact of key factors in 2024 and 2029
- 7.6 Threat of rivalry
- Threat of rivalry - Impact of key factors in 2024 and 2029
- 7.7 Market condition
- Chart on Market condition - Five forces 2024 and 2029
8 Market Segmentation by Source
- 8.1 Market segments
- Chart on Source - Market share 2024-2029 (%)
- Data Table on Source - Market share 2024-2029 (%)
- 8.2 Comparison by Source
- Chart on Comparison by Source
- Data Table on Comparison by Source
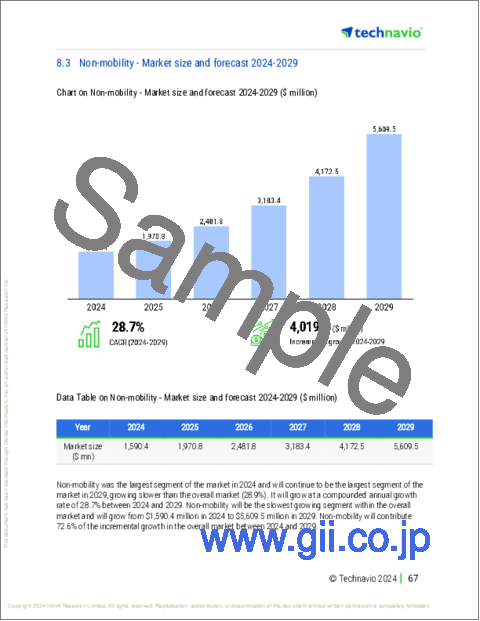
- 8.3 Non-mobility - Market size and forecast 2024-2029
- Chart on Non-mobility - Market size and forecast 2024-2029 ($ million)
- Data Table on Non-mobility - Market size and forecast 2024-2029 ($ million)
- Chart on Non-mobility - Year-over-year growth 2024-2029 (%)
- Data Table on Non-mobility - Year-over-year growth 2024-2029 (%)
- 8.4 Mobility - Market size and forecast 2024-2029
- Chart on Mobility - Market size and forecast 2024-2029 ($ million)
- Data Table on Mobility - Market size and forecast 2024-2029 ($ million)
- Chart on Mobility - Year-over-year growth 2024-2029 (%)
- Data Table on Mobility - Year-over-year growth 2024-2029 (%)
- 8.5 Market opportunity by Source
- Market opportunity by Source ($ million)
- Data Table on Market opportunity by Source ($ million)
9 Market Segmentation by Method
- 9.1 Market segments
- Chart on Method - Market share 2024-2029 (%)
- Data Table on Method - Market share 2024-2029 (%)
- 9.2 Comparison by Method
- Chart on Comparison by Method
- Data Table on Comparison by Method
- 9.3 Hydrometallurgical - Market size and forecast 2024-2029
- Chart on Hydrometallurgical - Market size and forecast 2024-2029 ($ million)
- Data Table on Hydrometallurgical - Market size and forecast 2024-2029 ($ million)
- Chart on Hydrometallurgical - Year-over-year growth 2024-2029 (%)
- Data Table on Hydrometallurgical - Year-over-year growth 2024-2029 (%)
- 9.4 Physical and mechanical - Market size and forecast 2024-2029
- Chart on Physical and mechanical - Market size and forecast 2024-2029 ($ million)
- Data Table on Physical and mechanical - Market size and forecast 2024-2029 ($ million)
- Chart on Physical and mechanical - Year-over-year growth 2024-2029 (%)
- Data Table on Physical and mechanical - Year-over-year growth 2024-2029 (%)
- 9.5 Pyrometallurgical - Market size and forecast 2024-2029
- Chart on Pyrometallurgical - Market size and forecast 2024-2029 ($ million)
- Data Table on Pyrometallurgical - Market size and forecast 2024-2029 ($ million)
- Chart on Pyrometallurgical - Year-over-year growth 2024-2029 (%)
- Data Table on Pyrometallurgical - Year-over-year growth 2024-2029 (%)
- 9.6 Market opportunity by Method
- Market opportunity by Method ($ million)
- Data Table on Market opportunity by Method ($ million)
10 Customer Landscape
- 10.1 Customer landscape overview
- Analysis of price sensitivity, lifecycle, customer purchase basket, adoption rates, and purchase criteria
11 Geographic Landscape
- 11.1 Geographic segmentation
- Chart on Market share By Geographical Landscape 2024-2029 (%)
- Data Table on Market share By Geographical Landscape 2024-2029 (%)
- 11.2 Geographic comparison
- Chart on Geographic comparison
- Data Table on Geographic comparison
- 11.3 APAC - Market size and forecast 2024-2029
- Chart on APAC - Market size and forecast 2024-2029 ($ million)
- Data Table on APAC - Market size and forecast 2024-2029 ($ million)
- Chart on APAC - Year-over-year growth 2024-2029 (%)
- Data Table on APAC - Year-over-year growth 2024-2029 (%)
- 11.4 Europe - Market size and forecast 2024-2029
- Chart on Europe - Market size and forecast 2024-2029 ($ million)
- Data Table on Europe - Market size and forecast 2024-2029 ($ million)
- Chart on Europe - Year-over-year growth 2024-2029 (%)
- Data Table on Europe - Year-over-year growth 2024-2029 (%)
- 11.5 North America - Market size and forecast 2024-2029
- Chart on North America - Market size and forecast 2024-2029 ($ million)
- Data Table on North America - Market size and forecast 2024-2029 ($ million)
- Chart on North America - Year-over-year growth 2024-2029 (%)
- Data Table on North America - Year-over-year growth 2024-2029 (%)
- 11.6 South America - Market size and forecast 2024-2029
- Chart on South America - Market size and forecast 2024-2029 ($ million)
- Data Table on South America - Market size and forecast 2024-2029 ($ million)
- Chart on South America - Year-over-year growth 2024-2029 (%)
- Data Table on South America - Year-over-year growth 2024-2029 (%)
- 11.7 Middle East and Africa - Market size and forecast 2024-2029
- Chart on Middle East and Africa - Market size and forecast 2024-2029 ($ million)
- Data Table on Middle East and Africa - Market size and forecast 2024-2029 ($ million)
- Chart on Middle East and Africa - Year-over-year growth 2024-2029 (%)
- Data Table on Middle East and Africa - Year-over-year growth 2024-2029 (%)
- 11.8 US - Market size and forecast 2024-2029
- Chart on US - Market size and forecast 2024-2029 ($ million)
- Data Table on US - Market size and forecast 2024-2029 ($ million)
- Chart on US - Year-over-year growth 2024-2029 (%)
- Data Table on US - Year-over-year growth 2024-2029 (%)
- 11.9 China - Market size and forecast 2024-2029
- Chart on China - Market size and forecast 2024-2029 ($ million)
- Data Table on China - Market size and forecast 2024-2029 ($ million)
- Chart on China - Year-over-year growth 2024-2029 (%)
- Data Table on China - Year-over-year growth 2024-2029 (%)
- 11.10 Germany - Market size and forecast 2024-2029
- Chart on Germany - Market size and forecast 2024-2029 ($ million)
- Data Table on Germany - Market size and forecast 2024-2029 ($ million)
- Chart on Germany - Year-over-year growth 2024-2029 (%)
- Data Table on Germany - Year-over-year growth 2024-2029 (%)
- 11.11 Canada - Market size and forecast 2024-2029
- Chart on Canada - Market size and forecast 2024-2029 ($ million)
- Data Table on Canada - Market size and forecast 2024-2029 ($ million)
- Chart on Canada - Year-over-year growth 2024-2029 (%)
- Data Table on Canada - Year-over-year growth 2024-2029 (%)
- 11.12 UK - Market size and forecast 2024-2029
- Chart on UK - Market size and forecast 2024-2029 ($ million)
- Data Table on UK - Market size and forecast 2024-2029 ($ million)
- Chart on UK - Year-over-year growth 2024-2029 (%)
- Data Table on UK - Year-over-year growth 2024-2029 (%)
- 11.13 Japan - Market size and forecast 2024-2029
- Chart on Japan - Market size and forecast 2024-2029 ($ million)
- Data Table on Japan - Market size and forecast 2024-2029 ($ million)
- Chart on Japan - Year-over-year growth 2024-2029 (%)
- Data Table on Japan - Year-over-year growth 2024-2029 (%)
- 11.14 France - Market size and forecast 2024-2029
- Chart on France - Market size and forecast 2024-2029 ($ million)
- Data Table on France - Market size and forecast 2024-2029 ($ million)
- Chart on France - Year-over-year growth 2024-2029 (%)
- Data Table on France - Year-over-year growth 2024-2029 (%)
- 11.15 Italy - Market size and forecast 2024-2029
- Chart on Italy - Market size and forecast 2024-2029 ($ million)
- Data Table on Italy - Market size and forecast 2024-2029 ($ million)
- Chart on Italy - Year-over-year growth 2024-2029 (%)
- Data Table on Italy - Year-over-year growth 2024-2029 (%)
- 11.16 India - Market size and forecast 2024-2029
- Chart on India - Market size and forecast 2024-2029 ($ million)
- Data Table on India - Market size and forecast 2024-2029 ($ million)
- Chart on India - Year-over-year growth 2024-2029 (%)
- Data Table on India - Year-over-year growth 2024-2029 (%)
- 11.17 South Korea - Market size and forecast 2024-2029
- Chart on South Korea - Market size and forecast 2024-2029 ($ million)
- Data Table on South Korea - Market size and forecast 2024-2029 ($ million)
- Chart on South Korea - Year-over-year growth 2024-2029 (%)
- Data Table on South Korea - Year-over-year growth 2024-2029 (%)
- 11.18 Market opportunity By Geographical Landscape
- Market opportunity By Geographical Landscape ($ million)
- Data Tables on Market opportunity By Geographical Landscape ($ million)
12 Drivers, Challenges, and Opportunity/Restraints
- 12.1 Market drivers
- 12.2 Market challenges
- 12.3 Impact of drivers and challenges
- Impact of drivers and challenges in 2024 and 2029
- 12.4 Market opportunities/restraints
13 Competitive Landscape
- 13.1 Overview
- 13.2 Competitive Landscape
- Overview on criticality of inputs and factors of differentiation
- 13.3 Landscape disruption
- Overview on factors of disruption
- 13.4 Industry risks
- Impact of key risks on business
14 Competitive Analysis
- 14.1 Companies profiled
- Companies covered
- 14.2 Company ranking index
- Company ranking index
- 14.3 Market positioning of companies
- Matrix on companies position and classification
- 14.4 Battery Solutions LLC
- Battery Solutions LLC - Overview
- Battery Solutions LLC - Product / Service
- Battery Solutions LLC - Key news
- Battery Solutions LLC - Key offerings
- SWOT
- 14.5 Befesa SA
- Befesa SA - Overview
- Befesa SA - Business segments
- Befesa SA - Key offerings
- Befesa SA - Segment focus
- SWOT
- 14.6 Contemporary Amperex Technology Co. Ltd.
- Contemporary Amperex Technology Co. Ltd. - Overview
- Contemporary Amperex Technology Co. Ltd. - Product / Service
- Contemporary Amperex Technology Co. Ltd. - Key news
- Contemporary Amperex Technology Co. Ltd. - Key offerings
- SWOT
- 14.7 Ecobat LLC
- Ecobat LLC - Overview
- Ecobat LLC - Product / Service
- Ecobat LLC - Key news
- Ecobat LLC - Key offerings
- SWOT
- 14.8 Fortum Oyj
- Fortum Oyj - Overview
- Fortum Oyj - Business segments
- Fortum Oyj - Key offerings
- Fortum Oyj - Segment focus
- SWOT
- 14.9 GEM Co. Ltd.
- GEM Co. Ltd. - Overview
- GEM Co. Ltd. - Product / Service
- GEM Co. Ltd. - Key news
- GEM Co. Ltd. - Key offerings
- SWOT
- 14.10 Glencore Plc
- Glencore Plc - Overview
- Glencore Plc - Business segments
- Glencore Plc - Key news
- Glencore Plc - Key offerings
- Glencore Plc - Segment focus
- SWOT
- 14.11 Li Cycle Holdings Corp.
- Li Cycle Holdings Corp. - Overview
- Li Cycle Holdings Corp. - Product / Service
- Li Cycle Holdings Corp. - Key news
- Li Cycle Holdings Corp. - Key offerings
- SWOT
- 14.12 Neometals Ltd.
- Neometals Ltd. - Overview
- Neometals Ltd. - Product / Service
- Neometals Ltd. - Key offerings
- SWOT
- 14.13 RecycLiCo Battery Materials Inc.
- RecycLiCo Battery Materials Inc. - Overview
- RecycLiCo Battery Materials Inc. - Product / Service
- RecycLiCo Battery Materials Inc. - Key offerings
- SWOT
- 14.14 Sistemas de Tubo Ambiental SA de CV
- Sistemas de Tubo Ambiental SA de CV - Overview
- Sistemas de Tubo Ambiental SA de CV - Product / Service
- Sistemas de Tubo Ambiental SA de CV - Key offerings
- SWOT
- 14.15 Tata Chemicals Ltd.
- Tata Chemicals Ltd. - Overview
- Tata Chemicals Ltd. - Business segments
- Tata Chemicals Ltd. - Key offerings
- Tata Chemicals Ltd. - Segment focus
- SWOT
- 14.16 TES Singapore Pte Ltd.
- TES Singapore Pte Ltd. - Overview
- TES Singapore Pte Ltd. - Product / Service
- TES Singapore Pte Ltd. - Key offerings
- SWOT
- 14.17 Umicore SA
- Umicore SA - Overview
- Umicore SA - Business segments
- Umicore SA - Key news
- Umicore SA - Key offerings
- Umicore SA - Segment focus
- SWOT
- 14.18 Veolia
- Veolia - Overview
- Veolia - Business segments
- Veolia - Key news
- Veolia - Key offerings
- Veolia - Segment focus
- SWOT
15 Appendix
- 15.1 Scope of the report
- 15.2 Inclusions and exclusions checklist
- Inclusions checklist
- Exclusions checklist
- 15.3 Currency conversion rates for US$
- Currency conversion rates for US$
- 15.4 Research methodology
- Research methodology
- 15.5 Data procurement
- Information sources
- 15.6 Data validation
- Data validation
- 15.7 Validation techniques employed for market sizing
- Validation techniques employed for market sizing
- 15.8 Data synthesis
- Data synthesis
- 15.9 360 degree market analysis
- 360 degree market analysis
- 15.10 List of abbreviations
- List of abbreviations

