|
|
市場調査レポート
商品コード
1695870
硝酸銀の世界市場 2025~2029年Global Silver Nitrate Market 2025-2029 |
||||||

|
|||||||
カスタマイズ可能
|
|||||||

| 硝酸銀の世界市場 2025~2029年 |
|
出版日: 2025年03月21日
発行: TechNavio
ページ情報: 英文 205 Pages
納期: 即納可能
|

全表示
- 概要
- 図表
- 目次
硝酸銀市場は2024-2029年に37億320万米ドル、予測期間中のCAGRは5.4%で成長すると予測されます。
当レポートでは、硝酸銀市場の全体的な分析、市場規模・予測、動向、成長促進要因、課題、約25のベンダーを網羅したベンダー分析などを掲載しています。
現在の市場シナリオ、最新動向と促進要因、市場環境全体に関する最新分析を提供しています。市場は、ヘルスケア分野での硝酸銀需要の増加、写真や宝飾品用途での硝酸銀需要の増加、原材料の低コスト化と入手の容易さなどが牽引しています。
| 市場範囲 | |
|---|---|
| 基準年 | 2025 |
| 終了年 | 2029 |
| 予測期間 | 2025-2029 |
| 成長モメンタム | 加速 |
| 前年比2025年 | 5.3% |
| CAGR | 5.4% |
| 増分額 | 37億320万米ドル |
本調査は、業界の主要参加者からのインプットを含め、一次情報と二次情報を客観的に組み合わせて実施しました。レポートには、主要企業の分析に加え、包括的な市場規模データ、地域分析によるセグメント、ベンダー情勢が含まれています。レポートには履歴データと予測データがあります。
本調査では、硝酸銀の医療用途の増加が、今後数年間の硝酸銀市場の成長を促進する主要な理由の1つであると特定しています。また、硝酸銀の需要を促進する分析試薬の需要の増加とナノテクノロジーの進歩は、市場の大きな需要につながるでしょう。
目次
第1章 エグゼクティブサマリー
- 市場概要
第2章 Technavio分析
- 価格・ライフサイクル・顧客購入バスケット・採用率・購入基準の分析
- インプットの重要性と差別化の要因
- 混乱の要因
- 促進要因と課題の影響
第3章 市場情勢
- 市場エコシステム
- 市場の特徴
- バリューチェーン分析
第4章 市場規模
- 市場の定義
- 市場セグメント分析
- 市場規模 2024
- 市場の見通し 2024-2029
第5章 市場規模実績
- 硝酸銀の世界市場 2019-2023
- グレードタイプ別セグメント分析 2019-2023
- 用途別セグメント分析 2019-2023
- タイプ別セグメント分析 2019-2023
- 流通チャネル別セグメント分析 2019-2023
- 地域別セグメント分析 2019-2023
- 国別セグメント分析 2019-2023
第6章 定性分析
- AIの影響:硝酸銀の世界市場
第7章 ファイブフォース分析
- ファイブフォースの要約
- 買い手の交渉力
- 供給企業の交渉力
- 新規参入業者の脅威
- 代替品の脅威
- 競争の脅威
- 市況
第8章 市場セグメンテーション:グレードタイプ別
- 市場セグメント
- 比較:グレードタイプ別
- 写真グレード:市場規模と予測 2024-2029
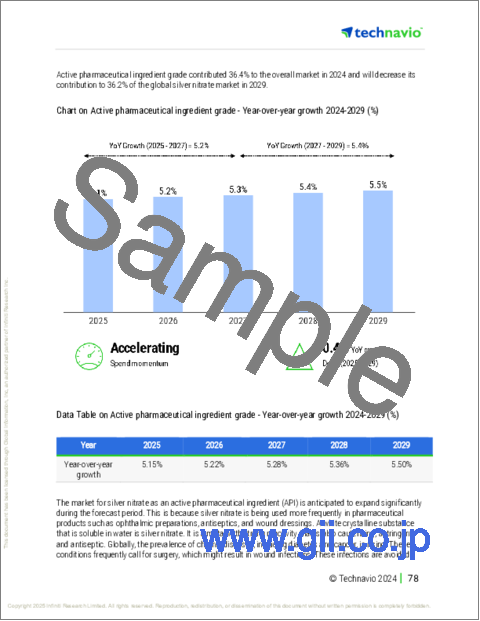
- 医薬品有効成分グレード:市場規模と予測 2024-2029
- 分析試薬グレード:市場規模と予測 2024-2029
- 市場機会:グレードタイプ別
第9章 市場セグメンテーション:用途別
- 市場セグメント
- 比較:用途別
- 写真とジュエリー:市場規模と予測 2024-2029
- 医療とヘルスケア:市場規模と予測 2024-2029
- ガラスコーティング:市場規模と予測 2024-2029
- その他:市場規模と予測 2024-2029
- 市場機会:用途別
第10章 市場セグメンテーション:タイプ別
- 市場セグメント
- 比較:タイプ別
- クリスタル/パウダー:市場規模と予測 2024-2029
- 液体溶液:市場規模と予測 2024-2029
- 市場機会:タイプ別
第11章 市場セグメンテーション:流通チャネル別
- 市場セグメント
- 比較:流通チャネル別
- オフライン:市場規模と予測 2024-2029
- オンライン:市場規模と予測 2024-2029
- 市場機会:流通チャネル別
第12章 顧客情勢
- 顧客情勢の概要
第13章 地域別情勢
- 地域別セグメンテーション
- 地域別比較
- 北米:市場規模と予測 2024-2029
- アジア太平洋:市場規模と予測 2024-2029
- 欧州:市場規模と予測 2024-2029
- 南米:市場規模と予測 2024-2029
- 中東・アフリカ:市場規模と予測 2024-2029
- 米国:市場規模と予測 2024-2029
- 中国:市場規模と予測 2024-2029
- 日本:市場規模と予測 2024-2029
- カナダ:市場規模と予測 2024-2029
- インド:市場規模と予測 2024-2029
- ドイツ:市場規模と予測 2024-2029
- 韓国:市場規模と予測 2024-2029
- 英国:市場規模と予測 2024-2029
- ブラジル:市場規模と予測 2024-2029
- フランス:市場規模と予測 2024-2029
- 市場機会:地域情勢別
第14章 促進要因・課題・機会・抑制要因
- 市場促進要因
- 市場の課題
- 促進要因と課題の影響
- 市場の機会・抑制要因
第15章 競合情勢
- 概要
- 競合情勢
- 混乱の状況
- 業界のリスク
第16章 競合分析
- 企業プロファイル
- 企業ランキング指数
- 企業の市場ポジショニング
- ACS Chemicals
- Alpha Chemika
- Ames Goldsmith Corp.
- Celtic Chemicals Ltd.
- East India Chemicals International
- Green Vision Technical Services Pvt Ltd
- INDIAN PLATINUM PVT LTD.
- Innova Corporate India
- Modison Metals Ltd.
- Otto Chemie Pvt. Ltd.
- Ralington Pharma LLP
- RXChemicals
- Sky Chem
- Texchem Industries
- Vizag Chemical International
第17章 付録
Exhibits:
- Exhibits1: Executive Summary - Chart on Market Overview
- Exhibits2: Executive Summary - Data Table on Market Overview
- Exhibits3: Executive Summary - Chart on Global Market Characteristics
- Exhibits4: Executive Summary - Chart on Market By Geographical Landscape
- Exhibits5: Executive Summary - Chart on Market Segmentation by Grade Type
- Exhibits6: Executive Summary - Chart on Market Segmentation by Application
- Exhibits7: Executive Summary - Chart on Market Segmentation by Type
- Exhibits8: Executive Summary - Chart on Market Segmentation by Distribution Channel
- Exhibits9: Executive Summary - Chart on Incremental Growth
- Exhibits10: Executive Summary - Data Table on Incremental Growth
- Exhibits11: Executive Summary - Chart on Company Market Positioning
- Exhibits12: Analysis of price sensitivity, lifecycle, customer purchase basket, adoption rates, and purchase criteria
- Exhibits13: Overview on criticality of inputs and factors of differentiation
- Exhibits14: Overview on factors of disruption
- Exhibits15: Impact of drivers and challenges in 2024 and 2029
- Exhibits16: Parent Market
- Exhibits17: Data Table on - Parent Market
- Exhibits18: Market characteristics analysis
- Exhibits19: Value chain analysis
- Exhibits20: Offerings of companies included in the market definition
- Exhibits21: Market segments
- Exhibits22: Chart on Global - Market size and forecast 2024-2029 ($ million)
- Exhibits23: Data Table on Global - Market size and forecast 2024-2029 ($ million)
- Exhibits24: Chart on Global Market: Year-over-year growth 2024-2029 (%)
- Exhibits25: Data Table on Global Market: Year-over-year growth 2024-2029 (%)
- Exhibits26: Historic Market Size - Data Table on Global Silver Nitrate Market 2019 - 2023 ($ million)
- Exhibits27: Historic Market Size - Grade Type Segment 2019 - 2023 ($ million)
- Exhibits28: Historic Market Size - Application Segment 2019 - 2023 ($ million)
- Exhibits29: Historic Market Size - Type Segment 2019 - 2023 ($ million)
- Exhibits30: Historic Market Size - Distribution Channel Segment 2019 - 2023 ($ million)
- Exhibits31: Historic Market Size - Geography Segment 2019 - 2023 ($ million)
- Exhibits32: Historic Market Size - Country Segment 2019 - 2023 ($ million)
- Exhibits33: Five forces analysis - Comparison between 2024 and 2029
- Exhibits34: Bargaining power of buyers - Impact of key factors 2024 and 2029
- Exhibits35: Bargaining power of suppliers - Impact of key factors in 2024 and 2029
- Exhibits36: Threat of new entrants - Impact of key factors in 2024 and 2029
- Exhibits37: Threat of substitutes - Impact of key factors in 2024 and 2029
- Exhibits38: Threat of rivalry - Impact of key factors in 2024 and 2029
- Exhibits39: Chart on Market condition - Five forces 2024 and 2029
- Exhibits40: Chart on Grade Type - Market share 2024-2029 (%)
- Exhibits41: Data Table on Grade Type - Market share 2024-2029 (%)
- Exhibits42: Chart on Comparison by Grade Type
- Exhibits43: Data Table on Comparison by Grade Type
- Exhibits44: Chart on Photographic grade - Market size and forecast 2024-2029 ($ million)
- Exhibits45: Data Table on Photographic grade - Market size and forecast 2024-2029 ($ million)
- Exhibits46: Chart on Photographic grade - Year-over-year growth 2024-2029 (%)
- Exhibits47: Data Table on Photographic grade - Year-over-year growth 2024-2029 (%)
- Exhibits48: Chart on Active pharmaceutical ingredient grade - Market size and forecast 2024-2029 ($ million)
- Exhibits49: Data Table on Active pharmaceutical ingredient grade - Market size and forecast 2024-2029 ($ million)
- Exhibits50: Chart on Active pharmaceutical ingredient grade - Year-over-year growth 2024-2029 (%)
- Exhibits51: Data Table on Active pharmaceutical ingredient grade - Year-over-year growth 2024-2029 (%)
- Exhibits52: Chart on Analytical reagents grade - Market size and forecast 2024-2029 ($ million)
- Exhibits53: Data Table on Analytical reagents grade - Market size and forecast 2024-2029 ($ million)
- Exhibits54: Chart on Analytical reagents grade - Year-over-year growth 2024-2029 (%)
- Exhibits55: Data Table on Analytical reagents grade - Year-over-year growth 2024-2029 (%)
- Exhibits56: Market opportunity by Grade Type ($ million)
- Exhibits57: Data Table on Market opportunity by Grade Type ($ million)
- Exhibits58: Chart on Application - Market share 2024-2029 (%)
- Exhibits59: Data Table on Application - Market share 2024-2029 (%)
- Exhibits60: Chart on Comparison by Application
- Exhibits61: Data Table on Comparison by Application
- Exhibits62: Chart on Photography and jewelry - Market size and forecast 2024-2029 ($ million)
- Exhibits63: Data Table on Photography and jewelry - Market size and forecast 2024-2029 ($ million)
- Exhibits64: Chart on Photography and jewelry - Year-over-year growth 2024-2029 (%)
- Exhibits65: Data Table on Photography and jewelry - Year-over-year growth 2024-2029 (%)
- Exhibits66: Chart on Medical and healthcare - Market size and forecast 2024-2029 ($ million)
- Exhibits67: Data Table on Medical and healthcare - Market size and forecast 2024-2029 ($ million)
- Exhibits68: Chart on Medical and healthcare - Year-over-year growth 2024-2029 (%)
- Exhibits69: Data Table on Medical and healthcare - Year-over-year growth 2024-2029 (%)
- Exhibits70: Chart on Glass coating - Market size and forecast 2024-2029 ($ million)
- Exhibits71: Data Table on Glass coating - Market size and forecast 2024-2029 ($ million)
- Exhibits72: Chart on Glass coating - Year-over-year growth 2024-2029 (%)
- Exhibits73: Data Table on Glass coating - Year-over-year growth 2024-2029 (%)
- Exhibits74: Chart on Others - Market size and forecast 2024-2029 ($ million)
- Exhibits75: Data Table on Others - Market size and forecast 2024-2029 ($ million)
- Exhibits76: Chart on Others - Year-over-year growth 2024-2029 (%)
- Exhibits77: Data Table on Others - Year-over-year growth 2024-2029 (%)
- Exhibits78: Market opportunity by Application ($ million)
- Exhibits79: Data Table on Market opportunity by Application ($ million)
- Exhibits80: Chart on Type - Market share 2024-2029 (%)
- Exhibits81: Data Table on Type - Market share 2024-2029 (%)
- Exhibits82: Chart on Comparison by Type
- Exhibits83: Data Table on Comparison by Type
- Exhibits84: Chart on Crystal/powder - Market size and forecast 2024-2029 ($ million)
- Exhibits85: Data Table on Crystal/powder - Market size and forecast 2024-2029 ($ million)
- Exhibits86: Chart on Crystal/powder - Year-over-year growth 2024-2029 (%)
- Exhibits87: Data Table on Crystal/powder - Year-over-year growth 2024-2029 (%)
- Exhibits88: Chart on Liquid solution - Market size and forecast 2024-2029 ($ million)
- Exhibits89: Data Table on Liquid solution - Market size and forecast 2024-2029 ($ million)
- Exhibits90: Chart on Liquid solution - Year-over-year growth 2024-2029 (%)
- Exhibits91: Data Table on Liquid solution - Year-over-year growth 2024-2029 (%)
- Exhibits92: Market opportunity by Type ($ million)
- Exhibits93: Data Table on Market opportunity by Type ($ million)
- Exhibits94: Chart on Distribution Channel - Market share 2024-2029 (%)
- Exhibits95: Data Table on Distribution Channel - Market share 2024-2029 (%)
- Exhibits96: Chart on Comparison by Distribution Channel
- Exhibits97: Data Table on Comparison by Distribution Channel
- Exhibits98: Chart on Offline - Market size and forecast 2024-2029 ($ million)
- Exhibits99: Data Table on Offline - Market size and forecast 2024-2029 ($ million)
- Exhibits100: Chart on Offline - Year-over-year growth 2024-2029 (%)
- Exhibits101: Data Table on Offline - Year-over-year growth 2024-2029 (%)
- Exhibits102: Chart on Online - Market size and forecast 2024-2029 ($ million)
- Exhibits103: Data Table on Online - Market size and forecast 2024-2029 ($ million)
- Exhibits104: Chart on Online - Year-over-year growth 2024-2029 (%)
- Exhibits105: Data Table on Online - Year-over-year growth 2024-2029 (%)
- Exhibits106: Market opportunity by Distribution Channel ($ million)
- Exhibits107: Data Table on Market opportunity by Distribution Channel ($ million)
- Exhibits108: Analysis of price sensitivity, lifecycle, customer purchase basket, adoption rates, and purchase criteria
- Exhibits109: Chart on Market share By Geographical Landscape 2024-2029 (%)
- Exhibits110: Data Table on Market share By Geographical Landscape 2024-2029 (%)
- Exhibits111: Chart on Geographic comparison
- Exhibits112: Data Table on Geographic comparison
- Exhibits113: Chart on North America - Market size and forecast 2024-2029 ($ million)
- Exhibits114: Data Table on North America - Market size and forecast 2024-2029 ($ million)
- Exhibits115: Chart on North America - Year-over-year growth 2024-2029 (%)
- Exhibits116: Data Table on North America - Year-over-year growth 2024-2029 (%)
- Exhibits117: Chart on APAC - Market size and forecast 2024-2029 ($ million)
- Exhibits118: Data Table on APAC - Market size and forecast 2024-2029 ($ million)
- Exhibits119: Chart on APAC - Year-over-year growth 2024-2029 (%)
- Exhibits120: Data Table on APAC - Year-over-year growth 2024-2029 (%)
- Exhibits121: Chart on Europe - Market size and forecast 2024-2029 ($ million)
- Exhibits122: Data Table on Europe - Market size and forecast 2024-2029 ($ million)
- Exhibits123: Chart on Europe - Year-over-year growth 2024-2029 (%)
- Exhibits124: Data Table on Europe - Year-over-year growth 2024-2029 (%)
- Exhibits125: Chart on South America - Market size and forecast 2024-2029 ($ million)
- Exhibits126: Data Table on South America - Market size and forecast 2024-2029 ($ million)
- Exhibits127: Chart on South America - Year-over-year growth 2024-2029 (%)
- Exhibits128: Data Table on South America - Year-over-year growth 2024-2029 (%)
- Exhibits129: Chart on Middle East and Africa - Market size and forecast 2024-2029 ($ million)
- Exhibits130: Data Table on Middle East and Africa - Market size and forecast 2024-2029 ($ million)
- Exhibits131: Chart on Middle East and Africa - Year-over-year growth 2024-2029 (%)
- Exhibits132: Data Table on Middle East and Africa - Year-over-year growth 2024-2029 (%)
- Exhibits133: Chart on US - Market size and forecast 2024-2029 ($ million)
- Exhibits134: Data Table on US - Market size and forecast 2024-2029 ($ million)
- Exhibits135: Chart on US - Year-over-year growth 2024-2029 (%)
- Exhibits136: Data Table on US - Year-over-year growth 2024-2029 (%)
- Exhibits137: Chart on China - Market size and forecast 2024-2029 ($ million)
- Exhibits138: Data Table on China - Market size and forecast 2024-2029 ($ million)
- Exhibits139: Chart on China - Year-over-year growth 2024-2029 (%)
- Exhibits140: Data Table on China - Year-over-year growth 2024-2029 (%)
- Exhibits141: Chart on Japan - Market size and forecast 2024-2029 ($ million)
- Exhibits142: Data Table on Japan - Market size and forecast 2024-2029 ($ million)
- Exhibits143: Chart on Japan - Year-over-year growth 2024-2029 (%)
- Exhibits144: Data Table on Japan - Year-over-year growth 2024-2029 (%)
- Exhibits145: Chart on Canada - Market size and forecast 2024-2029 ($ million)
- Exhibits146: Data Table on Canada - Market size and forecast 2024-2029 ($ million)
- Exhibits147: Chart on Canada - Year-over-year growth 2024-2029 (%)
- Exhibits148: Data Table on Canada - Year-over-year growth 2024-2029 (%)
- Exhibits149: Chart on India - Market size and forecast 2024-2029 ($ million)
- Exhibits150: Data Table on India - Market size and forecast 2024-2029 ($ million)
- Exhibits151: Chart on India - Year-over-year growth 2024-2029 (%)
- Exhibits152: Data Table on India - Year-over-year growth 2024-2029 (%)
- Exhibits153: Chart on Germany - Market size and forecast 2024-2029 ($ million)
- Exhibits154: Data Table on Germany - Market size and forecast 2024-2029 ($ million)
- Exhibits155: Chart on Germany - Year-over-year growth 2024-2029 (%)
- Exhibits156: Data Table on Germany - Year-over-year growth 2024-2029 (%)
- Exhibits157: Chart on South Korea - Market size and forecast 2024-2029 ($ million)
- Exhibits158: Data Table on South Korea - Market size and forecast 2024-2029 ($ million)
- Exhibits159: Chart on South Korea - Year-over-year growth 2024-2029 (%)
- Exhibits160: Data Table on South Korea - Year-over-year growth 2024-2029 (%)
- Exhibits161: Chart on UK - Market size and forecast 2024-2029 ($ million)
- Exhibits162: Data Table on UK - Market size and forecast 2024-2029 ($ million)
- Exhibits163: Chart on UK - Year-over-year growth 2024-2029 (%)
- Exhibits164: Data Table on UK - Year-over-year growth 2024-2029 (%)
- Exhibits165: Chart on Brazil - Market size and forecast 2024-2029 ($ million)
- Exhibits166: Data Table on Brazil - Market size and forecast 2024-2029 ($ million)
- Exhibits167: Chart on Brazil - Year-over-year growth 2024-2029 (%)
- Exhibits168: Data Table on Brazil - Year-over-year growth 2024-2029 (%)
- Exhibits169: Chart on France - Market size and forecast 2024-2029 ($ million)
- Exhibits170: Data Table on France - Market size and forecast 2024-2029 ($ million)
- Exhibits171: Chart on France - Year-over-year growth 2024-2029 (%)
- Exhibits172: Data Table on France - Year-over-year growth 2024-2029 (%)
- Exhibits173: Market opportunity By Geographical Landscape ($ million)
- Exhibits174: Data Tables on Market opportunity By Geographical Landscape ($ million)
- Exhibits175: Impact of drivers and challenges in 2024 and 2029
- Exhibits176: Overview on criticality of inputs and factors of differentiation
- Exhibits177: Overview on factors of disruption
- Exhibits178: Impact of key risks on business
- Exhibits179: Companies covered
- Exhibits180: Company ranking index
- Exhibits181: Matrix on companies position and classification
- Exhibits182: ACS Chemicals - Overview
- Exhibits183: ACS Chemicals - Product / Service
- Exhibits184: ACS Chemicals - Key offerings
- Exhibits185: SWOT
- Exhibits186: Alpha Chemika - Overview
- Exhibits187: Alpha Chemika - Product / Service
- Exhibits188: Alpha Chemika - Key offerings
- Exhibits189: SWOT
- Exhibits190: Ames Goldsmith Corp. - Overview
- Exhibits191: Ames Goldsmith Corp. - Product / Service
- Exhibits192: Ames Goldsmith Corp. - Key offerings
- Exhibits193: SWOT
- Exhibits194: Celtic Chemicals Ltd. - Overview
- Exhibits195: Celtic Chemicals Ltd. - Product / Service
- Exhibits196: Celtic Chemicals Ltd. - Key offerings
- Exhibits197: SWOT
- Exhibits198: East India Chemicals International - Overview
- Exhibits199: East India Chemicals International - Product / Service
- Exhibits200: East India Chemicals International - Key offerings
- Exhibits201: SWOT
- Exhibits202: Green Vision Technical Services Pvt Ltd - Overview
- Exhibits203: Green Vision Technical Services Pvt Ltd - Product / Service
- Exhibits204: Green Vision Technical Services Pvt Ltd - Key offerings
- Exhibits205: SWOT
- Exhibits206: INDIAN PLATINUM PVT LTD. - Overview
- Exhibits207: INDIAN PLATINUM PVT LTD. - Product / Service
- Exhibits208: INDIAN PLATINUM PVT LTD. - Key offerings
- Exhibits209: SWOT
- Exhibits210: Innova Corporate India - Overview
- Exhibits211: Innova Corporate India - Product / Service
- Exhibits212: Innova Corporate India - Key offerings
- Exhibits213: SWOT
- Exhibits214: Modison Metals Ltd. - Overview
- Exhibits215: Modison Metals Ltd. - Product / Service
- Exhibits216: Modison Metals Ltd. - Key offerings
- Exhibits217: SWOT
- Exhibits218: Otto Chemie Pvt. Ltd. - Overview
- Exhibits219: Otto Chemie Pvt. Ltd. - Product / Service
- Exhibits220: Otto Chemie Pvt. Ltd. - Key offerings
- Exhibits221: SWOT
- Exhibits222: Ralington Pharma LLP - Overview
- Exhibits223: Ralington Pharma LLP - Product / Service
- Exhibits224: Ralington Pharma LLP - Key offerings
- Exhibits225: SWOT
- Exhibits226: RXChemicals - Overview
- Exhibits227: RXChemicals - Product / Service
- Exhibits228: RXChemicals - Key offerings
- Exhibits229: SWOT
- Exhibits230: Sky Chem - Overview
- Exhibits231: Sky Chem - Product / Service
- Exhibits232: Sky Chem - Key offerings
- Exhibits233: SWOT
- Exhibits234: Texchem Industries - Overview
- Exhibits235: Texchem Industries - Product / Service
- Exhibits236: Texchem Industries - Key offerings
- Exhibits237: SWOT
- Exhibits238: Vizag Chemical International - Overview
- Exhibits239: Vizag Chemical International - Product / Service
- Exhibits240: Vizag Chemical International - Key offerings
- Exhibits241: SWOT
- Exhibits242: Inclusions checklist
- Exhibits243: Exclusions checklist
- Exhibits244: Currency conversion rates for US$
- Exhibits245: Research methodology
- Exhibits246: Information sources
- Exhibits247: Data validation
- Exhibits248: Validation techniques employed for market sizing
- Exhibits249: Data synthesis
- Exhibits250: 360 degree market analysis
- Exhibits251: List of abbreviations
The silver nitrate market is forecasted to grow by USD 3703.2 million during 2024-2029, accelerating at a CAGR of 5.4% during the forecast period. The report on the silver nitrate market provides a holistic analysis, market size and forecast, trends, growth drivers, and challenges, as well as vendor analysis covering around 25 vendors.
The report offers an up-to-date analysis regarding the current market scenario, the latest trends and drivers, and the overall market environment. The market is driven by growing demand for silver nitrate in healthcare sector, increased demand for silver nitrate in photography and jewelry applications, and low cost and easy availability of raw materials.
| Market Scope | |
|---|---|
| Base Year | 2025 |
| End Year | 2029 |
| Series Year | 2025-2029 |
| Growth Momentum | Accelerate |
| YOY 2025 | 5.3% |
| CAGR | 5.4% |
| Incremental Value | $3703.2 mn |
The study was conducted using an objective combination of primary and secondary information including inputs from key participants in the industry. The report contains a comprehensive market size data, segment with regional analysis and vendor landscape in addition to an analysis of the key companies. Reports have historic and forecast data.
Technavio's silver nitrate market is segmented as below:
By Grade Type
- Photographic grade
- Active pharmaceutical ingredient grade
- Analytical reagents grade
By Application
- Photography and jewelry
- Medical and healthcare
- Glass coating
- Others
By Type
- Crystal/powder
- Liquid solution
By Distribution Channel
- Offline
- Online
By Geographical Landscape
- North America
- APAC
- Europe
- South America
- Middle East and Africa
This study identifies the rising medical applications of silver nitrate as one of the prime reasons driving the silver nitrate market growth during the next few years. Also, increasing demand for analytical reagents and advancements in nanotechnology driving demand for silver nitrate will lead to sizable demand in the market.
The report on the silver nitrate market covers the following areas:
- Silver Nitrate Market sizing
- Silver Nitrate Market forecast
- Silver Nitrate Market industry analysis
The robust vendor analysis is designed to help clients improve their market position, and in line with this, this report provides a detailed analysis of several leading silver nitrate market vendors that include ACS Chemicals, Alpha Chemika, Ames Goldsmith Corp., Celtic Chemicals Ltd., Central Drug House P. Ltd., East India Chemicals International, Ennore India Chemical International, Fine Chemicals and Scientific Co., Green Vision Technical Services Pvt Ltd, INDIAN PLATINUM PVT LTD., Innova Corporate India, Marine Chemicals, Modison Metals Ltd., Otto Chemie Pvt. Ltd., Ralington Pharma LLP, RXChemicals, Sky Chem, Texchem Industries, Tung State, and Vizag Chemical International. Also, the silver nitrate market analysis report includes information on upcoming trends and challenges that will influence market growth. This is to help companies strategize and leverage all forthcoming growth opportunities.
The publisher presents a detailed picture of the market by the way of study, synthesis, and summation of data from multiple sources by an analysis of key parameters such as profit, pricing, competition, and promotions. It presents various market facets by identifying the key industry influencers. The data presented is comprehensive, reliable, and a result of extensive primary and secondary research. The market research reports provide a complete competitive landscape and an in-depth vendor selection methodology and analysis using qualitative and quantitative research to forecast accurate market growth.
Table of Contents
1 Executive Summary
- 1.1 Market overview
- Executive Summary - Chart on Market Overview
- Executive Summary - Data Table on Market Overview
- Executive Summary - Chart on Global Market Characteristics
- Executive Summary - Chart on Market By Geographical Landscape
- Executive Summary - Chart on Market Segmentation by Grade Type
- Executive Summary - Chart on Market Segmentation by Application
- Executive Summary - Chart on Market Segmentation by Type
- Executive Summary - Chart on Market Segmentation by Distribution Channel
- Executive Summary - Chart on Incremental Growth
- Executive Summary - Data Table on Incremental Growth
- Executive Summary - Chart on Company Market Positioning
2 Technavio Analysis
- 2.1 Analysis of price sensitivity, lifecycle, customer purchase basket, adoption rates, and purchase criteria
- Analysis of price sensitivity, lifecycle, customer purchase basket, adoption rates, and purchase criteria
- 2.2 Criticality of inputs and Factors of differentiation
- Overview on criticality of inputs and factors of differentiation
- 2.3 Factors of disruption
- Overview on factors of disruption
- 2.4 Impact of drivers and challenges
- Impact of drivers and challenges in 2024 and 2029
3 Market Landscape
- 3.1 Market ecosystem
- Parent Market
- Data Table on - Parent Market
- 3.2 Market characteristics
- Market characteristics analysis
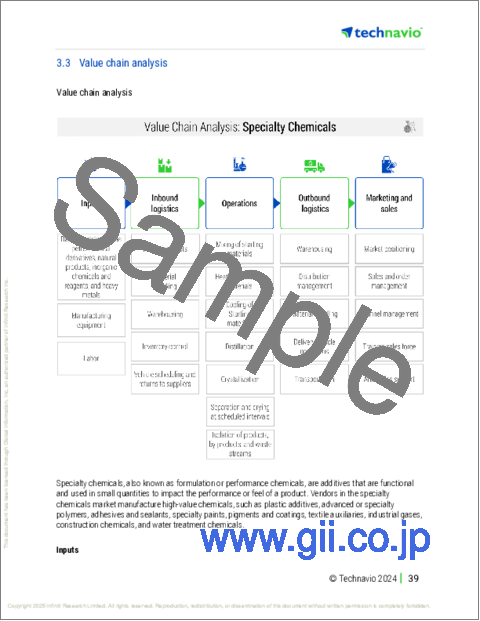
- 3.3 Value chain analysis
- Value chain analysis
4 Market Sizing
- 4.1 Market definition
- Offerings of companies included in the market definition
- 4.2 Market segment analysis
- Market segments
- 4.3 Market size 2024
- 4.4 Market outlook: Forecast for 2024-2029
- Chart on Global - Market size and forecast 2024-2029 ($ million)
- Data Table on Global - Market size and forecast 2024-2029 ($ million)
- Chart on Global Market: Year-over-year growth 2024-2029 (%)
- Data Table on Global Market: Year-over-year growth 2024-2029 (%)
5 Historic Market Size
- 5.1 Global Silver Nitrate Market 2019 - 2023
- Historic Market Size - Data Table on Global Silver Nitrate Market 2019 - 2023 ($ million)
- 5.2 Grade Type segment analysis 2019 - 2023
- Historic Market Size - Grade Type Segment 2019 - 2023 ($ million)
- 5.3 Application segment analysis 2019 - 2023
- Historic Market Size - Application Segment 2019 - 2023 ($ million)
- 5.4 Type segment analysis 2019 - 2023
- Historic Market Size - Type Segment 2019 - 2023 ($ million)
- 5.5 Distribution Channel segment analysis 2019 - 2023
- Historic Market Size - Distribution Channel Segment 2019 - 2023 ($ million)
- 5.6 Geography segment analysis 2019 - 2023
- Historic Market Size - Geography Segment 2019 - 2023 ($ million)
- 5.7 Country segment analysis 2019 - 2023
- Historic Market Size - Country Segment 2019 - 2023 ($ million)
6 Qualitative Analysis
- 6.1 Impact of AI on the Global Silver Nitrate Market
7 Five Forces Analysis
- 7.1 Five forces summary
- Five forces analysis - Comparison between 2024 and 2029
- 7.2 Bargaining power of buyers
- Bargaining power of buyers - Impact of key factors 2024 and 2029
- 7.3 Bargaining power of suppliers
- Bargaining power of suppliers - Impact of key factors in 2024 and 2029
- 7.4 Threat of new entrants
- Threat of new entrants - Impact of key factors in 2024 and 2029
- 7.5 Threat of substitutes
- Threat of substitutes - Impact of key factors in 2024 and 2029
- 7.6 Threat of rivalry
- Threat of rivalry - Impact of key factors in 2024 and 2029
- 7.7 Market condition
- Chart on Market condition - Five forces 2024 and 2029
8 Market Segmentation by Grade Type
- 8.1 Market segments
- Chart on Grade Type - Market share 2024-2029 (%)
- Data Table on Grade Type - Market share 2024-2029 (%)
- 8.2 Comparison by Grade Type
- Chart on Comparison by Grade Type
- Data Table on Comparison by Grade Type
- 8.3 Photographic grade - Market size and forecast 2024-2029
- Chart on Photographic grade - Market size and forecast 2024-2029 ($ million)
- Data Table on Photographic grade - Market size and forecast 2024-2029 ($ million)
- Chart on Photographic grade - Year-over-year growth 2024-2029 (%)
- Data Table on Photographic grade - Year-over-year growth 2024-2029 (%)
- 8.4 Active pharmaceutical ingredient grade - Market size and forecast 2024-2029
- Chart on Active pharmaceutical ingredient grade - Market size and forecast 2024-2029 ($ million)
- Data Table on Active pharmaceutical ingredient grade - Market size and forecast 2024-2029 ($ million)
- Chart on Active pharmaceutical ingredient grade - Year-over-year growth 2024-2029 (%)
- Data Table on Active pharmaceutical ingredient grade - Year-over-year growth 2024-2029 (%)
- 8.5 Analytical reagents grade - Market size and forecast 2024-2029
- Chart on Analytical reagents grade - Market size and forecast 2024-2029 ($ million)
- Data Table on Analytical reagents grade - Market size and forecast 2024-2029 ($ million)
- Chart on Analytical reagents grade - Year-over-year growth 2024-2029 (%)
- Data Table on Analytical reagents grade - Year-over-year growth 2024-2029 (%)
- 8.6 Market opportunity by Grade Type
- Market opportunity by Grade Type ($ million)
- Data Table on Market opportunity by Grade Type ($ million)
9 Market Segmentation by Application
- 9.1 Market segments
- Chart on Application - Market share 2024-2029 (%)
- Data Table on Application - Market share 2024-2029 (%)
- 9.2 Comparison by Application
- Chart on Comparison by Application
- Data Table on Comparison by Application
- 9.3 Photography and jewelry - Market size and forecast 2024-2029
- Chart on Photography and jewelry - Market size and forecast 2024-2029 ($ million)
- Data Table on Photography and jewelry - Market size and forecast 2024-2029 ($ million)
- Chart on Photography and jewelry - Year-over-year growth 2024-2029 (%)
- Data Table on Photography and jewelry - Year-over-year growth 2024-2029 (%)
- 9.4 Medical and healthcare - Market size and forecast 2024-2029
- Chart on Medical and healthcare - Market size and forecast 2024-2029 ($ million)
- Data Table on Medical and healthcare - Market size and forecast 2024-2029 ($ million)
- Chart on Medical and healthcare - Year-over-year growth 2024-2029 (%)
- Data Table on Medical and healthcare - Year-over-year growth 2024-2029 (%)
- 9.5 Glass coating - Market size and forecast 2024-2029
- Chart on Glass coating - Market size and forecast 2024-2029 ($ million)
- Data Table on Glass coating - Market size and forecast 2024-2029 ($ million)
- Chart on Glass coating - Year-over-year growth 2024-2029 (%)
- Data Table on Glass coating - Year-over-year growth 2024-2029 (%)
- 9.6 Others - Market size and forecast 2024-2029
- Chart on Others - Market size and forecast 2024-2029 ($ million)
- Data Table on Others - Market size and forecast 2024-2029 ($ million)
- Chart on Others - Year-over-year growth 2024-2029 (%)
- Data Table on Others - Year-over-year growth 2024-2029 (%)
- 9.7 Market opportunity by Application
- Market opportunity by Application ($ million)
- Data Table on Market opportunity by Application ($ million)
10 Market Segmentation by Type
- 10.1 Market segments
- Chart on Type - Market share 2024-2029 (%)
- Data Table on Type - Market share 2024-2029 (%)
- 10.2 Comparison by Type
- Chart on Comparison by Type
- Data Table on Comparison by Type
- 10.3 Crystal/powder - Market size and forecast 2024-2029
- Chart on Crystal/powder - Market size and forecast 2024-2029 ($ million)
- Data Table on Crystal/powder - Market size and forecast 2024-2029 ($ million)
- Chart on Crystal/powder - Year-over-year growth 2024-2029 (%)
- Data Table on Crystal/powder - Year-over-year growth 2024-2029 (%)
- 10.4 Liquid solution - Market size and forecast 2024-2029
- Chart on Liquid solution - Market size and forecast 2024-2029 ($ million)
- Data Table on Liquid solution - Market size and forecast 2024-2029 ($ million)
- Chart on Liquid solution - Year-over-year growth 2024-2029 (%)
- Data Table on Liquid solution - Year-over-year growth 2024-2029 (%)
- 10.5 Market opportunity by Type
- Market opportunity by Type ($ million)
- Data Table on Market opportunity by Type ($ million)
11 Market Segmentation by Distribution Channel
- 11.1 Market segments
- Chart on Distribution Channel - Market share 2024-2029 (%)
- Data Table on Distribution Channel - Market share 2024-2029 (%)
- 11.2 Comparison by Distribution Channel
- Chart on Comparison by Distribution Channel
- Data Table on Comparison by Distribution Channel
- 11.3 Offline - Market size and forecast 2024-2029
- Chart on Offline - Market size and forecast 2024-2029 ($ million)
- Data Table on Offline - Market size and forecast 2024-2029 ($ million)
- Chart on Offline - Year-over-year growth 2024-2029 (%)
- Data Table on Offline - Year-over-year growth 2024-2029 (%)
- 11.4 Online - Market size and forecast 2024-2029
- Chart on Online - Market size and forecast 2024-2029 ($ million)
- Data Table on Online - Market size and forecast 2024-2029 ($ million)
- Chart on Online - Year-over-year growth 2024-2029 (%)
- Data Table on Online - Year-over-year growth 2024-2029 (%)
- 11.5 Market opportunity by Distribution Channel
- Market opportunity by Distribution Channel ($ million)
- Data Table on Market opportunity by Distribution Channel ($ million)
12 Customer Landscape
- 12.1 Customer landscape overview
- Analysis of price sensitivity, lifecycle, customer purchase basket, adoption rates, and purchase criteria
13 Geographic Landscape
- 13.1 Geographic segmentation
- Chart on Market share By Geographical Landscape 2024-2029 (%)
- Data Table on Market share By Geographical Landscape 2024-2029 (%)
- 13.2 Geographic comparison
- Chart on Geographic comparison
- Data Table on Geographic comparison
- 13.3 North America - Market size and forecast 2024-2029
- Chart on North America - Market size and forecast 2024-2029 ($ million)
- Data Table on North America - Market size and forecast 2024-2029 ($ million)
- Chart on North America - Year-over-year growth 2024-2029 (%)
- Data Table on North America - Year-over-year growth 2024-2029 (%)
- 13.4 APAC - Market size and forecast 2024-2029
- Chart on APAC - Market size and forecast 2024-2029 ($ million)
- Data Table on APAC - Market size and forecast 2024-2029 ($ million)
- Chart on APAC - Year-over-year growth 2024-2029 (%)
- Data Table on APAC - Year-over-year growth 2024-2029 (%)
- 13.5 Europe - Market size and forecast 2024-2029
- Chart on Europe - Market size and forecast 2024-2029 ($ million)
- Data Table on Europe - Market size and forecast 2024-2029 ($ million)
- Chart on Europe - Year-over-year growth 2024-2029 (%)
- Data Table on Europe - Year-over-year growth 2024-2029 (%)
- 13.6 South America - Market size and forecast 2024-2029
- Chart on South America - Market size and forecast 2024-2029 ($ million)
- Data Table on South America - Market size and forecast 2024-2029 ($ million)
- Chart on South America - Year-over-year growth 2024-2029 (%)
- Data Table on South America - Year-over-year growth 2024-2029 (%)
- 13.7 Middle East and Africa - Market size and forecast 2024-2029
- Chart on Middle East and Africa - Market size and forecast 2024-2029 ($ million)
- Data Table on Middle East and Africa - Market size and forecast 2024-2029 ($ million)
- Chart on Middle East and Africa - Year-over-year growth 2024-2029 (%)
- Data Table on Middle East and Africa - Year-over-year growth 2024-2029 (%)
- 13.8 US - Market size and forecast 2024-2029
- Chart on US - Market size and forecast 2024-2029 ($ million)
- Data Table on US - Market size and forecast 2024-2029 ($ million)
- Chart on US - Year-over-year growth 2024-2029 (%)
- Data Table on US - Year-over-year growth 2024-2029 (%)
- 13.9 China - Market size and forecast 2024-2029
- Chart on China - Market size and forecast 2024-2029 ($ million)
- Data Table on China - Market size and forecast 2024-2029 ($ million)
- Chart on China - Year-over-year growth 2024-2029 (%)
- Data Table on China - Year-over-year growth 2024-2029 (%)
- 13.10 Japan - Market size and forecast 2024-2029
- Chart on Japan - Market size and forecast 2024-2029 ($ million)
- Data Table on Japan - Market size and forecast 2024-2029 ($ million)
- Chart on Japan - Year-over-year growth 2024-2029 (%)
- Data Table on Japan - Year-over-year growth 2024-2029 (%)
- 13.11 Canada - Market size and forecast 2024-2029
- Chart on Canada - Market size and forecast 2024-2029 ($ million)
- Data Table on Canada - Market size and forecast 2024-2029 ($ million)
- Chart on Canada - Year-over-year growth 2024-2029 (%)
- Data Table on Canada - Year-over-year growth 2024-2029 (%)
- 13.12 India - Market size and forecast 2024-2029
- Chart on India - Market size and forecast 2024-2029 ($ million)
- Data Table on India - Market size and forecast 2024-2029 ($ million)
- Chart on India - Year-over-year growth 2024-2029 (%)
- Data Table on India - Year-over-year growth 2024-2029 (%)
- 13.13 Germany - Market size and forecast 2024-2029
- Chart on Germany - Market size and forecast 2024-2029 ($ million)
- Data Table on Germany - Market size and forecast 2024-2029 ($ million)
- Chart on Germany - Year-over-year growth 2024-2029 (%)
- Data Table on Germany - Year-over-year growth 2024-2029 (%)
- 13.14 South Korea - Market size and forecast 2024-2029
- Chart on South Korea - Market size and forecast 2024-2029 ($ million)
- Data Table on South Korea - Market size and forecast 2024-2029 ($ million)
- Chart on South Korea - Year-over-year growth 2024-2029 (%)
- Data Table on South Korea - Year-over-year growth 2024-2029 (%)
- 13.15 UK - Market size and forecast 2024-2029
- Chart on UK - Market size and forecast 2024-2029 ($ million)
- Data Table on UK - Market size and forecast 2024-2029 ($ million)
- Chart on UK - Year-over-year growth 2024-2029 (%)
- Data Table on UK - Year-over-year growth 2024-2029 (%)
- 13.16 Brazil - Market size and forecast 2024-2029
- Chart on Brazil - Market size and forecast 2024-2029 ($ million)
- Data Table on Brazil - Market size and forecast 2024-2029 ($ million)
- Chart on Brazil - Year-over-year growth 2024-2029 (%)
- Data Table on Brazil - Year-over-year growth 2024-2029 (%)
- 13.17 France - Market size and forecast 2024-2029
- Chart on France - Market size and forecast 2024-2029 ($ million)
- Data Table on France - Market size and forecast 2024-2029 ($ million)
- Chart on France - Year-over-year growth 2024-2029 (%)
- Data Table on France - Year-over-year growth 2024-2029 (%)
- 13.18 Market opportunity By Geographical Landscape
- Market opportunity By Geographical Landscape ($ million)
- Data Tables on Market opportunity By Geographical Landscape ($ million)
14 Drivers, Challenges, and Opportunity/Restraints
- 14.1 Market drivers
- 14.2 Market challenges
- 14.3 Impact of drivers and challenges
- Impact of drivers and challenges in 2024 and 2029
- 14.4 Market opportunities/restraints
15 Competitive Landscape
- 15.1 Overview
- 15.2 Competitive Landscape
- Overview on criticality of inputs and factors of differentiation
- 15.3 Landscape disruption
- Overview on factors of disruption
- 15.4 Industry risks
- Impact of key risks on business
16 Competitive Analysis
- 16.1 Companies profiled
- Companies covered
- 16.2 Company ranking index
- Company ranking index
- 16.3 Market positioning of companies
- Matrix on companies position and classification
- 16.4 ACS Chemicals
- ACS Chemicals - Overview
- ACS Chemicals - Product / Service
- ACS Chemicals - Key offerings
- SWOT
- 16.5 Alpha Chemika
- Alpha Chemika - Overview
- Alpha Chemika - Product / Service
- Alpha Chemika - Key offerings
- SWOT
- 16.6 Ames Goldsmith Corp.
- Ames Goldsmith Corp. - Overview
- Ames Goldsmith Corp. - Product / Service
- Ames Goldsmith Corp. - Key offerings
- SWOT
- 16.7 Celtic Chemicals Ltd.
- Celtic Chemicals Ltd. - Overview
- Celtic Chemicals Ltd. - Product / Service
- Celtic Chemicals Ltd. - Key offerings
- SWOT
- 16.8 East India Chemicals International
- East India Chemicals International - Overview
- East India Chemicals International - Product / Service
- East India Chemicals International - Key offerings
- SWOT
- 16.9 Green Vision Technical Services Pvt Ltd
- Green Vision Technical Services Pvt Ltd - Overview
- Green Vision Technical Services Pvt Ltd - Product / Service
- Green Vision Technical Services Pvt Ltd - Key offerings
- SWOT
- 16.10 INDIAN PLATINUM PVT LTD.
- INDIAN PLATINUM PVT LTD. - Overview
- INDIAN PLATINUM PVT LTD. - Product / Service
- INDIAN PLATINUM PVT LTD. - Key offerings
- SWOT
- 16.11 Innova Corporate India
- Innova Corporate India - Overview
- Innova Corporate India - Product / Service
- Innova Corporate India - Key offerings
- SWOT
- 16.12 Modison Metals Ltd.
- Modison Metals Ltd. - Overview
- Modison Metals Ltd. - Product / Service
- Modison Metals Ltd. - Key offerings
- SWOT
- 16.13 Otto Chemie Pvt. Ltd.
- Otto Chemie Pvt. Ltd. - Overview
- Otto Chemie Pvt. Ltd. - Product / Service
- Otto Chemie Pvt. Ltd. - Key offerings
- SWOT
- 16.14 Ralington Pharma LLP
- Ralington Pharma LLP - Overview
- Ralington Pharma LLP - Product / Service
- Ralington Pharma LLP - Key offerings
- SWOT
- 16.15 RXChemicals
- RXChemicals - Overview
- RXChemicals - Product / Service
- RXChemicals - Key offerings
- SWOT
- 16.16 Sky Chem
- Sky Chem - Overview
- Sky Chem - Product / Service
- Sky Chem - Key offerings
- SWOT
- 16.17 Texchem Industries
- Texchem Industries - Overview
- Texchem Industries - Product / Service
- Texchem Industries - Key offerings
- SWOT
- 16.18 Vizag Chemical International
- Vizag Chemical International - Overview
- Vizag Chemical International - Product / Service
- Vizag Chemical International - Key offerings
- SWOT
17 Appendix
- 17.1 Scope of the report
- 17.2 Inclusions and exclusions checklist
- Inclusions checklist
- Exclusions checklist
- 17.3 Currency conversion rates for US$
- Currency conversion rates for US$
- 17.4 Research methodology
- Research methodology
- 17.5 Data procurement
- Information sources
- 17.6 Data validation
- Data validation
- 17.7 Validation techniques employed for market sizing
- Validation techniques employed for market sizing
- 17.8 Data synthesis
- Data synthesis
- 17.9 360 degree market analysis
- 360 degree market analysis
- 17.10 List of abbreviations
- List of abbreviations
- Infrastructure development projects

