|
|
市場調査レポート
商品コード
1626999
研削ロボットの世界市場 2024-2028年Global Grinding Robots Market 2024-2028 |
||||||

|
|||||||
カスタマイズ可能
|
|||||||


| 研削ロボットの世界市場 2024-2028年 |
|
出版日: 2024年07月31日
発行: TechNavio
ページ情報: 英文 181 Pages
納期: 即納可能
|

全表示
- 概要
- 図表
- 目次
研削ロボット市場 2024-2028年
研削ロボット市場は2023-2028年に6,280万米ドル、予測期間中のCAGRは6.79%で成長すると予測されます。当レポートでは、研削ロボット市場の全体的な分析、市場規模・予測、動向、成長促進要因、課題、約25のベンダーを網羅したベンダー分析などを掲載しています。
現在の市場シナリオ、最新動向と促進要因、市場環境全体に関する最新分析を提供しています。研削ロボットのCNCマシンに対する優位性、複雑な研削作業へのロボットの応用、研削ロボットの技術進歩などが市場を牽引しています。
| 市場範囲 | |
|---|---|
| 基準年 | 2024 |
| 終了年 | 2028 |
| 予測期間 | 2024-2028 |
| 成長モメンタム | 加速 |
| 前年比2024年 | 6.25% |
| CAGR | 6.79% |
| 増分額 | 6,280万米ドル |
本調査では、力制御センサー技術の進歩が、今後数年間の研削ロボット市場成長を促進する主な要因の1つであるとしています。また、研削ロボットビジョンシステムの改善や研削ロボットの統合を促進する技術革新は、市場の大きな需要につながります。
目次
第1章 エグゼクティブサマリー
- 市場概要
第2章 市場情勢
- 市場エコシステム
- 市場の特徴
- バリューチェーン分析
第3章 市場規模
- 市場の定義
- 市場セグメント分析
- 市場規模 2023
- 市場の見通し 2023-2028
第4章 市場規模実績
- 研削ロボットの世界市場 2018-2022
- ソリューション別セグメント分析 2018-2022
- エンドユーザー別セグメント分析 2018-2022
- 地域別セグメント分析 2018-2022
- 国別セグメント分析 2018-2022
第5章 ファイブフォース分析
- ファイブフォースの要約
- 買い手の交渉力
- 供給企業の交渉力
- 新規参入業者の脅威
- 代替品の脅威
- 競争の脅威
- 市況
第6章 市場セグメンテーション:ソリューション別
- 市場セグメント
- 比較:ソリューション別
- ソフトウェア:市場規模と予測 2023-2028
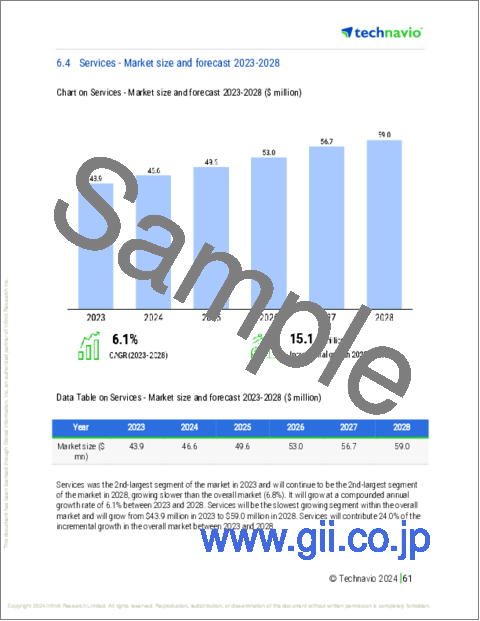
- サービス:市場規模と予測 2023-2028
- ハードウェア:市場規模と予測 2023-2028
- 市場機会:ソリューション別
第7章 市場セグメンテーション:エンドユーザー別
- 市場セグメント
- 比較:エンドユーザー別
- 自動車部門:市場規模と予測 2023-2028
- 金属・機械部門:市場規模と予測 2023-2028
- 航空宇宙および防衛部門:市場規模と予測 2023-2028
- その他:市場規模と予測 2023-2028
- 市場機会:エンドユーザー別
第8章 顧客情勢
- 顧客情勢の概要
第9章 地域別情勢
- 地域別セグメンテーション
- 地域別比較
- アジア太平洋:市場規模と予測 2023-2028
- 欧州:市場規模と予測 2023-2028
- 北米:市場規模と予測 2023-2028
- 中東・アフリカ:市場規模と予測 2023-2028
- 南米:市場規模と予測 2023-2028
- 中国:市場規模と予測 2023-2028
- 米国:市場規模と予測 2023-2028
- ドイツ:市場規模と予測 2023-2028
- 日本:市場規模と予測 2023-2028
- フランス:市場規模と予測 2023-2028
- 市場機会:地域情勢別
第10章 促進要因・課題・機会・抑制要因
- 市場促進要因
- 市場の課題
- 促進要因と課題の影響
- 市場の機会・抑制要因
第11章 競合情勢
- 概要
- 競合情勢
- 混乱の状況
- 業界のリスク
第12章 競合分析
- 企業プロファイル
- 企業の市場ポジショニング
- ABB Ltd.
- Acme Manufacturing
- Danbach Robot Jiangxi Inc.
- FANUC Corp.
- Heinz Berger Maschinenfabrik GmbH and Co. KG
- Kawasaki Heavy Industries Ltd.
- MESH Automation Inc.
- MIDEA Group Co. Ltd.
- Mitsubishi Electric Corp.
- NACHI FUJIKOSHI Corp.
- PushCorp Inc.
- Seiko Epson Corp.
- Teqram BV
- Yaskawa Electric Corp.
第13章 付録
Exhibits:
- Exhibits1: Executive Summary - Chart on Market Overview
- Exhibits2: Executive Summary - Data Table on Market Overview
- Exhibits3: Executive Summary - Chart on Global Market Characteristics
- Exhibits4: Executive Summary - Chart on Market By Geographical Landscape
- Exhibits5: Executive Summary - Chart on Market Segmentation by Solution
- Exhibits6: Executive Summary - Chart on Market Segmentation by End-user
- Exhibits7: Executive Summary - Chart on Incremental Growth
- Exhibits8: Executive Summary - Data Table on Incremental Growth
- Exhibits9: Executive Summary - Chart on Company Market Positioning
- Exhibits10: Parent Market
- Exhibits11: Data Table on - Parent Market
- Exhibits12: Market characteristics analysis
- Exhibits13: Value Chain Analysis
- Exhibits14: Offerings of companies included in the market definition
- Exhibits15: Market segments
- Exhibits16: Chart on Global - Market size and forecast 2023-2028 ($ million)
- Exhibits17: Data Table on Global - Market size and forecast 2023-2028 ($ million)
- Exhibits18: Chart on Global Market: Year-over-year growth 2023-2028 (%)
- Exhibits19: Data Table on Global Market: Year-over-year growth 2023-2028 (%)
- Exhibits20: Historic Market Size - Data Table on Global Grinding Robots Market 2018 - 2022 ($ million)
- Exhibits21: Historic Market Size - Solution Segment 2018 - 2022 ($ million)
- Exhibits22: Historic Market Size - End-user Segment 2018 - 2022 ($ million)
- Exhibits23: Historic Market Size - Geography Segment 2018 - 2022 ($ million)
- Exhibits24: Historic Market Size - Country Segment 2018 - 2022 ($ million)
- Exhibits25: Five forces analysis - Comparison between 2023 and 2028
- Exhibits26: Bargaining power of buyers - Impact of key factors 2023 and 2028
- Exhibits27: Bargaining power of suppliers - Impact of key factors in 2023 and 2028
- Exhibits28: Threat of new entrants - Impact of key factors in 2023 and 2028
- Exhibits29: Threat of substitutes - Impact of key factors in 2023 and 2028
- Exhibits30: Threat of rivalry - Impact of key factors in 2023 and 2028
- Exhibits31: Chart on Market condition - Five forces 2023 and 2028
- Exhibits32: Chart on Solution - Market share 2023-2028 (%)
- Exhibits33: Data Table on Solution - Market share 2023-2028 (%)
- Exhibits34: Chart on Comparison by Solution
- Exhibits35: Data Table on Comparison by Solution
- Exhibits36: Chart on Software - Market size and forecast 2023-2028 ($ million)
- Exhibits37: Data Table on Software - Market size and forecast 2023-2028 ($ million)
- Exhibits38: Chart on Software - Year-over-year growth 2023-2028 (%)
- Exhibits39: Data Table on Software - Year-over-year growth 2023-2028 (%)
- Exhibits40: Chart on Services - Market size and forecast 2023-2028 ($ million)
- Exhibits41: Data Table on Services - Market size and forecast 2023-2028 ($ million)
- Exhibits42: Chart on Services - Year-over-year growth 2023-2028 (%)
- Exhibits43: Data Table on Services - Year-over-year growth 2023-2028 (%)
- Exhibits44: Chart on Hardware - Market size and forecast 2023-2028 ($ million)
- Exhibits45: Data Table on Hardware - Market size and forecast 2023-2028 ($ million)
- Exhibits46: Chart on Hardware - Year-over-year growth 2023-2028 (%)
- Exhibits47: Data Table on Hardware - Year-over-year growth 2023-2028 (%)
- Exhibits48: Market opportunity by Solution ($ million)
- Exhibits49: Data Table on Market opportunity by Solution ($ million)
- Exhibits50: Chart on End-user - Market share 2023-2028 (%)
- Exhibits51: Data Table on End-user - Market share 2023-2028 (%)
- Exhibits52: Chart on Comparison by End-user
- Exhibits53: Data Table on Comparison by End-user
- Exhibits54: Chart on Automotive sector - Market size and forecast 2023-2028 ($ million)
- Exhibits55: Data Table on Automotive sector - Market size and forecast 2023-2028 ($ million)
- Exhibits56: Chart on Automotive sector - Year-over-year growth 2023-2028 (%)
- Exhibits57: Data Table on Automotive sector - Year-over-year growth 2023-2028 (%)
- Exhibits58: Chart on Metals and machinery sector - Market size and forecast 2023-2028 ($ million)
- Exhibits59: Data Table on Metals and machinery sector - Market size and forecast 2023-2028 ($ million)
- Exhibits60: Chart on Metals and machinery sector - Year-over-year growth 2023-2028 (%)
- Exhibits61: Data Table on Metals and machinery sector - Year-over-year growth 2023-2028 (%)
- Exhibits62: Chart on Aerospace and defense sector - Market size and forecast 2023-2028 ($ million)
- Exhibits63: Data Table on Aerospace and defense sector - Market size and forecast 2023-2028 ($ million)
- Exhibits64: Chart on Aerospace and defense sector - Year-over-year growth 2023-2028 (%)
- Exhibits65: Data Table on Aerospace and defense sector - Year-over-year growth 2023-2028 (%)
- Exhibits66: Chart on Others - Market size and forecast 2023-2028 ($ million)
- Exhibits67: Data Table on Others - Market size and forecast 2023-2028 ($ million)
- Exhibits68: Chart on Others - Year-over-year growth 2023-2028 (%)
- Exhibits69: Data Table on Others - Year-over-year growth 2023-2028 (%)
- Exhibits70: Market opportunity by End-user ($ million)
- Exhibits71: Data Table on Market opportunity by End-user ($ million)
- Exhibits72: Analysis of price sensitivity, lifecycle, customer purchase basket, adoption rates, and purchase criteria
- Exhibits73: Chart on Market share By Geographical Landscape 2023-2028 (%)
- Exhibits74: Data Table on Market share By Geographical Landscape 2023-2028 (%)
- Exhibits75: Chart on Geographic comparison
- Exhibits76: Data Table on Geographic comparison
- Exhibits77: Chart on APAC - Market size and forecast 2023-2028 ($ million)
- Exhibits78: Data Table on APAC - Market size and forecast 2023-2028 ($ million)
- Exhibits79: Chart on APAC - Year-over-year growth 2023-2028 (%)
- Exhibits80: Data Table on APAC - Year-over-year growth 2023-2028 (%)
- Exhibits81: Chart on Europe - Market size and forecast 2023-2028 ($ million)
- Exhibits82: Data Table on Europe - Market size and forecast 2023-2028 ($ million)
- Exhibits83: Chart on Europe - Year-over-year growth 2023-2028 (%)
- Exhibits84: Data Table on Europe - Year-over-year growth 2023-2028 (%)
- Exhibits85: Chart on North America - Market size and forecast 2023-2028 ($ million)
- Exhibits86: Data Table on North America - Market size and forecast 2023-2028 ($ million)
- Exhibits87: Chart on North America - Year-over-year growth 2023-2028 (%)
- Exhibits88: Data Table on North America - Year-over-year growth 2023-2028 (%)
- Exhibits89: Chart on Middle East and Africa - Market size and forecast 2023-2028 ($ million)
- Exhibits90: Data Table on Middle East and Africa - Market size and forecast 2023-2028 ($ million)
- Exhibits91: Chart on Middle East and Africa - Year-over-year growth 2023-2028 (%)
- Exhibits92: Data Table on Middle East and Africa - Year-over-year growth 2023-2028 (%)
- Exhibits93: Chart on South America - Market size and forecast 2023-2028 ($ million)
- Exhibits94: Data Table on South America - Market size and forecast 2023-2028 ($ million)
- Exhibits95: Chart on South America - Year-over-year growth 2023-2028 (%)
- Exhibits96: Data Table on South America - Year-over-year growth 2023-2028 (%)
- Exhibits97: Chart on China - Market size and forecast 2023-2028 ($ million)
- Exhibits98: Data Table on China - Market size and forecast 2023-2028 ($ million)
- Exhibits99: Chart on China - Year-over-year growth 2023-2028 (%)
- Exhibits100: Data Table on China - Year-over-year growth 2023-2028 (%)
- Exhibits101: Chart on US - Market size and forecast 2023-2028 ($ million)
- Exhibits102: Data Table on US - Market size and forecast 2023-2028 ($ million)
- Exhibits103: Chart on US - Year-over-year growth 2023-2028 (%)
- Exhibits104: Data Table on US - Year-over-year growth 2023-2028 (%)
- Exhibits105: Chart on Germany - Market size and forecast 2023-2028 ($ million)
- Exhibits106: Data Table on Germany - Market size and forecast 2023-2028 ($ million)
- Exhibits107: Chart on Germany - Year-over-year growth 2023-2028 (%)
- Exhibits108: Data Table on Germany - Year-over-year growth 2023-2028 (%)
- Exhibits109: Chart on Japan - Market size and forecast 2023-2028 ($ million)
- Exhibits110: Data Table on Japan - Market size and forecast 2023-2028 ($ million)
- Exhibits111: Chart on Japan - Year-over-year growth 2023-2028 (%)
- Exhibits112: Data Table on Japan - Year-over-year growth 2023-2028 (%)
- Exhibits113: Chart on France - Market size and forecast 2023-2028 ($ million)
- Exhibits114: Data Table on France - Market size and forecast 2023-2028 ($ million)
- Exhibits115: Chart on France - Year-over-year growth 2023-2028 (%)
- Exhibits116: Data Table on France - Year-over-year growth 2023-2028 (%)
- Exhibits117: Market opportunity By Geographical Landscape ($ million)
- Exhibits118: Data Tables on Market opportunity By Geographical Landscape ($ million)
- Exhibits119: Impact of drivers and challenges in 2023 and 2028
- Exhibits120: Overview on criticality of inputs and factors of differentiation
- Exhibits121: Overview on factors of disruption
- Exhibits122: Impact of key risks on business
- Exhibits123: Companies covered
- Exhibits124: Matrix on companies position and classification
- Exhibits125: 3M Co. - Overview
- Exhibits126: 3M Co. - Business segments
- Exhibits127: 3M Co. - Key news
- Exhibits128: 3M Co. - Key offerings
- Exhibits129: 3M Co. - Segment focus
- Exhibits130: ABB Ltd. - Overview
- Exhibits131: ABB Ltd. - Business segments
- Exhibits132: ABB Ltd. - Key news
- Exhibits133: ABB Ltd. - Key offerings
- Exhibits134: ABB Ltd. - Segment focus
- Exhibits135: Acme Manufacturing - Overview
- Exhibits136: Acme Manufacturing - Product / Service
- Exhibits137: Acme Manufacturing - Key offerings
- Exhibits138: Danbach Robot Jiangxi Inc. - Overview
- Exhibits139: Danbach Robot Jiangxi Inc. - Product / Service
- Exhibits140: Danbach Robot Jiangxi Inc. - Key offerings
- Exhibits141: FANUC Corp. - Overview
- Exhibits142: FANUC Corp. - Product / Service
- Exhibits143: FANUC Corp. - Key news
- Exhibits144: FANUC Corp. - Key offerings
- Exhibits145: Heinz Berger Maschinenfabrik GmbH and Co. KG - Overview
- Exhibits146: Heinz Berger Maschinenfabrik GmbH and Co. KG - Product / Service
- Exhibits147: Heinz Berger Maschinenfabrik GmbH and Co. KG - Key offerings
- Exhibits148: Kawasaki Heavy Industries Ltd. - Overview
- Exhibits149: Kawasaki Heavy Industries Ltd. - Business segments
- Exhibits150: Kawasaki Heavy Industries Ltd. - Key news
- Exhibits151: Kawasaki Heavy Industries Ltd. - Key offerings
- Exhibits152: Kawasaki Heavy Industries Ltd. - Segment focus
- Exhibits153: MESH Automation Inc. - Overview
- Exhibits154: MESH Automation Inc. - Product / Service
- Exhibits155: MESH Automation Inc. - Key offerings
- Exhibits156: MIDEA Group Co. Ltd. - Overview
- Exhibits157: MIDEA Group Co. Ltd. - Product / Service
- Exhibits158: MIDEA Group Co. Ltd. - Key news
- Exhibits159: MIDEA Group Co. Ltd. - Key offerings
- Exhibits160: Mitsubishi Electric Corp. - Overview
- Exhibits161: Mitsubishi Electric Corp. - Business segments
- Exhibits162: Mitsubishi Electric Corp. - Key news
- Exhibits163: Mitsubishi Electric Corp. - Key offerings
- Exhibits164: Mitsubishi Electric Corp. - Segment focus
- Exhibits165: NACHI FUJIKOSHI Corp. - Overview
- Exhibits166: NACHI FUJIKOSHI Corp. - Business segments
- Exhibits167: NACHI FUJIKOSHI Corp. - Key news
- Exhibits168: NACHI FUJIKOSHI Corp. - Key offerings
- Exhibits169: NACHI FUJIKOSHI Corp. - Segment focus
- Exhibits170: PushCorp Inc. - Overview
- Exhibits171: PushCorp Inc. - Product / Service
- Exhibits172: PushCorp Inc. - Key offerings
- Exhibits173: Seiko Epson Corp. - Overview
- Exhibits174: Seiko Epson Corp. - Business segments
- Exhibits175: Seiko Epson Corp. - Key news
- Exhibits176: Seiko Epson Corp. - Key offerings
- Exhibits177: Seiko Epson Corp. - Segment focus
- Exhibits178: Teqram BV - Overview
- Exhibits179: Teqram BV - Product / Service
- Exhibits180: Teqram BV - Key offerings
- Exhibits181: Yaskawa Electric Corp. - Overview
- Exhibits182: Yaskawa Electric Corp. - Business segments
- Exhibits183: Yaskawa Electric Corp. - Key news
- Exhibits184: Yaskawa Electric Corp. - Key offerings
- Exhibits185: Yaskawa Electric Corp. - Segment focus
- Exhibits186: Inclusions checklist
- Exhibits187: Exclusions checklist
- Exhibits188: Currency conversion rates for US$
- Exhibits189: Research methodology
- Exhibits190: Information sources
- Exhibits191: Data validation
- Exhibits192: Validation techniques employed for market sizing
- Exhibits193: Data synthesis
- Exhibits194: 360 degree market analysis
- Exhibits195: List of abbreviations
Grinding Robots Market 2024-2028
The grinding robots market is forecasted to grow by USD 62.8 mn during 2023-2028, accelerating at a CAGR of 6.79% during the forecast period. The report on the grinding robots market provides a holistic analysis, market size and forecast, trends, growth drivers, and challenges, as well as vendor analysis covering around 25 vendors.
The report offers an up-to-date analysis regarding the current market scenario, the latest trends and drivers, and the overall market environment. The market is driven by advantages of grinding robots over cnc machines, applications of robots in complex grinding tasks, and technological advances in grinding robots.
| Market Scope | |
|---|---|
| Base Year | 2024 |
| End Year | 2028 |
| Series Year | 2024-2028 |
| Growth Momentum | Accelerate |
| YOY 2024 | 6.25% |
| CAGR | 6.79% |
| Incremental Value | $62.8 mn |
Technavio's grinding robots market is segmented as below:
By Solution
- Software
- Services
- Hardware
By End-user
- Automotive sector
- Metals and machinery sector
- Aerospace and defense sector
- Others
By Geographical Landscape
- APAC
- Europe
- North America
- Middle East and Africa
- South America
This study identifies the advancements in force control sensor technologies as one of the prime reasons driving the grinding robots market growth during the next few years. Also, improvements in grinding robot vision systems and innovations to facilitate integration of grinding robots will lead to sizable demand in the market.
The report on the grinding robots market covers the following areas:
- Grinding Robots Market sizing
- Grinding Robots Market forecast
- Grinding Robots Market industry analysis
The robust vendor analysis is designed to help clients improve their market position, and in line with this, this report provides a detailed analysis of several leading grinding robots market vendors that include 3M Co., ABB Ltd., Accord Corp., Acme Manufacturing, Danbach Robot Jiangxi Inc., Daru Technology Suzhou Co. Ltd., FANUC Corp., Force Robots, Heinz Berger Maschinenfabrik GmbH and Co. KG, Kawasaki Heavy Industries Ltd., MESH Automation Inc., MIDEA Group Co. Ltd., Mitsubishi Electric Corp., NACHI FUJIKOSHI Corp., PushCorp Inc., Reichmann and Sohn GmbH, Seiko Epson Corp., SUHNER Schweiz AG, Teqram BV, and Yaskawa Electric Corp.. Also, the grinding robots market analysis report includes information on upcoming trends and challenges that will influence market growth. This is to help companies strategize and leverage all forthcoming growth opportunities.
The study was conducted using an objective combination of primary and secondary information including inputs from key participants in the industry. The report contains a comprehensive market and vendor landscape in addition to an analysis of the key vendors.
The publisher presents a detailed picture of the market by the way of study, synthesis, and summation of data from multiple sources by an analysis of key parameters such as profit, pricing, competition, and promotions. It presents various market facets by identifying the key industry influencers. The data presented is comprehensive, reliable, and a result of extensive primary and secondary research. The market research reports provide a complete competitive landscape and an in-depth vendor selection methodology and analysis using qualitative and quantitative research to forecast accurate market growth.
Table of Contents
1 Executive Summary
- 1.1 Market overview
- Executive Summary - Chart on Market Overview
- Executive Summary - Data Table on Market Overview
- Executive Summary - Chart on Global Market Characteristics
- Executive Summary - Chart on Market By Geographical Landscape
- Executive Summary - Chart on Market Segmentation by Solution
- Executive Summary - Chart on Market Segmentation by End-user
- Executive Summary - Chart on Incremental Growth
- Executive Summary - Data Table on Incremental Growth
- Executive Summary - Chart on Company Market Positioning
2 Market Landscape
- 2.1 Market ecosystem
- Parent Market
- Data Table on - Parent Market
- 2.2 Market characteristics
- Market characteristics analysis
- 2.3 Value chain analysis
- Value Chain Analysis
3 Market Sizing
- 3.1 Market definition
- Offerings of companies included in the market definition
- 3.2 Market segment analysis
- Market segments
- 3.3 Market size 2023
- 3.4 Market outlook: Forecast for 2023-2028
- Chart on Global - Market size and forecast 2023-2028 ($ million)
- Data Table on Global - Market size and forecast 2023-2028 ($ million)
- Chart on Global Market: Year-over-year growth 2023-2028 (%)
- Data Table on Global Market: Year-over-year growth 2023-2028 (%)
4 Historic Market Size
- 4.1 Global Grinding Robots Market 2018 - 2022
- Historic Market Size - Data Table on Global Grinding Robots Market 2018 - 2022 ($ million)
- 4.2 Solution segment analysis 2018 - 2022
- Historic Market Size - Solution Segment 2018 - 2022 ($ million)
- 4.3 End-user segment analysis 2018 - 2022
- Historic Market Size - End-user Segment 2018 - 2022 ($ million)
- 4.4 Geography segment analysis 2018 - 2022
- Historic Market Size - Geography Segment 2018 - 2022 ($ million)
- 4.5 Country segment analysis 2018 - 2022
- Historic Market Size - Country Segment 2018 - 2022 ($ million)
5 Five Forces Analysis
- 5.1 Five forces summary
- Five forces analysis - Comparison between 2023 and 2028
- 5.2 Bargaining power of buyers
- Bargaining power of buyers - Impact of key factors 2023 and 2028
- 5.3 Bargaining power of suppliers
- Bargaining power of suppliers - Impact of key factors in 2023 and 2028
- 5.4 Threat of new entrants
- Threat of new entrants - Impact of key factors in 2023 and 2028
- 5.5 Threat of substitutes
- Threat of substitutes - Impact of key factors in 2023 and 2028
- 5.6 Threat of rivalry
- Threat of rivalry - Impact of key factors in 2023 and 2028
- 5.7 Market condition
- Chart on Market condition - Five forces 2023 and 2028
6 Market Segmentation by Solution
- 6.1 Market segments
- Chart on Solution - Market share 2023-2028 (%)
- Data Table on Solution - Market share 2023-2028 (%)
- 6.2 Comparison by Solution
- Chart on Comparison by Solution
- Data Table on Comparison by Solution
- 6.3 Software - Market size and forecast 2023-2028
- Chart on Software - Market size and forecast 2023-2028 ($ million)
- Data Table on Software - Market size and forecast 2023-2028 ($ million)
- Chart on Software - Year-over-year growth 2023-2028 (%)
- Data Table on Software - Year-over-year growth 2023-2028 (%)
- 6.4 Services - Market size and forecast 2023-2028
- Chart on Services - Market size and forecast 2023-2028 ($ million)
- Data Table on Services - Market size and forecast 2023-2028 ($ million)
- Chart on Services - Year-over-year growth 2023-2028 (%)
- Data Table on Services - Year-over-year growth 2023-2028 (%)
- 6.5 Hardware - Market size and forecast 2023-2028
- Chart on Hardware - Market size and forecast 2023-2028 ($ million)
- Data Table on Hardware - Market size and forecast 2023-2028 ($ million)
- Chart on Hardware - Year-over-year growth 2023-2028 (%)
- Data Table on Hardware - Year-over-year growth 2023-2028 (%)
- 6.6 Market opportunity by Solution
- Market opportunity by Solution ($ million)
- Data Table on Market opportunity by Solution ($ million)
7 Market Segmentation by End-user
- 7.1 Market segments
- Chart on End-user - Market share 2023-2028 (%)
- Data Table on End-user - Market share 2023-2028 (%)
- 7.2 Comparison by End-user
- Chart on Comparison by End-user
- Data Table on Comparison by End-user
- 7.3 Automotive sector - Market size and forecast 2023-2028
- Chart on Automotive sector - Market size and forecast 2023-2028 ($ million)
- Data Table on Automotive sector - Market size and forecast 2023-2028 ($ million)
- Chart on Automotive sector - Year-over-year growth 2023-2028 (%)
- Data Table on Automotive sector - Year-over-year growth 2023-2028 (%)
- 7.4 Metals and machinery sector - Market size and forecast 2023-2028
- Chart on Metals and machinery sector - Market size and forecast 2023-2028 ($ million)
- Data Table on Metals and machinery sector - Market size and forecast 2023-2028 ($ million)
- Chart on Metals and machinery sector - Year-over-year growth 2023-2028 (%)
- Data Table on Metals and machinery sector - Year-over-year growth 2023-2028 (%)
- 7.5 Aerospace and defense sector - Market size and forecast 2023-2028
- Chart on Aerospace and defense sector - Market size and forecast 2023-2028 ($ million)
- Data Table on Aerospace and defense sector - Market size and forecast 2023-2028 ($ million)
- Chart on Aerospace and defense sector - Year-over-year growth 2023-2028 (%)
- Data Table on Aerospace and defense sector - Year-over-year growth 2023-2028 (%)
- 7.6 Others - Market size and forecast 2023-2028
- Chart on Others - Market size and forecast 2023-2028 ($ million)
- Data Table on Others - Market size and forecast 2023-2028 ($ million)
- Chart on Others - Year-over-year growth 2023-2028 (%)
- Data Table on Others - Year-over-year growth 2023-2028 (%)
- 7.7 Market opportunity by End-user
- Market opportunity by End-user ($ million)
- Data Table on Market opportunity by End-user ($ million)
8 Customer Landscape
- 8.1 Customer landscape overview
- Analysis of price sensitivity, lifecycle, customer purchase basket, adoption rates, and purchase criteria
9 Geographic Landscape
- 9.1 Geographic segmentation
- Chart on Market share By Geographical Landscape 2023-2028 (%)
- Data Table on Market share By Geographical Landscape 2023-2028 (%)
- 9.2 Geographic comparison
- Chart on Geographic comparison
- Data Table on Geographic comparison
- 9.3 APAC - Market size and forecast 2023-2028
- Chart on APAC - Market size and forecast 2023-2028 ($ million)
- Data Table on APAC - Market size and forecast 2023-2028 ($ million)
- Chart on APAC - Year-over-year growth 2023-2028 (%)
- Data Table on APAC - Year-over-year growth 2023-2028 (%)
- 9.4 Europe - Market size and forecast 2023-2028
- Chart on Europe - Market size and forecast 2023-2028 ($ million)
- Data Table on Europe - Market size and forecast 2023-2028 ($ million)
- Chart on Europe - Year-over-year growth 2023-2028 (%)
- Data Table on Europe - Year-over-year growth 2023-2028 (%)
- 9.5 North America - Market size and forecast 2023-2028
- Chart on North America - Market size and forecast 2023-2028 ($ million)
- Data Table on North America - Market size and forecast 2023-2028 ($ million)
- Chart on North America - Year-over-year growth 2023-2028 (%)
- Data Table on North America - Year-over-year growth 2023-2028 (%)
- 9.6 Middle East and Africa - Market size and forecast 2023-2028
- Chart on Middle East and Africa - Market size and forecast 2023-2028 ($ million)
- Data Table on Middle East and Africa - Market size and forecast 2023-2028 ($ million)
- Chart on Middle East and Africa - Year-over-year growth 2023-2028 (%)
- Data Table on Middle East and Africa - Year-over-year growth 2023-2028 (%)
- 9.7 South America - Market size and forecast 2023-2028
- Chart on South America - Market size and forecast 2023-2028 ($ million)
- Data Table on South America - Market size and forecast 2023-2028 ($ million)
- Chart on South America - Year-over-year growth 2023-2028 (%)
- Data Table on South America - Year-over-year growth 2023-2028 (%)
- 9.8 China - Market size and forecast 2023-2028
- Chart on China - Market size and forecast 2023-2028 ($ million)
- Data Table on China - Market size and forecast 2023-2028 ($ million)
- Chart on China - Year-over-year growth 2023-2028 (%)
- Data Table on China - Year-over-year growth 2023-2028 (%)
- 9.9 US - Market size and forecast 2023-2028
- Chart on US - Market size and forecast 2023-2028 ($ million)
- Data Table on US - Market size and forecast 2023-2028 ($ million)
- Chart on US - Year-over-year growth 2023-2028 (%)
- Data Table on US - Year-over-year growth 2023-2028 (%)
- 9.10 Germany - Market size and forecast 2023-2028
- Chart on Germany - Market size and forecast 2023-2028 ($ million)
- Data Table on Germany - Market size and forecast 2023-2028 ($ million)
- Chart on Germany - Year-over-year growth 2023-2028 (%)
- Data Table on Germany - Year-over-year growth 2023-2028 (%)
- 9.11 Japan - Market size and forecast 2023-2028
- Chart on Japan - Market size and forecast 2023-2028 ($ million)
- Data Table on Japan - Market size and forecast 2023-2028 ($ million)
- Chart on Japan - Year-over-year growth 2023-2028 (%)
- Data Table on Japan - Year-over-year growth 2023-2028 (%)
- 9.12 France - Market size and forecast 2023-2028
- Chart on France - Market size and forecast 2023-2028 ($ million)
- Data Table on France - Market size and forecast 2023-2028 ($ million)
- Chart on France - Year-over-year growth 2023-2028 (%)
- Data Table on France - Year-over-year growth 2023-2028 (%)
- 9.13 Market opportunity By Geographical Landscape
- Market opportunity By Geographical Landscape ($ million)
- Data Tables on Market opportunity By Geographical Landscape ($ million)
10 Drivers, Challenges, and Opportunity/Restraints
- 10.1 Market drivers
- 10.2 Market challenges
- 10.3 Impact of drivers and challenges
- Impact of drivers and challenges in 2023 and 2028
- 10.4 Market opportunities/restraints
11 Competitive Landscape
- 11.1 Overview
- 11.2 Competitive Landscape
- Overview on criticality of inputs and factors of differentiation
- 11.3 Landscape disruption
- Overview on factors of disruption
- 11.4 Industry risks
- Impact of key risks on business
12 Competitive Analysis
- 12.1 Companies profiled
- Companies covered
- 12.2 Market positioning of companies
- Matrix on companies position and classification
- 3M Co.
- 3M Co. - Overview
- 3M Co. - Business segments
- 3M Co. - Key news
- 3M Co. - Key offerings
- 3M Co. - Segment focus
- 12.4 ABB Ltd.
- ABB Ltd. - Overview
- ABB Ltd. - Business segments
- ABB Ltd. - Key news
- ABB Ltd. - Key offerings
- ABB Ltd. - Segment focus
- 12.5 Acme Manufacturing
- Acme Manufacturing - Overview
- Acme Manufacturing - Product / Service
- Acme Manufacturing - Key offerings
- 12.6 Danbach Robot Jiangxi Inc.
- Danbach Robot Jiangxi Inc. - Overview
- Danbach Robot Jiangxi Inc. - Product / Service
- Danbach Robot Jiangxi Inc. - Key offerings
- 12.7 FANUC Corp.
- FANUC Corp. - Overview
- FANUC Corp. - Product / Service
- FANUC Corp. - Key news
- FANUC Corp. - Key offerings
- 12.8 Heinz Berger Maschinenfabrik GmbH and Co. KG
- Heinz Berger Maschinenfabrik GmbH and Co. KG - Overview
- Heinz Berger Maschinenfabrik GmbH and Co. KG - Product / Service
- Heinz Berger Maschinenfabrik GmbH and Co. KG - Key offerings
- 12.9 Kawasaki Heavy Industries Ltd.
- Kawasaki Heavy Industries Ltd. - Overview
- Kawasaki Heavy Industries Ltd. - Business segments
- Kawasaki Heavy Industries Ltd. - Key news
- Kawasaki Heavy Industries Ltd. - Key offerings
- Kawasaki Heavy Industries Ltd. - Segment focus
- 12.10 MESH Automation Inc.
- MESH Automation Inc. - Overview
- MESH Automation Inc. - Product / Service
- MESH Automation Inc. - Key offerings
- 12.11 MIDEA Group Co. Ltd.
- MIDEA Group Co. Ltd. - Overview
- MIDEA Group Co. Ltd. - Product / Service
- MIDEA Group Co. Ltd. - Key news
- MIDEA Group Co. Ltd. - Key offerings
- 12.12 Mitsubishi Electric Corp.
- Mitsubishi Electric Corp. - Overview
- Mitsubishi Electric Corp. - Business segments
- Mitsubishi Electric Corp. - Key news
- Mitsubishi Electric Corp. - Key offerings
- Mitsubishi Electric Corp. - Segment focus
- 12.13 NACHI FUJIKOSHI Corp.
- NACHI FUJIKOSHI Corp. - Overview
- NACHI FUJIKOSHI Corp. - Business segments
- NACHI FUJIKOSHI Corp. - Key news
- NACHI FUJIKOSHI Corp. - Key offerings
- NACHI FUJIKOSHI Corp. - Segment focus
- 12.14 PushCorp Inc.
- PushCorp Inc. - Overview
- PushCorp Inc. - Product / Service
- PushCorp Inc. - Key offerings
- 12.15 Seiko Epson Corp.
- Seiko Epson Corp. - Overview
- Seiko Epson Corp. - Business segments
- Seiko Epson Corp. - Key news
- Seiko Epson Corp. - Key offerings
- Seiko Epson Corp. - Segment focus
- 12.16 Teqram BV
- Teqram BV - Overview
- Teqram BV - Product / Service
- Teqram BV - Key offerings
- 12.17 Yaskawa Electric Corp.
- Yaskawa Electric Corp. - Overview
- Yaskawa Electric Corp. - Business segments
- Yaskawa Electric Corp. - Key news
- Yaskawa Electric Corp. - Key offerings
- Yaskawa Electric Corp. - Segment focus
13 Appendix
- 13.1 Scope of the report
- 13.2 Inclusions and exclusions checklist
- Inclusions checklist
- Exclusions checklist
- 13.3 Currency conversion rates for US$
- Currency conversion rates for US$
- 13.4 Research methodology
- Research methodology
- 13.5 Data procurement
- Information sources
- 13.6 Data validation
- Data validation
- 13.7 Validation techniques employed for market sizing
- Validation techniques employed for market sizing
- 13.8 Data synthesis
- Data synthesis
- 360 degree market analysis
- 360 degree market analysis
- 13.10 List of abbreviations
- List of abbreviations

