|
|
市場調査レポート
商品コード
1757092
グラブリジン(CAS 59870-68-7)の世界市場 2025年~2029年Global Glabridin (CAS 59870-68-7) Market 2025-2029 |
||||||

|
|||||||
カスタマイズ可能
|
|||||||


| グラブリジン(CAS 59870-68-7)の世界市場 2025年~2029年 |
|
出版日: 2025年06月14日
発行: TechNavio
ページ情報: 英文 230 Pages
納期: 即納可能
|

全表示
- 概要
- 図表
- 目次
グラブリジン(CAS 59870-68-7)市場は2024年~2029年に83億4,330万米ドル、予測期間中のCAGRは5.4%で成長すると予測されます。
当レポートでは、グラブリジン(CAS 59870-68-7)市場の全体的な分析、市場規模・予測、動向、成長促進要因、課題、約25のベンダーを網羅したベンダー分析などを掲載しています。
現在の市場シナリオ、最新動向と促進要因、市場環境全体に関する最新分析を提供しています。新興国市場における化粧品産業の成長、世界の老人人口の増加、スキンケアや化粧品における天然成分への消費者需要の増加が市場を牽引しています。
| 市場範囲 | |
|---|---|
| 基準年 | 2025 |
| 終了年 | 2029 |
| 予測期間 | 2025-2029 |
| 成長モメンタム | 加速 |
| 前年比 | 5% |
| CAGR | 5.4% |
| 増分額 | 83億4,330万米ドル |
本調査は、業界の主要参加者からのインプットを含め、一次情報と二次情報を客観的に組み合わせて実施しました。レポートには、主要企業の分析に加え、包括的な市場規模データ、地域別分析によるセグメント、ベンダー情勢が含まれています。レポートには履歴データと予測データがあります。
本調査では、グラブリジンの精製に高度な分離方法が使用されるようになってきていることが、今後数年間のグラブリジン(CAS 59870-68-7)市場の成長を促進する主要な理由の一つであると指摘しています。また、糖尿病治療におけるグラブリジンの潜在的な用途に関する調査や、オンラインプラットフォームによるグラブリジンの購入が増加していることも、市場の大きな需要につながると考えられます。
目次
第1章 エグゼクティブサマリー
- 市場概要
第2章 Technavio分析
- 価格・ライフサイクル・顧客購入バスケット・採用率・購入基準の分析
- インプットの重要性と差別化の要因
- 混乱の要因
- 促進要因と課題の影響
第3章 市場情勢
- 市場エコシステム
- 市場の特徴
- バリューチェーン分析
第4章 市場規模
- 市場の定義
- 市場セグメント分析
- 市場規模 2024
- 市場の見通し 2024年~2029年
第5章 市場規模実績
- グラブリジン(CAS 59870-68-7)の世界市場 2019年~2023年
- タイプ別セグメント分析 2019年~2023年
- 用途別セグメント分析 2019年~2023年
- 製品タイプ別セグメント分析 2019年~2023年
- 地域別セグメント分析 2019年~2023年
- 国別セグメント分析 2019年~2023年
第6章 定性分析
- AIの影響:グラブリジン(CAS 59870-68-7)の世界市場
第7章 ファイブフォース分析
- ファイブフォースの要約
- 買い手の交渉力
- 供給企業の交渉力
- 新規参入業者の脅威
- 代替品の脅威
- 競争の脅威
- 市況
第8章 市場セグメンテーション:タイプ別
- 市場セグメント
- 比較:タイプ別
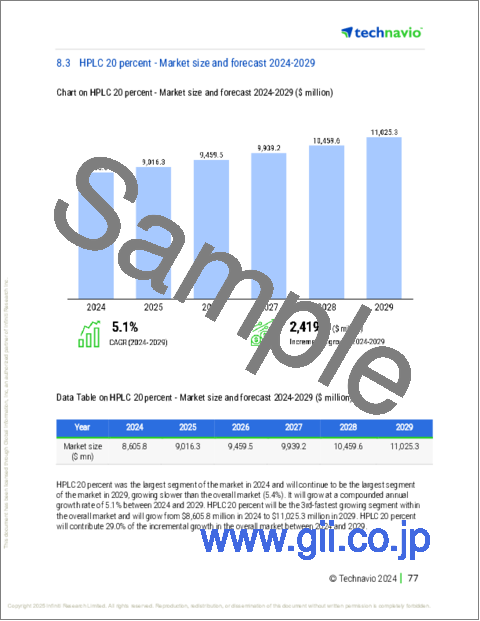
- HPLC 20パーセント:市場規模と予測 2024年~2029年
- HPLC 40パーセント:市場規模と予測 2024年~2029年
- HPLC 60パーセント:市場規模と予測 2024年~2029年
- HPLC 90パーセント:市場規模と予測 2024年~2029年
- HPLC 98パーセント:市場規模と予測 2024年~2029年
- 市場機会:タイプ別
第9章 市場セグメンテーション:用途別
- 市場セグメント
- 比較:用途別
- 化粧品:市場規模と予測 2024年~2029年
- 医薬品:市場規模と予測 2024年~2029年
- 市場機会:用途別
第10章 市場セグメンテーション:製品タイプ別
- 市場セグメント
- 比較:製品タイプ別
- 粉末:市場規模と予測 2024年~2029年
- 液体:市場規模と予測 2024年~2029年
- カプセル:市場規模と予測 2024年~2029年
- その他:市場規模と予測 2024年~2029年
- 市場機会:製品タイプ別
第11章 顧客情勢
- 顧客情勢の概要
第12章 地域別情勢
- 地域別セグメンテーション
- 地域別比較
- アジア太平洋:市場規模と予測 2024年~2029年
- 北米:市場規模と予測 2024年~2029年
- 欧州:市場規模と予測 2024年~2029年
- 南米:市場規模と予測 2024年~2029年
- 中東・アフリカ:市場規模と予測 2024年~2029年
- 米国:市場規模と予測 2024年~2029年
- 中国:市場規模と予測 2024年~2029年
- カナダ:市場規模と予測 2024年~2029年
- ドイツ:市場規模と予測 2024年~2029年
- インド:市場規模と予測 2024年~2029年
- 日本:市場規模と予測 2024年~2029年
- 英国:市場規模と予測 2024年~2029年
- メキシコ:市場規模と予測 2024年~2029年
- 韓国:市場規模と予測 2024年~2029年
- フランス:市場規模と予測 2024年~2029年
- 市場機会:地域情勢別
第13章 促進要因・課題・機会・抑制要因
- 市場促進要因
- 市場の課題
- 促進要因と課題の影響
- 市場の機会・抑制要因
第14章 競合情勢
- 概要
- 競合情勢
- 混乱の状況
- 業界のリスク
第15章 競合分析
- 企業プロファイル
- 企業ランキング指数
- 企業の市場ポジショニング
- Alchem International Pvt. Ltd.
- Azelis SA
- Cayman Chemical Co
- Foodchem International Corp.
- Glentham Life Sciences Ltd.
- Haihang Industry Co. Ltd.
- Herbal Creations
- Herbo Nutra
- Merck KGaA
- Plamed Green Science Group
- Sabinsa Corp.
- Starchem Enterprises Ltd.
- Suzhou Springchem International Co. Ltd.
- Tianjin YR Chemspec Technology Co. Ltd.
- XI AN KINTAI BIOTECH INC.
第16章 付録
Exhibits:
- Exhibits1: Executive Summary - Chart on Market Overview
- Exhibits2: Executive Summary - Data Table on Market Overview
- Exhibits3: Executive Summary - Chart on Global Market Characteristics
- Exhibits4: Executive Summary - Chart on Market By Geographical Landscape
- Exhibits5: Executive Summary - Chart on Market Segmentation by Type
- Exhibits6: Executive Summary - Chart on Market Segmentation by Application
- Exhibits7: Executive Summary - Chart on Market Segmentation by Product Type
- Exhibits8: Executive Summary - Chart on Incremental Growth
- Exhibits9: Executive Summary - Data Table on Incremental Growth
- Exhibits10: Executive Summary - Chart on Company Market Positioning
- Exhibits11: Analysis of price sensitivity, lifecycle, customer purchase basket, adoption rates, and purchase criteria
- Exhibits12: Overview on criticality of inputs and factors of differentiation
- Exhibits13: Overview on factors of disruption
- Exhibits14: Impact of drivers and challenges in 2024 and 2029
- Exhibits15: Parent Market
- Exhibits16: Data Table on - Parent Market
- Exhibits17: Market characteristics analysis
- Exhibits18: Value chain analysis
- Exhibits19: Offerings of companies included in the market definition
- Exhibits20: Market segments
- Exhibits21: Chart on Global - Market size and forecast 2024-2029 ($ million)
- Exhibits22: Data Table on Global - Market size and forecast 2024-2029 ($ million)
- Exhibits23: Chart on Global Market: Year-over-year growth 2024-2029 (%)
- Exhibits24: Data Table on Global Market: Year-over-year growth 2024-2029 (%)
- Exhibits25: Historic Market Size - Data Table on Global Glabridin (CAS 59870-68-7) Market 2019 - 2023 ($ million)
- Exhibits26: Historic Market Size - Type Segment 2019 - 2023 ($ million)
- Exhibits27: Historic Market Size - Application Segment 2019 - 2023 ($ million)
- Exhibits28: Historic Market Size - Product Type Segment 2019 - 2023 ($ million)
- Exhibits29: Historic Market Size - Geography Segment 2019 - 2023 ($ million)
- Exhibits30: Historic Market Size - Country Segment 2019 - 2023 ($ million)
- Exhibits31: Five forces analysis - Comparison between 2024 and 2029
- Exhibits32: Bargaining power of buyers - Impact of key factors 2024 and 2029
- Exhibits33: Bargaining power of suppliers - Impact of key factors in 2024 and 2029
- Exhibits34: Threat of new entrants - Impact of key factors in 2024 and 2029
- Exhibits35: Threat of substitutes - Impact of key factors in 2024 and 2029
- Exhibits36: Threat of rivalry - Impact of key factors in 2024 and 2029
- Exhibits37: Chart on Market condition - Five forces 2024 and 2029
- Exhibits38: Chart on Type - Market share 2024-2029 (%)
- Exhibits39: Data Table on Type - Market share 2024-2029 (%)
- Exhibits40: Chart on Comparison by Type
- Exhibits41: Data Table on Comparison by Type
- Exhibits42: Chart on HPLC 20 percent - Market size and forecast 2024-2029 ($ million)
- Exhibits43: Data Table on HPLC 20 percent - Market size and forecast 2024-2029 ($ million)
- Exhibits44: Chart on HPLC 20 percent - Year-over-year growth 2024-2029 (%)
- Exhibits45: Data Table on HPLC 20 percent - Year-over-year growth 2024-2029 (%)
- Exhibits46: Chart on HPLC 40 percent - Market size and forecast 2024-2029 ($ million)
- Exhibits47: Data Table on HPLC 40 percent - Market size and forecast 2024-2029 ($ million)
- Exhibits48: Chart on HPLC 40 percent - Year-over-year growth 2024-2029 (%)
- Exhibits49: Data Table on HPLC 40 percent - Year-over-year growth 2024-2029 (%)
- Exhibits50: Chart on HPLC 60 percent - Market size and forecast 2024-2029 ($ million)
- Exhibits51: Data Table on HPLC 60 percent - Market size and forecast 2024-2029 ($ million)
- Exhibits52: Chart on HPLC 60 percent - Year-over-year growth 2024-2029 (%)
- Exhibits53: Data Table on HPLC 60 percent - Year-over-year growth 2024-2029 (%)
- Exhibits54: Chart on HPLC 90 percent - Market size and forecast 2024-2029 ($ million)
- Exhibits55: Data Table on HPLC 90 percent - Market size and forecast 2024-2029 ($ million)
- Exhibits56: Chart on HPLC 90 percent - Year-over-year growth 2024-2029 (%)
- Exhibits57: Data Table on HPLC 90 percent - Year-over-year growth 2024-2029 (%)
- Exhibits58: Chart on HPLC 98 percent - Market size and forecast 2024-2029 ($ million)
- Exhibits59: Data Table on HPLC 98 percent - Market size and forecast 2024-2029 ($ million)
- Exhibits60: Chart on HPLC 98 percent - Year-over-year growth 2024-2029 (%)
- Exhibits61: Data Table on HPLC 98 percent - Year-over-year growth 2024-2029 (%)
- Exhibits62: Market opportunity by Type ($ million)
- Exhibits63: Data Table on Market opportunity by Type ($ million)
- Exhibits64: Chart on Application - Market share 2024-2029 (%)
- Exhibits65: Data Table on Application - Market share 2024-2029 (%)
- Exhibits66: Chart on Comparison by Application
- Exhibits67: Data Table on Comparison by Application
- Exhibits68: Chart on Cosmetics - Market size and forecast 2024-2029 ($ million)
- Exhibits69: Data Table on Cosmetics - Market size and forecast 2024-2029 ($ million)
- Exhibits70: Chart on Cosmetics - Year-over-year growth 2024-2029 (%)
- Exhibits71: Data Table on Cosmetics - Year-over-year growth 2024-2029 (%)
- Exhibits72: Chart on Pharmaceutical - Market size and forecast 2024-2029 ($ million)
- Exhibits73: Data Table on Pharmaceutical - Market size and forecast 2024-2029 ($ million)
- Exhibits74: Chart on Pharmaceutical - Year-over-year growth 2024-2029 (%)
- Exhibits75: Data Table on Pharmaceutical - Year-over-year growth 2024-2029 (%)
- Exhibits76: Market opportunity by Application ($ million)
- Exhibits77: Data Table on Market opportunity by Application ($ million)
- Exhibits78: Chart on Product Type - Market share 2024-2029 (%)
- Exhibits79: Data Table on Product Type - Market share 2024-2029 (%)
- Exhibits80: Chart on Comparison by Product Type
- Exhibits81: Data Table on Comparison by Product Type
- Exhibits82: Chart on Powder - Market size and forecast 2024-2029 ($ million)
- Exhibits83: Data Table on Powder - Market size and forecast 2024-2029 ($ million)
- Exhibits84: Chart on Powder - Year-over-year growth 2024-2029 (%)
- Exhibits85: Data Table on Powder - Year-over-year growth 2024-2029 (%)
- Exhibits86: Chart on Liquid - Market size and forecast 2024-2029 ($ million)
- Exhibits87: Data Table on Liquid - Market size and forecast 2024-2029 ($ million)
- Exhibits88: Chart on Liquid - Year-over-year growth 2024-2029 (%)
- Exhibits89: Data Table on Liquid - Year-over-year growth 2024-2029 (%)
- Exhibits90: Chart on Capsule - Market size and forecast 2024-2029 ($ million)
- Exhibits91: Data Table on Capsule - Market size and forecast 2024-2029 ($ million)
- Exhibits92: Chart on Capsule - Year-over-year growth 2024-2029 (%)
- Exhibits93: Data Table on Capsule - Year-over-year growth 2024-2029 (%)
- Exhibits94: Chart on Others - Market size and forecast 2024-2029 ($ million)
- Exhibits95: Data Table on Others - Market size and forecast 2024-2029 ($ million)
- Exhibits96: Chart on Others - Year-over-year growth 2024-2029 (%)
- Exhibits97: Data Table on Others - Year-over-year growth 2024-2029 (%)
- Exhibits98: Market opportunity by Product Type ($ million)
- Exhibits99: Data Table on Market opportunity by Product Type ($ million)
- Exhibits100: Analysis of price sensitivity, lifecycle, customer purchase basket, adoption rates, and purchase criteria
- Exhibits101: Chart on Market share By Geographical Landscape 2024-2029 (%)
- Exhibits102: Data Table on Market share By Geographical Landscape 2024-2029 (%)
- Exhibits103: Chart on Geographic comparison
- Exhibits104: Data Table on Geographic comparison
- Exhibits105: Chart on APAC - Market size and forecast 2024-2029 ($ million)
- Exhibits106: Data Table on APAC - Market size and forecast 2024-2029 ($ million)
- Exhibits107: Chart on APAC - Year-over-year growth 2024-2029 (%)
- Exhibits108: Data Table on APAC - Year-over-year growth 2024-2029 (%)
- Exhibits109: Chart on North America - Market size and forecast 2024-2029 ($ million)
- Exhibits110: Data Table on North America - Market size and forecast 2024-2029 ($ million)
- Exhibits111: Chart on North America - Year-over-year growth 2024-2029 (%)
- Exhibits112: Data Table on North America - Year-over-year growth 2024-2029 (%)
- Exhibits113: Chart on Europe - Market size and forecast 2024-2029 ($ million)
- Exhibits114: Data Table on Europe - Market size and forecast 2024-2029 ($ million)
- Exhibits115: Chart on Europe - Year-over-year growth 2024-2029 (%)
- Exhibits116: Data Table on Europe - Year-over-year growth 2024-2029 (%)
- Exhibits117: Chart on South America - Market size and forecast 2024-2029 ($ million)
- Exhibits118: Data Table on South America - Market size and forecast 2024-2029 ($ million)
- Exhibits119: Chart on South America - Year-over-year growth 2024-2029 (%)
- Exhibits120: Data Table on South America - Year-over-year growth 2024-2029 (%)
- Exhibits121: Chart on Middle East and Africa - Market size and forecast 2024-2029 ($ million)
- Exhibits122: Data Table on Middle East and Africa - Market size and forecast 2024-2029 ($ million)
- Exhibits123: Chart on Middle East and Africa - Year-over-year growth 2024-2029 (%)
- Exhibits124: Data Table on Middle East and Africa - Year-over-year growth 2024-2029 (%)
- Exhibits125: Chart on US - Market size and forecast 2024-2029 ($ million)
- Exhibits126: Data Table on US - Market size and forecast 2024-2029 ($ million)
- Exhibits127: Chart on US - Year-over-year growth 2024-2029 (%)
- Exhibits128: Data Table on US - Year-over-year growth 2024-2029 (%)
- Exhibits129: Chart on China - Market size and forecast 2024-2029 ($ million)
- Exhibits130: Data Table on China - Market size and forecast 2024-2029 ($ million)
- Exhibits131: Chart on China - Year-over-year growth 2024-2029 (%)
- Exhibits132: Data Table on China - Year-over-year growth 2024-2029 (%)
- Exhibits133: Chart on Canada - Market size and forecast 2024-2029 ($ million)
- Exhibits134: Data Table on Canada - Market size and forecast 2024-2029 ($ million)
- Exhibits135: Chart on Canada - Year-over-year growth 2024-2029 (%)
- Exhibits136: Data Table on Canada - Year-over-year growth 2024-2029 (%)
- Exhibits137: Chart on Germany - Market size and forecast 2024-2029 ($ million)
- Exhibits138: Data Table on Germany - Market size and forecast 2024-2029 ($ million)
- Exhibits139: Chart on Germany - Year-over-year growth 2024-2029 (%)
- Exhibits140: Data Table on Germany - Year-over-year growth 2024-2029 (%)
- Exhibits141: Chart on India - Market size and forecast 2024-2029 ($ million)
- Exhibits142: Data Table on India - Market size and forecast 2024-2029 ($ million)
- Exhibits143: Chart on India - Year-over-year growth 2024-2029 (%)
- Exhibits144: Data Table on India - Year-over-year growth 2024-2029 (%)
- Exhibits145: Chart on Japan - Market size and forecast 2024-2029 ($ million)
- Exhibits146: Data Table on Japan - Market size and forecast 2024-2029 ($ million)
- Exhibits147: Chart on Japan - Year-over-year growth 2024-2029 (%)
- Exhibits148: Data Table on Japan - Year-over-year growth 2024-2029 (%)
- Exhibits149: Chart on UK - Market size and forecast 2024-2029 ($ million)
- Exhibits150: Data Table on UK - Market size and forecast 2024-2029 ($ million)
- Exhibits151: Chart on UK - Year-over-year growth 2024-2029 (%)
- Exhibits152: Data Table on UK - Year-over-year growth 2024-2029 (%)
- Exhibits153: Chart on Mexico - Market size and forecast 2024-2029 ($ million)
- Exhibits154: Data Table on Mexico - Market size and forecast 2024-2029 ($ million)
- Exhibits155: Chart on Mexico - Year-over-year growth 2024-2029 (%)
- Exhibits156: Data Table on Mexico - Year-over-year growth 2024-2029 (%)
- Exhibits157: Chart on South Korea - Market size and forecast 2024-2029 ($ million)
- Exhibits158: Data Table on South Korea - Market size and forecast 2024-2029 ($ million)
- Exhibits159: Chart on South Korea - Year-over-year growth 2024-2029 (%)
- Exhibits160: Data Table on South Korea - Year-over-year growth 2024-2029 (%)
- Exhibits161: Chart on France - Market size and forecast 2024-2029 ($ million)
- Exhibits162: Data Table on France - Market size and forecast 2024-2029 ($ million)
- Exhibits163: Chart on France - Year-over-year growth 2024-2029 (%)
- Exhibits164: Data Table on France - Year-over-year growth 2024-2029 (%)
- Exhibits165: Market opportunity By Geographical Landscape ($ million)
- Exhibits166: Data Tables on Market opportunity By Geographical Landscape ($ million)
- Exhibits167: Impact of drivers and challenges in 2024 and 2029
- Exhibits168: Overview on criticality of inputs and factors of differentiation
- Exhibits169: Overview on factors of disruption
- Exhibits170: Impact of key risks on business
- Exhibits171: Companies covered
- Exhibits172: Company ranking index
- Exhibits173: Matrix on companies position and classification
- Exhibits174: Alchem International Pvt. Ltd. - Overview
- Exhibits175: Alchem International Pvt. Ltd. - Product / Service
- Exhibits176: Alchem International Pvt. Ltd. - Key offerings
- Exhibits177: SWOT
- Exhibits178: Azelis SA - Overview
- Exhibits179: Azelis SA - Business segments
- Exhibits180: Azelis SA - Key offerings
- Exhibits181: Azelis SA - Segment focus
- Exhibits182: SWOT
- Exhibits183: Cayman Chemical Co - Overview
- Exhibits184: Cayman Chemical Co - Product / Service
- Exhibits185: Cayman Chemical Co - Key offerings
- Exhibits186: SWOT
- Exhibits187: Foodchem International Corp. - Overview
- Exhibits188: Foodchem International Corp. - Product / Service
- Exhibits189: Foodchem International Corp. - Key offerings
- Exhibits190: SWOT
- Exhibits191: Glentham Life Sciences Ltd. - Overview
- Exhibits192: Glentham Life Sciences Ltd. - Product / Service
- Exhibits193: Glentham Life Sciences Ltd. - Key offerings
- Exhibits194: SWOT
- Exhibits195: Haihang Industry Co. Ltd. - Overview
- Exhibits196: Haihang Industry Co. Ltd. - Product / Service
- Exhibits197: Haihang Industry Co. Ltd. - Key offerings
- Exhibits198: SWOT
- Exhibits199: Herbal Creations - Overview
- Exhibits200: Herbal Creations - Product / Service
- Exhibits201: Herbal Creations - Key offerings
- Exhibits202: SWOT
- Exhibits203: Herbo Nutra - Overview
- Exhibits204: Herbo Nutra - Product / Service
- Exhibits205: Herbo Nutra - Key offerings
- Exhibits206: SWOT
- Exhibits207: Merck KGaA - Overview
- Exhibits208: Merck KGaA - Business segments
- Exhibits209: Merck KGaA - Key news
- Exhibits210: Merck KGaA - Key offerings
- Exhibits211: Merck KGaA - Segment focus
- Exhibits212: SWOT
- Exhibits213: Plamed Green Science Group - Overview
- Exhibits214: Plamed Green Science Group - Product / Service
- Exhibits215: Plamed Green Science Group - Key offerings
- Exhibits216: SWOT
- Exhibits217: Sabinsa Corp. - Overview
- Exhibits218: Sabinsa Corp. - Product / Service
- Exhibits219: Sabinsa Corp. - Key offerings
- Exhibits220: SWOT
- Exhibits221: Starchem Enterprises Ltd. - Overview
- Exhibits222: Starchem Enterprises Ltd. - Product / Service
- Exhibits223: Starchem Enterprises Ltd. - Key offerings
- Exhibits224: SWOT
- Exhibits225: Suzhou Springchem International Co. Ltd. - Overview
- Exhibits226: Suzhou Springchem International Co. Ltd. - Product / Service
- Exhibits227: Suzhou Springchem International Co. Ltd. - Key offerings
- Exhibits228: SWOT
- Exhibits229: Tianjin YR Chemspec Technology Co. Ltd. - Overview
- Exhibits230: Tianjin YR Chemspec Technology Co. Ltd. - Product / Service
- Exhibits231: Tianjin YR Chemspec Technology Co. Ltd. - Key offerings
- Exhibits232: SWOT
- Exhibits233: XI AN KINTAI BIOTECH INC. - Overview
- Exhibits234: XI AN KINTAI BIOTECH INC. - Product / Service
- Exhibits235: XI AN KINTAI BIOTECH INC. - Key offerings
- Exhibits236: SWOT
- Exhibits237: Inclusions checklist
- Exhibits238: Exclusions checklist
- Exhibits239: Currency conversion rates for US$
- Exhibits240: Research methodology
- Exhibits241: Information sources
- Exhibits242: Data validation
- Exhibits243: Validation techniques employed for market sizing
- Exhibits244: Data synthesis
- Exhibits245: 360 degree market analysis
- Exhibits246: List of abbreviations
The glabridin (CAS 59870-68-7) market is forecasted to grow by USD 8,343.3 mn during 2024-2029, accelerating at a CAGR of 5.4% during the forecast period. The report on the glabridin (CAS 59870-68-7) market provides a holistic analysis, market size and forecast, trends, growth drivers, and challenges, as well as vendor analysis covering around 25 vendors.
The report offers an up-to-date analysis regarding the current market scenario, the latest trends and drivers, and the overall market environment. The market is driven by growing cosmetics industry in developing countries, growing geriatric population globally, and increasing consumer demand for natural ingredients in skincare and cosmetic products.
| Market Scope | |
|---|---|
| Base Year | 2025 |
| End Year | 2029 |
| Series Year | 2025-2029 |
| Growth Momentum | Accelerate |
| YOY 2025 | 5% |
| CAGR | 5.4% |
| Incremental Value | $8,343.3 mn |
The study was conducted using an objective combination of primary and secondary information including inputs from key participants in the industry. The report contains a comprehensive market size data, segment with regional analysis and vendor landscape in addition to an analysis of the key companies. Reports have historic and forecast data.
Technavio's glabridin (CAS 59870-68-7) market is segmented as below:
By Type
- HPLC 20 percent
- HPLC 40 percent
- HPLC 60 percent
- HPLC 90 percent
- HPLC 98 percent
By Application
- Cosmetics
- Pharmaceutical
By Product Type
- Powder
- Liquid
- Capsule
- Others
By Geographical Landscape
- APAC
- North America
- Europe
- South America
- Middle East and Africa
This study identifies the growing use of advanced separation methods for glabridin purification as one of the prime reasons driving the glabridin (CAS 59870-68-7) market growth during the next few years. Also, growing research related to potential uses of glabridin in diabetes treatment and growing purchase of glabridin through online platforms will lead to sizable demand in the market.
The report on the glabridin (CAS 59870-68-7) market covers the following areas:
- Glabridin (CAS 59870-68-7) Market sizing
- Glabridin (CAS 59870-68-7) Market forecast
- Glabridin (CAS 59870-68-7) Market industry analysis
The robust vendor analysis is designed to help clients improve their market position, and in line with this, this report provides a detailed analysis of several leading glabridin (CAS 59870-68-7) market vendors that include Alchem International Pvt. Ltd., Arkure Health Care, Azelis SA, Cayman Chemical Co, Foodchem International Corp., Glentham Life Sciences Ltd., Haihang Industry Co. Ltd., Herbal Creations, Herbo Nutra, Kan Phytochemicals Pvt. Ltd., KAVYA PHARMA, M.C.Biotec Inc., Merck KGaA, Plamed Green Science Group, Sabinsa Corp., Starchem Enterprises Ltd., Suzhou Springchem International Co. Ltd., Tianjin YR Chemspec Technology Co. Ltd., XI AN KINTAI BIOTECH INC., and Xi an Sost Biotech Co. Ltd.. Also, the glabridin (CAS 59870-68-7) market analysis report includes information on upcoming trends and challenges that will influence market growth. This is to help companies strategize and leverage all forthcoming growth opportunities.
The publisher presents a detailed picture of the market by the way of study, synthesis, and summation of data from multiple sources by an analysis of key parameters such as profit, pricing, competition, and promotions. It presents various market facets by identifying the key industry influencers. The data presented is comprehensive, reliable, and a result of extensive primary and secondary research. The market research reports provide a complete competitive landscape and an in-depth vendor selection methodology and analysis using qualitative and quantitative research to forecast accurate market growth.
Table of Contents
1 Executive Summary
- 1.1 Market overview
- Executive Summary - Chart on Market Overview
- Executive Summary - Data Table on Market Overview
- Executive Summary - Chart on Global Market Characteristics
- Executive Summary - Chart on Market By Geographical Landscape
- Executive Summary - Chart on Market Segmentation by Type
- Executive Summary - Chart on Market Segmentation by Application
- Executive Summary - Chart on Market Segmentation by Product Type
- Executive Summary - Chart on Incremental Growth
- Executive Summary - Data Table on Incremental Growth
- Executive Summary - Chart on Company Market Positioning
2 Technavio Analysis
- 2.1 Analysis of price sensitivity, lifecycle, customer purchase basket, adoption rates, and purchase criteria
- Analysis of price sensitivity, lifecycle, customer purchase basket, adoption rates, and purchase criteria
- 2.2 Criticality of inputs and Factors of differentiation
- Overview on criticality of inputs and factors of differentiation
- 2.3 Factors of disruption
- Overview on factors of disruption
- 2.4 Impact of drivers and challenges
- Impact of drivers and challenges in 2024 and 2029
3 Market Landscape
- 3.1 Market ecosystem
- Parent Market
- Data Table on - Parent Market
- 3.2 Market characteristics
- Market characteristics analysis
- 3.3 Value chain analysis
- Value chain analysis
4 Market Sizing
- 4.1 Market definition
- Offerings of companies included in the market definition
- 4.2 Market segment analysis
- Market segments
- 4.3 Market size 2024
- 4.4 Market outlook: Forecast for 2024-2029
- Chart on Global - Market size and forecast 2024-2029 ($ million)
- Data Table on Global - Market size and forecast 2024-2029 ($ million)
- Chart on Global Market: Year-over-year growth 2024-2029 (%)
- Data Table on Global Market: Year-over-year growth 2024-2029 (%)
5 Historic Market Size
- 5.1 Global Glabridin (CAS 59870-68-7) Market 2019 - 2023
- Historic Market Size - Data Table on Global Glabridin (CAS 59870-68-7) Market 2019 - 2023 ($ million)
- 5.2 Type segment analysis 2019 - 2023
- Historic Market Size - Type Segment 2019 - 2023 ($ million)
- 5.3 Application segment analysis 2019 - 2023
- Historic Market Size - Application Segment 2019 - 2023 ($ million)
- 5.4 Product Type segment analysis 2019 - 2023
- Historic Market Size - Product Type Segment 2019 - 2023 ($ million)
- 5.5 Geography segment analysis 2019 - 2023
- Historic Market Size - Geography Segment 2019 - 2023 ($ million)
- 5.6 Country segment analysis 2019 - 2023
- Historic Market Size - Country Segment 2019 - 2023 ($ million)
6 Qualitative Analysis
- 6.1 The impact of AI in the global glabridin (CAS 59870-68-7) market
7 Five Forces Analysis
- 7.1 Five forces summary
- Five forces analysis - Comparison between 2024 and 2029
- 7.2 Bargaining power of buyers
- Bargaining power of buyers - Impact of key factors 2024 and 2029
- 7.3 Bargaining power of suppliers
- Bargaining power of suppliers - Impact of key factors in 2024 and 2029
- 7.4 Threat of new entrants
- Threat of new entrants - Impact of key factors in 2024 and 2029
- 7.5 Threat of substitutes
- Threat of substitutes - Impact of key factors in 2024 and 2029
- 7.6 Threat of rivalry
- Threat of rivalry - Impact of key factors in 2024 and 2029
- 7.7 Market condition
- Chart on Market condition - Five forces 2024 and 2029
8 Market Segmentation by Type
- 8.1 Market segments
- Chart on Type - Market share 2024-2029 (%)
- Data Table on Type - Market share 2024-2029 (%)
- 8.2 Comparison by Type
- Chart on Comparison by Type
- Data Table on Comparison by Type
- 8.3 HPLC 20 percent - Market size and forecast 2024-2029
- Chart on HPLC 20 percent - Market size and forecast 2024-2029 ($ million)
- Data Table on HPLC 20 percent - Market size and forecast 2024-2029 ($ million)
- Chart on HPLC 20 percent - Year-over-year growth 2024-2029 (%)
- Data Table on HPLC 20 percent - Year-over-year growth 2024-2029 (%)
- 8.4 HPLC 40 percent - Market size and forecast 2024-2029
- Chart on HPLC 40 percent - Market size and forecast 2024-2029 ($ million)
- Data Table on HPLC 40 percent - Market size and forecast 2024-2029 ($ million)
- Chart on HPLC 40 percent - Year-over-year growth 2024-2029 (%)
- Data Table on HPLC 40 percent - Year-over-year growth 2024-2029 (%)
- 8.5 HPLC 60 percent - Market size and forecast 2024-2029
- Chart on HPLC 60 percent - Market size and forecast 2024-2029 ($ million)
- Data Table on HPLC 60 percent - Market size and forecast 2024-2029 ($ million)
- Chart on HPLC 60 percent - Year-over-year growth 2024-2029 (%)
- Data Table on HPLC 60 percent - Year-over-year growth 2024-2029 (%)
- 8.6 HPLC 90 percent - Market size and forecast 2024-2029
- Chart on HPLC 90 percent - Market size and forecast 2024-2029 ($ million)
- Data Table on HPLC 90 percent - Market size and forecast 2024-2029 ($ million)
- Chart on HPLC 90 percent - Year-over-year growth 2024-2029 (%)
- Data Table on HPLC 90 percent - Year-over-year growth 2024-2029 (%)
- 8.7 HPLC 98 percent - Market size and forecast 2024-2029
- Chart on HPLC 98 percent - Market size and forecast 2024-2029 ($ million)
- Data Table on HPLC 98 percent - Market size and forecast 2024-2029 ($ million)
- Chart on HPLC 98 percent - Year-over-year growth 2024-2029 (%)
- Data Table on HPLC 98 percent - Year-over-year growth 2024-2029 (%)
- 8.8 Market opportunity by Type
- Market opportunity by Type ($ million)
- Data Table on Market opportunity by Type ($ million)
9 Market Segmentation by Application
- 9.1 Market segments
- Chart on Application - Market share 2024-2029 (%)
- Data Table on Application - Market share 2024-2029 (%)
- 9.2 Comparison by Application
- Chart on Comparison by Application
- Data Table on Comparison by Application
- 9.3 Cosmetics - Market size and forecast 2024-2029
- Chart on Cosmetics - Market size and forecast 2024-2029 ($ million)
- Data Table on Cosmetics - Market size and forecast 2024-2029 ($ million)
- Chart on Cosmetics - Year-over-year growth 2024-2029 (%)
- Data Table on Cosmetics - Year-over-year growth 2024-2029 (%)
- 9.4 Pharmaceutical - Market size and forecast 2024-2029
- Chart on Pharmaceutical - Market size and forecast 2024-2029 ($ million)
- Data Table on Pharmaceutical - Market size and forecast 2024-2029 ($ million)
- Chart on Pharmaceutical - Year-over-year growth 2024-2029 (%)
- Data Table on Pharmaceutical - Year-over-year growth 2024-2029 (%)
- 9.5 Market opportunity by Application
- Market opportunity by Application ($ million)
- Data Table on Market opportunity by Application ($ million)
10 Market Segmentation by Product Type
- 10.1 Market segments
- Chart on Product Type - Market share 2024-2029 (%)
- Data Table on Product Type - Market share 2024-2029 (%)
- 10.2 Comparison by Product Type
- Chart on Comparison by Product Type
- Data Table on Comparison by Product Type
- 10.3 Powder - Market size and forecast 2024-2029
- Chart on Powder - Market size and forecast 2024-2029 ($ million)
- Data Table on Powder - Market size and forecast 2024-2029 ($ million)
- Chart on Powder - Year-over-year growth 2024-2029 (%)
- Data Table on Powder - Year-over-year growth 2024-2029 (%)
- 10.4 Liquid - Market size and forecast 2024-2029
- Chart on Liquid - Market size and forecast 2024-2029 ($ million)
- Data Table on Liquid - Market size and forecast 2024-2029 ($ million)
- Chart on Liquid - Year-over-year growth 2024-2029 (%)
- Data Table on Liquid - Year-over-year growth 2024-2029 (%)
- 10.5 Capsule - Market size and forecast 2024-2029
- Chart on Capsule - Market size and forecast 2024-2029 ($ million)
- Data Table on Capsule - Market size and forecast 2024-2029 ($ million)
- Chart on Capsule - Year-over-year growth 2024-2029 (%)
- Data Table on Capsule - Year-over-year growth 2024-2029 (%)
- 10.6 Others - Market size and forecast 2024-2029
- Chart on Others - Market size and forecast 2024-2029 ($ million)
- Data Table on Others - Market size and forecast 2024-2029 ($ million)
- Chart on Others - Year-over-year growth 2024-2029 (%)
- Data Table on Others - Year-over-year growth 2024-2029 (%)
- 10.7 Market opportunity by Product Type
- Market opportunity by Product Type ($ million)
- Data Table on Market opportunity by Product Type ($ million)
11 Customer Landscape
- 11.1 Customer landscape overview
- Analysis of price sensitivity, lifecycle, customer purchase basket, adoption rates, and purchase criteria
12 Geographic Landscape
- 12.1 Geographic segmentation
- Chart on Market share By Geographical Landscape 2024-2029 (%)
- Data Table on Market share By Geographical Landscape 2024-2029 (%)
- 12.2 Geographic comparison
- Chart on Geographic comparison
- Data Table on Geographic comparison
- 12.3 APAC - Market size and forecast 2024-2029
- Chart on APAC - Market size and forecast 2024-2029 ($ million)
- Data Table on APAC - Market size and forecast 2024-2029 ($ million)
- Chart on APAC - Year-over-year growth 2024-2029 (%)
- Data Table on APAC - Year-over-year growth 2024-2029 (%)
- 12.4 North America - Market size and forecast 2024-2029
- Chart on North America - Market size and forecast 2024-2029 ($ million)
- Data Table on North America - Market size and forecast 2024-2029 ($ million)
- Chart on North America - Year-over-year growth 2024-2029 (%)
- Data Table on North America - Year-over-year growth 2024-2029 (%)
- 12.5 Europe - Market size and forecast 2024-2029
- Chart on Europe - Market size and forecast 2024-2029 ($ million)
- Data Table on Europe - Market size and forecast 2024-2029 ($ million)
- Chart on Europe - Year-over-year growth 2024-2029 (%)
- Data Table on Europe - Year-over-year growth 2024-2029 (%)
- 12.6 South America - Market size and forecast 2024-2029
- Chart on South America - Market size and forecast 2024-2029 ($ million)
- Data Table on South America - Market size and forecast 2024-2029 ($ million)
- Chart on South America - Year-over-year growth 2024-2029 (%)
- Data Table on South America - Year-over-year growth 2024-2029 (%)
- 12.7 Middle East and Africa - Market size and forecast 2024-2029
- Chart on Middle East and Africa - Market size and forecast 2024-2029 ($ million)
- Data Table on Middle East and Africa - Market size and forecast 2024-2029 ($ million)
- Chart on Middle East and Africa - Year-over-year growth 2024-2029 (%)
- Data Table on Middle East and Africa - Year-over-year growth 2024-2029 (%)
- 12.8 US - Market size and forecast 2024-2029
- Chart on US - Market size and forecast 2024-2029 ($ million)
- Data Table on US - Market size and forecast 2024-2029 ($ million)
- Chart on US - Year-over-year growth 2024-2029 (%)
- Data Table on US - Year-over-year growth 2024-2029 (%)
- 12.9 China - Market size and forecast 2024-2029
- Chart on China - Market size and forecast 2024-2029 ($ million)
- Data Table on China - Market size and forecast 2024-2029 ($ million)
- Chart on China - Year-over-year growth 2024-2029 (%)
- Data Table on China - Year-over-year growth 2024-2029 (%)
- 12.10 Canada - Market size and forecast 2024-2029
- Chart on Canada - Market size and forecast 2024-2029 ($ million)
- Data Table on Canada - Market size and forecast 2024-2029 ($ million)
- Chart on Canada - Year-over-year growth 2024-2029 (%)
- Data Table on Canada - Year-over-year growth 2024-2029 (%)
- 12.11 Germany - Market size and forecast 2024-2029
- Chart on Germany - Market size and forecast 2024-2029 ($ million)
- Data Table on Germany - Market size and forecast 2024-2029 ($ million)
- Chart on Germany - Year-over-year growth 2024-2029 (%)
- Data Table on Germany - Year-over-year growth 2024-2029 (%)
- 12.12 India - Market size and forecast 2024-2029
- Chart on India - Market size and forecast 2024-2029 ($ million)
- Data Table on India - Market size and forecast 2024-2029 ($ million)
- Chart on India - Year-over-year growth 2024-2029 (%)
- Data Table on India - Year-over-year growth 2024-2029 (%)
- 12.13 Japan - Market size and forecast 2024-2029
- Chart on Japan - Market size and forecast 2024-2029 ($ million)
- Data Table on Japan - Market size and forecast 2024-2029 ($ million)
- Chart on Japan - Year-over-year growth 2024-2029 (%)
- Data Table on Japan - Year-over-year growth 2024-2029 (%)
- 12.14 UK - Market size and forecast 2024-2029
- Chart on UK - Market size and forecast 2024-2029 ($ million)
- Data Table on UK - Market size and forecast 2024-2029 ($ million)
- Chart on UK - Year-over-year growth 2024-2029 (%)
- Data Table on UK - Year-over-year growth 2024-2029 (%)
- 12.15 Mexico - Market size and forecast 2024-2029
- Chart on Mexico - Market size and forecast 2024-2029 ($ million)
- Data Table on Mexico - Market size and forecast 2024-2029 ($ million)
- Chart on Mexico - Year-over-year growth 2024-2029 (%)
- Data Table on Mexico - Year-over-year growth 2024-2029 (%)
- 12.16 South Korea - Market size and forecast 2024-2029
- Chart on South Korea - Market size and forecast 2024-2029 ($ million)
- Data Table on South Korea - Market size and forecast 2024-2029 ($ million)
- Chart on South Korea - Year-over-year growth 2024-2029 (%)
- Data Table on South Korea - Year-over-year growth 2024-2029 (%)
- 12.17 France - Market size and forecast 2024-2029
- Chart on France - Market size and forecast 2024-2029 ($ million)
- Data Table on France - Market size and forecast 2024-2029 ($ million)
- Chart on France - Year-over-year growth 2024-2029 (%)
- Data Table on France - Year-over-year growth 2024-2029 (%)
- 12.18 Market opportunity By Geographical Landscape
- Market opportunity By Geographical Landscape ($ million)
- Data Tables on Market opportunity By Geographical Landscape ($ million)
13 Drivers, Challenges, and Opportunity/Restraints
- 13.1 Market drivers
- 13.2 Market challenges
- 13.3 Impact of drivers and challenges
- Impact of drivers and challenges in 2024 and 2029
- 13.4 Market opportunities/restraints
14 Competitive Landscape
- 14.1 Overview
- 14.2 Competitive Landscape
- Overview on criticality of inputs and factors of differentiation
- 14.3 Landscape disruption
- Overview on factors of disruption
- 14.4 Industry risks
- Impact of key risks on business
15 Competitive Analysis
- 15.1 Companies profiled
- Companies covered
- 15.2 Company ranking index
- Company ranking index
- 15.3 Market positioning of companies
- Matrix on companies position and classification
- 15.4 Alchem International Pvt. Ltd.
- Alchem International Pvt. Ltd. - Overview
- Alchem International Pvt. Ltd. - Product / Service
- Alchem International Pvt. Ltd. - Key offerings
- SWOT
- 15.5 Azelis SA
- Azelis SA - Overview
- Azelis SA - Business segments
- Azelis SA - Key offerings
- Azelis SA - Segment focus
- SWOT
- 15.6 Cayman Chemical Co
- Cayman Chemical Co - Overview
- Cayman Chemical Co - Product / Service
- Cayman Chemical Co - Key offerings
- SWOT
- 15.7 Foodchem International Corp.
- Foodchem International Corp. - Overview
- Foodchem International Corp. - Product / Service
- Foodchem International Corp. - Key offerings
- SWOT
- 15.8 Glentham Life Sciences Ltd.
- Glentham Life Sciences Ltd. - Overview
- Glentham Life Sciences Ltd. - Product / Service
- Glentham Life Sciences Ltd. - Key offerings
- SWOT
- 15.9 Haihang Industry Co. Ltd.
- Haihang Industry Co. Ltd. - Overview
- Haihang Industry Co. Ltd. - Product / Service
- Haihang Industry Co. Ltd. - Key offerings
- SWOT
- 15.10 Herbal Creations
- Herbal Creations - Overview
- Herbal Creations - Product / Service
- Herbal Creations - Key offerings
- SWOT
- 15.11 Herbo Nutra
- Herbo Nutra - Overview
- Herbo Nutra - Product / Service
- Herbo Nutra - Key offerings
- SWOT
- 15.12 Merck KGaA
- Merck KGaA - Overview
- Merck KGaA - Business segments
- Merck KGaA - Key news
- Merck KGaA - Key offerings
- Merck KGaA - Segment focus
- SWOT
- 15.13 Plamed Green Science Group
- Plamed Green Science Group - Overview
- Plamed Green Science Group - Product / Service
- Plamed Green Science Group - Key offerings
- SWOT
- 15.14 Sabinsa Corp.
- Sabinsa Corp. - Overview
- Sabinsa Corp. - Product / Service
- Sabinsa Corp. - Key offerings
- SWOT
- 15.15 Starchem Enterprises Ltd.
- Starchem Enterprises Ltd. - Overview
- Starchem Enterprises Ltd. - Product / Service
- Starchem Enterprises Ltd. - Key offerings
- SWOT
- 15.16 Suzhou Springchem International Co. Ltd.
- Suzhou Springchem International Co. Ltd. - Overview
- Suzhou Springchem International Co. Ltd. - Product / Service
- Suzhou Springchem International Co. Ltd. - Key offerings
- SWOT
- 15.17 Tianjin YR Chemspec Technology Co. Ltd.
- Tianjin YR Chemspec Technology Co. Ltd. - Overview
- Tianjin YR Chemspec Technology Co. Ltd. - Product / Service
- Tianjin YR Chemspec Technology Co. Ltd. - Key offerings
- SWOT
- 15.18 XI AN KINTAI BIOTECH INC.
- XI AN KINTAI BIOTECH INC. - Overview
- XI AN KINTAI BIOTECH INC. - Product / Service
- XI AN KINTAI BIOTECH INC. - Key offerings
- SWOT
16 Appendix
- 16.1 Scope of the report
- 16.2 Inclusions and exclusions checklist
- Inclusions checklist
- Exclusions checklist
- 16.3 Currency conversion rates for US$
- Currency conversion rates for US$
- 16.4 Research methodology
- Research methodology
- 16.5 Data procurement
- Information sources
- 16.6 Data validation
- Data validation
- 16.7 Validation techniques employed for market sizing
- Validation techniques employed for market sizing
- 16.8 Data synthesis
- Data synthesis
- 16.9 360 degree market analysis
- 360 degree market analysis
- 16.10 List of abbreviations
- List of abbreviations

