|
|
市場調査レポート
商品コード
1915562
世界のWeb 3.0ブロックチェーン市場2025-2029年Global Web 3.0 Blockchain Market 2025-2029 |
||||||
|
|||||||
カスタマイズ可能
|
|||||||

| 世界のWeb 3.0ブロックチェーン市場2025-2029年 |
|
出版日: 2026年01月19日
発行: TechNavio
ページ情報: 英文 301 Pages
納期: 即納可能
|

概要
世界のWeb 3.0ブロックチェーン市場は、2024年から2029年の間に2,110億8,670万米ドルの成長が見込まれており、予測期間中のCAGRは73.6%と予測されています。
本レポートでは、世界のWeb 3.0ブロックチェーン市場に関する包括的な分析、市場規模と予測、動向、成長要因、課題に加え、約25社のベンダー分析を提供しております。
本レポートは、現在の市場状況、最新の動向と促進要因、市場環境全般に関する最新の分析を提供します。市場は、実世界の資産のトークン化の制度化、Web 3.0ブロックチェーン導入に対する政府の支援拡大、エンドユーザー間でのWeb 3.0ブロックチェーンの採用増加によって牽引されています。
本調査は、業界の主要関係者からの情報を含む一次情報と二次情報を客観的に組み合わせて実施されました。本レポートには、主要企業の分析に加え、包括的な市場規模データ、地域別分析を伴うセグメント、ベンダー情勢が含まれています。レポートには過去データと予測データが掲載されています。
| 市場範囲 | |
|---|---|
| 基準年 | 2025年 |
| 対象期間 | 2029年 |
| 予測期間 | 2025-2029 |
| 成長モメンタム | 加速 |
| 前年比 | 57.2% |
| CAGR | 73.6% |
| 増分額 | 2,110億8,670万米ドル |
本調査では、分散型物理インフラネットワークの成長が、今後数年間における世界のWeb 3.0ブロックチェーン市場の成長を牽引する主要な要因の一つであると特定しております。また、クロスチェーン相互運用性ソリューションの進展と、対象市場における買収・提携件数の増加が、市場における相当な需要創出につながると見込まれます。
目次
第1章 エグゼクティブサマリー
第2章 Technavio分析
- 価格・ライフサイクル・顧客購入バスケット・採用率・購入基準の分析
- インプットの重要性と差別化の要因
- 混乱の要因
- 促進要因と課題の影響
第3章 市場情勢
- 市場エコシステム
- 市場の特徴
- バリューチェーン分析
第4章 市場規模
- 市場の定義
- 市場セグメント分析
- 市場規模 2024
- 市場の見通し 2024-2029
第5章 市場規模実績
- 世界のWeb 3.0ブロックチェーン市場 2019-2023
- エンドユーザーセグメント分析 2019-2023
- 用途別セグメント分析 2019-2023
- タイプセグメント分析 2019-2023
- 地域別セグメント分析 2019-2023
- 国別セグメント分析 2019-2023
第6章 定性分析
- AIがもたらす影響世界のWeb 3.0ブロックチェーン市場
第7章 ファイブフォース分析
- ファイブフォースの要約
- 買い手の交渉力
- 供給企業の交渉力
- 新規参入業者の脅威
- 代替品の脅威
- 競争の脅威
- 市況
第8章 市場セグメンテーション:エンドユーザー別
- 比較:エンドユーザー別
- BFSI
- 政府
- ヘルスケア
- その他
- 市場機会:エンドユーザー別
第9章 市場セグメンテーション:用途別
- 比較:用途別
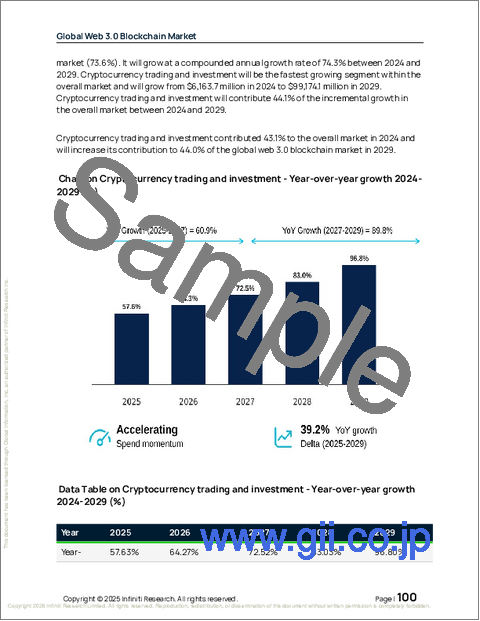
- 仮想通貨取引および投資
- 決済およびスマートコントラクト基盤
- データおよび取引の保存
- 対話型AI
- その他
- 市場機会:用途別
第10章 市場セグメンテーション:タイプ別
- 比較:タイプ別
- 公共
- 民間
- コンソーシアム
- ハイブリッド
- 市場機会:タイプ別
第11章 顧客情勢
第12章 地域別情勢
- 地域別セグメンテーション
- 地域別比較
- 北米
- 米国
- カナダ
- メキシコ
- 欧州
- ドイツ
- 英国
- フランス
- イタリア
- オランダ
- スペイン
- アジア太平洋
- 中国
- 日本
- インド
- 韓国
- オーストラリア
- インドネシア
- 南米
- ブラジル
- アルゼンチン
- コロンビア
- 中東・アフリカ
- サウジアラビア
- アラブ首長国連邦
- 南アフリカ
- イスラエル
- トルコ
- 市場機会:地域別
第13章 促進要因・課題・機会
- 市場促進要因
- 市場の課題
- 促進要因と課題の影響
- 市場機会
第14章 競合情勢
- 概要
- 競合情勢
- 混乱の状況
- 業界のリスク
第15章 競合分析
- 企業プロファイル
- 企業ランキング指標
- 企業の市場ポジショニング
- Alchemy Insights Inc.
- Antier Solutions Pvt. Ltd.
- Binance Holdings Ltd.
- Coinbase Global Inc.
- Crypsense Digital Group
- Guardian Blockchain Labs
- Helium Systems Inc.
- hi Technologies Ltd. UAB
- Intel Corp.
- Kadena LLC
- Messari Inc.
- Ocean Protocol Foundation Ltd.
- Ozone Networks Inc.
- Polygon Labs
- Protocol Labs
