|
|
市場調査レポート
商品コード
1908813
世界のローテベーター市場2026-2030年Global Rotavator Market 2026-2030 |
||||||
|
|||||||
カスタマイズ可能
|
|||||||

| 世界のローテベーター市場2026-2030年 |
|
出版日: 2026年01月14日
発行: TechNavio
ページ情報: 英文 295 Pages
納期: 即納可能
|

概要
世界のローテベーター市場は、2025年から2030年にかけて4億9,140万米ドルの成長が見込まれており、予測期間中のCAGRは4.5%と予測されています。
本報告書では、世界のローテベーター市場に関する包括的な分析、市場規模と予測、動向、成長要因、課題に加え、約25社のベンダー分析を提供しております。
本レポートは、現在の市場状況、最新の動向と促進要因、市場環境全般に関する最新の分析を提供します。市場は、農業分野における養分保護の必要性の高まり、均一な苗床作りの需要増加、認証済みロータベーターへの選好度向上によって牽引されています。
本調査は、業界の主要関係者からの情報をはじめ、一次情報と二次情報を客観的に組み合わせて実施されました。本レポートには、主要企業の分析に加え、包括的な市場規模データ、地域別分析を伴うセグメント、ベンダー情勢が含まれています。レポートには過去データと予測データが掲載されています。
| 市場範囲 | |
|---|---|
| 基準年 | 2026年 |
| 終了年 | 2030年 |
| 予測期間 | 2026-2030 |
| 成長モメンタム | 加速 |
| 前年比2026年 | 4.3% |
| CAGR | 4.5% |
| 増分額 | 4億9,140万米ドル |
本調査では、今後数年間における世界のロータベーター市場成長の主要な要因の一つとして、農業機械化への関心の高まりを挙げております。また、自動化機能を備えたロータベーターの流入や、コスト削減機能を備えたロータベーターへの需要増加が、市場において相当な需要を生み出すものと見込まれます。
目次
第1章 エグゼクティブサマリー
- 市場概要
第2章 Technavio分析
- 価格・ライフサイクル・顧客購入バスケット・採用率・購入基準の分析
- インプットの重要性と差別化の要因
- 混乱の要因
- 促進要因と課題の影響
第3章 市場情勢
- 市場エコシステム
- 市場の特徴
- バリューチェーン分析
第4章 市場規模
- 市場の定義
- 市場セグメント分析
- 市場規模 2025
- 市場の見通し 2025-2030
第5章 市場規模実績
- 世界のローテベーター市場 2020-2024
- 製品セグメント分析 2020-2024
- タイプセグメント分析 2020-2024
- 用途別セグメント分析 2020-2024
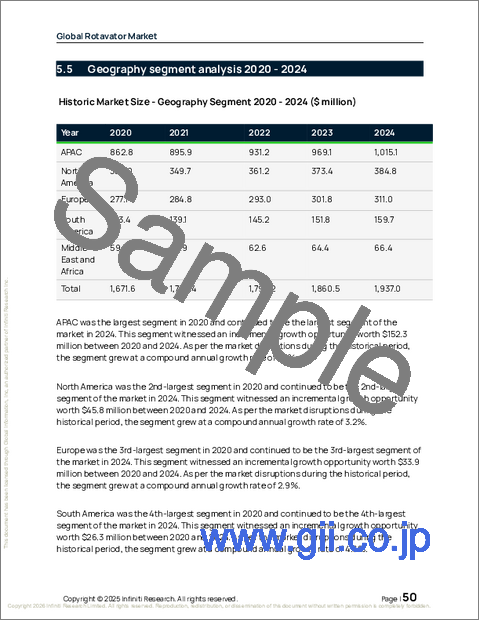
- 地域別セグメント分析 2020-2024
- 国別セグメント分析 2020-2024
第6章 定性分析
- AIの影響:世界のローテベーター市場
第7章 ファイブフォース分析
- ファイブフォースの要約
- 買い手の交渉力
- 供給企業の交渉力
- 新規参入業者の脅威
- 代替品の脅威
- 競争の脅威
- 市況
第8章 市場セグメンテーション:製品別
- 市場セグメント
- 比較:製品別
- 油圧式:市場規模と予測 2025-2030
- 固定:市場規模と予測 2025-2030
- 市場機会:製品別
第9章 市場セグメンテーション:タイプ別
- 市場セグメント
- 比較:タイプ別
- Lタイプ:市場規模と予測 2025-2030
- Cタイプ:市場規模と予測 2025-2030
- 市場機会:タイプ別
第10章 市場セグメンテーション:用途別
- 市場セグメント
- 比較:用途別
- 苗床準備:市場規模と予測 2025-2030
- 土壌改良:市場規模と予測 2025-2030
- 作物残渣管理:市場規模と予測 2025-2030
- 園芸:市場規模と予測 2025-2030
- その他:市場規模と予測 2025-2030
- 市場機会:用途別
第11章 顧客情勢
- 顧客情勢の概要
第12章 地域別情勢
- 地域別セグメンテーション
- 地域別比較
- アジア太平洋:市場規模と予測 2025-2030
- 北米:市場規模と予測 2025-2030
- 欧州:市場規模と予測 2025-2030
- 南米:市場規模と予測 2025-2030
- 中東・アフリカ:市場規模と予測 2025-2030
- 市場機会:地域別
第13章 促進要因、課題、および機会
- 市場促進要因
- 市場の課題
- 促進要因と課題の影響
- 市場機会
第14章 競合情勢
- 概要
- 競合情勢
- 混乱の状況
- 業界のリスク
第15章 競合分析
- 企業プロファイル
- 企業ランキング指数
- 企業の市場ポジショニング
- AGCO Corp.
- Beri Udyog Pvt. Ltd.
- CLAAS KGaA
- CNH Industrial NV
- Deere and Co.
- Kubota Corp.
- KUHN SAS
- Landforce
- Mahindra and Mahindra Ltd.
- Maschio Gaspardo S.p.A.
- Preet Agro Industries Pvt. Ltd.
- Sonalika International Tractors Ltd.
- Tirth Agro Technology Pvt. Ltd.
- Tractors and Farm Equipment Ltd.
- Yanmar Holdings Co. Ltd.

