|
|
市場調査レポート
商品コード
1490734
フィールド機器校正サービスの世界市場(2024年~2028年)Global field devices calibration services market 2024-2028 |
||||||

|
|||||||
カスタマイズ可能
|
|||||||


| フィールド機器校正サービスの世界市場(2024年~2028年) |
|
出版日: 2024年05月20日
発行: TechNavio
ページ情報: 英文 183 Pages
納期: 即納可能
|

全表示
- 概要
- 図表
- 目次
世界のフィールド機器校正サービスの市場規模は、2023年~2028年に6億8,940万米ドル、予測期間中のCAGRは4.77%で成長すると予測されます。 当レポートでは、フィールド機器校正サービス市場の全体的な分析、市場規模・予測、動向、成長促進要因、課題、約25のベンダーを網羅したベンダー分析などを掲載しています。
現在の市場シナリオ、最新動向と促進要因、市場環境全体に関する最新分析を提供しています。市場は、生産収率を最大化するための校正サービスに対する需要の高まり、産業作業におけるエラーの排除に対するニーズの高まり、プロセス安全ガイドラインの遵守の確保が原動力となっています。
| 市場範囲 | |
|---|---|
| 基準年 | 2024年 |
| 終了年 | 2028年 |
| 予測期間 | 2024年~2028年 |
| 成長推進力 | 加速 |
| 前年比2024年 | 4.47% |
| CAGR | 4.77% |
| 増分額 | 6億8,940万米ドル |
本調査では、今後数年間のフィールド機器校正サービス市場成長を促進する主な理由の1つとして、定期校正から予測校正へのシフトを挙げています。また、工場現場での計測と統合された校正ソリューションに対する需要の増加が、市場の大きな需要につながります。
目次
第1章 エグゼクティブサマリー
- 市場概要
第2章 市場情勢
- 市場エコシステム
- 市場の特徴
- バリューチェーン分析
第3章 市場規模の評価
- 市場の定義
- 市場セグメント分析
- 市場規模(2023年)
- 市場の見通し(2023年~2028年)
第4章 市場規模実績
- 世界のフィールド機器校正サービス市場(2018年~2022年)
- タイプセグメント分析(2018年~2022年)
- エンドユーザーセグメント分析(2018年~2022年)
- 地域セグメント分析(2018年~2022年)
- 国セグメント分析(2018年~2022年)
第5章 ファイブフォース分析
- ファイブフォースの要約
- 買い手の交渉力
- 供給企業の交渉力
- 新規参入業者の脅威
- 代替品の脅威
- 競争の脅威
- 市況
第6章 市場セグメンテーション:タイプ別
- 市場セグメンテーション
- 比較:タイプ別
- 温度・湿度校正:市場規模と予測(2023年~2028年)
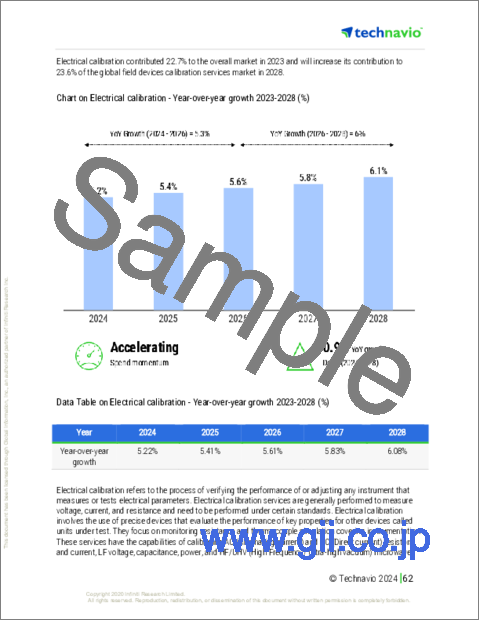
- 電気校正:市場規模と予測(2023年~2028年)
- 圧力校正:市場規模と予測(2023年~2028年)
- 機械校正:市場規模と予測(2023年~2028年)
- 市場機会:タイプ別
第7章 市場セグメンテーション:エンドユーザー別
- 市場セグメンテーション
- 比較:エンドユーザー別
- プロセス産業:市場規模と予測(2023年~2028年)
- ディスクリート産業:市場規模と予測(2023年~2028年)
- 市場機会:エンドユーザー別
第8章 顧客情勢
- 顧客情勢の概要
第9章 地域情勢
- 地域セグメンテーション
- 地域別比較
- 北米:市場規模と予測(2023年~2028年)
- 欧州:市場規模と予測(2023年~2028年)
- アジア太平洋:市場規模と予測(2023年~2028年)
- 南米:市場規模と予測(2023年~2028年)
- 中東・アフリカ:市場規模と予測(2023年~2028年)
- 米国:市場規模と予測(2023年~2028年)
- 中国:市場規模と予測(2023年~2028年)
- ドイツ:市場規模と予測(2023年~2028年)
- フランス:市場規模と予測(2023年~2028年)
- 英国:市場規模と予測(2023年~2028年)
- 市場機会:地域情勢別
第10章 促進要因・課題・機会・抑制要因
- 市場促進要因
- 市場の課題
- 促進要因と課題の影響
- 市場の機会・抑制要因
第11章 競合情勢
- 概要
- 競合情勢
- 混乱の状況
- 業界のリスク
第12章 競合分析
- 企業プロファイル
- 企業の市場ポジショニング
- ABB Ltd.
- Applied Industrial Technologies Inc.
- Branom Instrument Co.
- Danaher Corp.
- Element Materials Technology Group Ltd.
- Endress Hauser Group Services AG
- ENVEA
- Fortive Corp.
- General Electric Co.
- Honeywell International Inc.
- Keysight Technologies Inc.
- PFREUNDT GmbH
- Rockwell Automation Inc.
- Rohde and Schwarz GmbH and Co. KG
- Siemens AG
第13章 付録
Exhibits:
- Exhibits1: Executive Summary - Chart on Market Overview
- Exhibits2: Executive Summary - Data Table on Market Overview
- Exhibits3: Executive Summary - Chart on Global Market Characteristics
- Exhibits4: Executive Summary - Chart on Market By Geographical Landscape
- Exhibits5: Executive Summary - Chart on Market Segmentation by Type
- Exhibits6: Executive Summary - Chart on Market Segmentation by End-user
- Exhibits7: Executive Summary - Chart on Incremental Growth
- Exhibits8: Executive Summary - Data Table on Incremental Growth
- Exhibits9: Executive Summary - Chart on Company Market Positioning
- Exhibits10: Parent Market
- Exhibits11: Data Table on - Parent Market
- Exhibits12: Market characteristics analysis
- Exhibits13: Value Chain Analysis
- Exhibits14: Offerings of companies included in the market definition
- Exhibits15: Market segments
- Exhibits16: Chart on Global - Market size and forecast 2023-2028 ($ million)
- Exhibits17: Data Table on Global - Market size and forecast 2023-2028 ($ million)
- Exhibits18: Chart on Global Market: Year-over-year growth 2023-2028 (%)
- Exhibits19: Data Table on Global Market: Year-over-year growth 2023-2028 (%)
- Exhibits20: Historic Market Size - Data Table on Global Field Devices Calibration Services Market 2018 - 2022 ($ million)
- Exhibits21: Historic Market Size - Type Segment 2018 - 2022 ($ million)
- Exhibits22: Historic Market Size - End-user Segment 2018 - 2022 ($ million)
- Exhibits23: Historic Market Size - Geography Segment 2018 - 2022 ($ million)
- Exhibits24: Historic Market Size - Country Segment 2018 - 2022 ($ million)
- Exhibits25: Five forces analysis - Comparison between 2023 and 2028
- Exhibits26: Bargaining power of buyers - Impact of key factors 2023 and 2028
- Exhibits27: Bargaining power of suppliers - Impact of key factors in 2023 and 2028
- Exhibits28: Threat of new entrants - Impact of key factors in 2023 and 2028
- Exhibits29: Threat of substitutes - Impact of key factors in 2023 and 2028
- Exhibits30: Threat of rivalry - Impact of key factors in 2023 and 2028
- Exhibits31: Chart on Market condition - Five forces 2023 and 2028
- Exhibits32: Chart on Type - Market share 2023-2028 (%)
- Exhibits33: Data Table on Type - Market share 2023-2028 (%)
- Exhibits34: Chart on Comparison by Type
- Exhibits35: Data Table on Comparison by Type
- Exhibits36: Chart on Temperature and humidity calibration - Market size and forecast 2023-2028 ($ million)
- Exhibits37: Data Table on Temperature and humidity calibration - Market size and forecast 2023-2028 ($ million)
- Exhibits38: Chart on Temperature and humidity calibration - Year-over-year growth 2023-2028 (%)
- Exhibits39: Data Table on Temperature and humidity calibration - Year-over-year growth 2023-2028 (%)
- Exhibits40: Chart on Electrical calibration - Market size and forecast 2023-2028 ($ million)
- Exhibits41: Data Table on Electrical calibration - Market size and forecast 2023-2028 ($ million)
- Exhibits42: Chart on Electrical calibration - Year-over-year growth 2023-2028 (%)
- Exhibits43: Data Table on Electrical calibration - Year-over-year growth 2023-2028 (%)
- Exhibits44: Chart on Pressure calibration - Market size and forecast 2023-2028 ($ million)
- Exhibits45: Data Table on Pressure calibration - Market size and forecast 2023-2028 ($ million)
- Exhibits46: Chart on Pressure calibration - Year-over-year growth 2023-2028 (%)
- Exhibits47: Data Table on Pressure calibration - Year-over-year growth 2023-2028 (%)
- Exhibits48: Chart on Mechanical calibration - Market size and forecast 2023-2028 ($ million)
- Exhibits49: Data Table on Mechanical calibration - Market size and forecast 2023-2028 ($ million)
- Exhibits50: Chart on Mechanical calibration - Year-over-year growth 2023-2028 (%)
- Exhibits51: Data Table on Mechanical calibration - Year-over-year growth 2023-2028 (%)
- Exhibits52: Market opportunity by Type ($ million)
- Exhibits53: Data Table on Market opportunity by Type ($ million)
- Exhibits54: Chart on End-user - Market share 2023-2028 (%)
- Exhibits55: Data Table on End-user - Market share 2023-2028 (%)
- Exhibits56: Chart on Comparison by End-user
- Exhibits57: Data Table on Comparison by End-user
- Exhibits58: Chart on Process industries - Market size and forecast 2023-2028 ($ million)
- Exhibits59: Data Table on Process industries - Market size and forecast 2023-2028 ($ million)
- Exhibits60: Chart on Process industries - Year-over-year growth 2023-2028 (%)
- Exhibits61: Data Table on Process industries - Year-over-year growth 2023-2028 (%)
- Exhibits62: Chart on Discrete industries - Market size and forecast 2023-2028 ($ million)
- Exhibits63: Data Table on Discrete industries - Market size and forecast 2023-2028 ($ million)
- Exhibits64: Chart on Discrete industries - Year-over-year growth 2023-2028 (%)
- Exhibits65: Data Table on Discrete industries - Year-over-year growth 2023-2028 (%)
- Exhibits66: Market opportunity by End-user ($ million)
- Exhibits67: Data Table on Market opportunity by End-user ($ million)
- Exhibits68: Analysis of price sensitivity, lifecycle, customer purchase basket, adoption rates, and purchase criteria
- Exhibits69: Chart on Market share By Geographical Landscape 2023-2028 (%)
- Exhibits70: Data Table on Market share By Geographical Landscape 2023-2028 (%)
- Exhibits71: Chart on Geographic comparison
- Exhibits72: Data Table on Geographic comparison
- Exhibits73: Chart on North America - Market size and forecast 2023-2028 ($ million)
- Exhibits74: Data Table on North America - Market size and forecast 2023-2028 ($ million)
- Exhibits75: Chart on North America - Year-over-year growth 2023-2028 (%)
- Exhibits76: Data Table on North America - Year-over-year growth 2023-2028 (%)
- Exhibits77: Chart on Europe - Market size and forecast 2023-2028 ($ million)
- Exhibits78: Data Table on Europe - Market size and forecast 2023-2028 ($ million)
- Exhibits79: Chart on Europe - Year-over-year growth 2023-2028 (%)
- Exhibits80: Data Table on Europe - Year-over-year growth 2023-2028 (%)
- Exhibits81: Chart on APAC - Market size and forecast 2023-2028 ($ million)
- Exhibits82: Data Table on APAC - Market size and forecast 2023-2028 ($ million)
- Exhibits83: Chart on APAC - Year-over-year growth 2023-2028 (%)
- Exhibits84: Data Table on APAC - Year-over-year growth 2023-2028 (%)
- Exhibits85: Chart on South America - Market size and forecast 2023-2028 ($ million)
- Exhibits86: Data Table on South America - Market size and forecast 2023-2028 ($ million)
- Exhibits87: Chart on South America - Year-over-year growth 2023-2028 (%)
- Exhibits88: Data Table on South America - Year-over-year growth 2023-2028 (%)
- Exhibits89: Chart on Middle East and Africa - Market size and forecast 2023-2028 ($ million)
- Exhibits90: Data Table on Middle East and Africa - Market size and forecast 2023-2028 ($ million)
- Exhibits91: Chart on Middle East and Africa - Year-over-year growth 2023-2028 (%)
- Exhibits92: Data Table on Middle East and Africa - Year-over-year growth 2023-2028 (%)
- Exhibits93: Chart on US - Market size and forecast 2023-2028 ($ million)
- Exhibits94: Data Table on US - Market size and forecast 2023-2028 ($ million)
- Exhibits95: Chart on US - Year-over-year growth 2023-2028 (%)
- Exhibits96: Data Table on US - Year-over-year growth 2023-2028 (%)
- Exhibits97: Chart on China - Market size and forecast 2023-2028 ($ million)
- Exhibits98: Data Table on China - Market size and forecast 2023-2028 ($ million)
- Exhibits99: Chart on China - Year-over-year growth 2023-2028 (%)
- Exhibits100: Data Table on China - Year-over-year growth 2023-2028 (%)
- Exhibits101: Chart on Germany - Market size and forecast 2023-2028 ($ million)
- Exhibits102: Data Table on Germany - Market size and forecast 2023-2028 ($ million)
- Exhibits103: Chart on Germany - Year-over-year growth 2023-2028 (%)
- Exhibits104: Data Table on Germany - Year-over-year growth 2023-2028 (%)
- Exhibits105: Chart on France - Market size and forecast 2023-2028 ($ million)
- Exhibits106: Data Table on France - Market size and forecast 2023-2028 ($ million)
- Exhibits107: Chart on France - Year-over-year growth 2023-2028 (%)
- Exhibits108: Data Table on France - Year-over-year growth 2023-2028 (%)
- Exhibits109: Chart on UK - Market size and forecast 2023-2028 ($ million)
- Exhibits110: Data Table on UK - Market size and forecast 2023-2028 ($ million)
- Exhibits111: Chart on UK - Year-over-year growth 2023-2028 (%)
- Exhibits112: Data Table on UK - Year-over-year growth 2023-2028 (%)
- Exhibits113: Market opportunity By Geographical Landscape ($ million)
- Exhibits114: Data Tables on Market opportunity By Geographical Landscape ($ million)
- Exhibits115: Impact of drivers and challenges in 2023 and 2028
- Exhibits116: Overview on criticality of inputs and factors of differentiation
- Exhibits117: Overview on factors of disruption
- Exhibits118: Impact of key risks on business
- Exhibits119: Companies covered
- Exhibits120: Matrix on companies position and classification
- Exhibits121: ABB Ltd. - Overview
- Exhibits122: ABB Ltd. - Business segments
- Exhibits123: ABB Ltd. - Key news
- Exhibits124: ABB Ltd. - Key offerings
- Exhibits125: ABB Ltd. - Segment focus
- Exhibits126: Applied Industrial Technologies Inc. - Overview
- Exhibits127: Applied Industrial Technologies Inc. - Business segments
- Exhibits128: Applied Industrial Technologies Inc. - Key news
- Exhibits129: Applied Industrial Technologies Inc. - Key offerings
- Exhibits130: Applied Industrial Technologies Inc. - Segment focus
- Exhibits131: Branom Instrument Co. - Overview
- Exhibits132: Branom Instrument Co. - Product / Service
- Exhibits133: Branom Instrument Co. - Key offerings
- Exhibits134: Danaher Corp. - Overview
- Exhibits135: Danaher Corp. - Business segments
- Exhibits136: Danaher Corp. - Key news
- Exhibits137: Danaher Corp. - Key offerings
- Exhibits138: Danaher Corp. - Segment focus
- Exhibits139: Element Materials Technology Group Ltd. - Overview
- Exhibits140: Element Materials Technology Group Ltd. - Product / Service
- Exhibits141: Element Materials Technology Group Ltd. - Key offerings
- Exhibits142: Endress Hauser Group Services AG - Overview
- Exhibits143: Endress Hauser Group Services AG - Product / Service
- Exhibits144: Endress Hauser Group Services AG - Key news
- Exhibits145: Endress Hauser Group Services AG - Key offerings
- Exhibits146: ENVEA - Overview
- Exhibits147: ENVEA - Product / Service
- Exhibits148: ENVEA - Key offerings
- Exhibits149: Fortive Corp. - Overview
- Exhibits150: Fortive Corp. - Business segments
- Exhibits151: Fortive Corp. - Key news
- Exhibits152: Fortive Corp. - Key offerings
- Exhibits153: Fortive Corp. - Segment focus
- Exhibits154: General Electric Co. - Overview
- Exhibits155: General Electric Co. - Business segments
- Exhibits156: General Electric Co. - Key news
- Exhibits157: General Electric Co. - Key offerings
- Exhibits158: General Electric Co. - Segment focus
- Exhibits159: Honeywell International Inc. - Overview
- Exhibits160: Honeywell International Inc. - Business segments
- Exhibits161: Honeywell International Inc. - Key news
- Exhibits162: Honeywell International Inc. - Key offerings
- Exhibits163: Honeywell International Inc. - Segment focus
- Exhibits164: Keysight Technologies Inc. - Overview
- Exhibits165: Keysight Technologies Inc. - Business segments
- Exhibits166: Keysight Technologies Inc. - Key news
- Exhibits167: Keysight Technologies Inc. - Key offerings
- Exhibits168: Keysight Technologies Inc. - Segment focus
- Exhibits169: PFREUNDT GmbH - Overview
- Exhibits170: PFREUNDT GmbH - Product / Service
- Exhibits171: PFREUNDT GmbH - Key offerings
- Exhibits172: Rockwell Automation Inc. - Overview
- Exhibits173: Rockwell Automation Inc. - Business segments
- Exhibits174: Rockwell Automation Inc. - Key news
- Exhibits175: Rockwell Automation Inc. - Key offerings
- Exhibits176: Rockwell Automation Inc. - Segment focus
- Exhibits177: Rohde and Schwarz GmbH and Co. KG - Overview
- Exhibits178: Rohde and Schwarz GmbH and Co. KG - Product / Service
- Exhibits179: Rohde and Schwarz GmbH and Co. KG - Key news
- Exhibits180: Rohde and Schwarz GmbH and Co. KG - Key offerings
- Exhibits181: Siemens AG - Overview
- Exhibits182: Siemens AG - Business segments
- Exhibits183: Siemens AG - Key news
- Exhibits184: Siemens AG - Key offerings
- Exhibits185: Siemens AG - Segment focus
- Exhibits186: Inclusions checklist
- Exhibits187: Exclusions checklist
- Exhibits188: Currency conversion rates for US$
- Exhibits189: Research methodology
- Exhibits190: Information sources
- Exhibits191: Data validation
- Exhibits192: Validation techniques employed for market sizing
- Exhibits193: Data synthesis
- Exhibits194: 360 degree market analysis
- Exhibits195: List of abbreviations
The field devices calibration services market is forecasted to grow by USD 689.4 million during 2023-2028, accelerating at a CAGR of 4.77% during the forecast period. The report on the field devices calibration services market provides a holistic analysis, market size and forecast, trends, growth drivers, and challenges, as well as vendor analysis covering around 25 vendors.
The report offers an up-to-date analysis regarding the current market scenario, the latest trends and drivers, and the overall market environment. The market is driven by a growing demand for calibration services to maximize production yield, a growing need for the elimination of errors in industrial operations, and ensuring adherence to process safety guidelines.
Technavio's field devices calibration services market is segmented as below:
| Market Scope | |
|---|---|
| Base Year | 2024 |
| End Year | 2028 |
| Series Year | 2024-2028 |
| Growth Momentum | Accelerate |
| YOY 2024 | 4.47% |
| CAGR | 4.77% |
| Incremental Value | $689.4mn |
By Type
- Temperature and humidity calibration
- Electrical calibration
- Pressure calibration
- Mechanical calibration
By End-user
- Process industries
- Discrete industries
By Geographical Landscape
- North America
- Europe
- APAC
- South America
- Middle East and Africa
This study identifies the shift from periodic to predictive calibration as one of the prime reasons driving the field devices calibration services market growth during the next few years. Also, increasing demand for metrology on the factory floor and integrated calibration solutions will lead to sizable demand in the market.
The report on the field devices calibration services market covers the following areas:
- Field devices calibration services market sizing
- Field devices calibration services market forecast
- Field devices calibration services market industry analysis
The robust vendor analysis is designed to help clients improve their market position, and in line with this, this report provides a detailed analysis of several leading field devices calibration services market vendors that include ABB Ltd., Applied Industrial Technologies Inc., Branom Instrument Co., Danaher Corp., Element Materials Technology Group Ltd., Ellab AS, Endress Hauser Group Services AG, ENVEA, Fortive Corp., General Electric Co., Honeywell International Inc., Keysight Technologies Inc., PFREUNDT GmbH, Rockwell Automation Inc., Rohde and Schwarz GmbH and Co. KG, Siemens AG, Thermo Fisher Scientific Inc., Transcat Inc., Trescal International SAS, and Yokogawa Electric Corp. Also, the field devices calibration services market analysis report includes information on upcoming trends and challenges that will influence market growth. This is to help companies strategize and leverage all forthcoming growth opportunities.
The study was conducted using an objective combination of primary and secondary information including inputs from key participants in the industry. The report contains a comprehensive market and vendor landscape in addition to an analysis of the key vendors.
The publisher presents a detailed picture of the market by way of study, synthesis, and summation of data from multiple sources through an analysis of key parameters such as profit, pricing, competition, and promotions. It presents various market facets by identifying the key industry influencers. The data presented is comprehensive, reliable, and a result of extensive research - both primary and secondary. The market research reports provide a complete competitive landscape and an in-depth vendor selection methodology and analysis using qualitative and quantitative research to forecast accurate market growth.
Table of Contents
1 Executive Summary
- 1.1 Market overview
- Executive Summary - Chart on Market Overview
- Executive Summary - Data Table on Market Overview
- Executive Summary - Chart on Global Market Characteristics
- Executive Summary - Chart on Market By Geographical Landscape
- Executive Summary - Chart on Market Segmentation by Type
- Executive Summary - Chart on Market Segmentation by End-user
- Executive Summary - Chart on Incremental Growth
- Executive Summary - Data Table on Incremental Growth
- Executive Summary - Chart on Company Market Positioning
2 Market Landscape
- 2.1 Market ecosystem
- Parent Market
- Data Table on - Parent Market
- 2.2 Market characteristics
- Market characteristics analysis
- 2.3 Value chain analysis
- Value Chain Analysis
3 Market Sizing
- 3.1 Market definition
- Offerings of companies included in the market definition
- 3.2 Market segment analysis
- Market segments
- 3.3 Market size 2023
- 3.4 Market outlook: Forecast for 2023-2028
- Chart on Global - Market size and forecast 2023-2028 ($ million)
- Data Table on Global - Market size and forecast 2023-2028 ($ million)
- Chart on Global Market: Year-over-year growth 2023-2028 (%)
- Data Table on Global Market: Year-over-year growth 2023-2028 (%)
4 Historic Market Size
- 4.1 Global Field Devices Calibration Services Market 2018 - 2022
- Historic Market Size - Data Table on Global Field Devices Calibration Services Market 2018 - 2022 ($ million)
- 4.2 Type segment analysis 2018 - 2022
- Historic Market Size - Type Segment 2018 - 2022 ($ million)
- 4.3 End-user segment analysis 2018 - 2022
- Historic Market Size - End-user Segment 2018 - 2022 ($ million)
- 4.4 Geography segment analysis 2018 - 2022
- Historic Market Size - Geography Segment 2018 - 2022 ($ million)
- 4.5 Country segment analysis 2018 - 2022
- Historic Market Size - Country Segment 2018 - 2022 ($ million)
5 Five Forces Analysis
- 5.1 Five forces summary
- Five forces analysis - Comparison between 2023 and 2028
- 5.2 Bargaining power of buyers
- Bargaining power of buyers - Impact of key factors 2023 and 2028
- 5.3 Bargaining power of suppliers
- Bargaining power of suppliers - Impact of key factors in 2023 and 2028
- 5.4 Threat of new entrants
- Threat of new entrants - Impact of key factors in 2023 and 2028
- 5.5 Threat of substitutes
- Threat of substitutes - Impact of key factors in 2023 and 2028
- 5.6 Threat of rivalry
- Threat of rivalry - Impact of key factors in 2023 and 2028
- 5.7 Market condition
- Chart on Market condition - Five forces 2023 and 2028
6 Market Segmentation by Type
- 6.1 Market segments
- Chart on Type - Market share 2023-2028 (%)
- Data Table on Type - Market share 2023-2028 (%)
- 6.2 Comparison by Type
- Chart on Comparison by Type
- Data Table on Comparison by Type
- 6.3 Temperature and humidity calibration - Market size and forecast 2023-2028
- Chart on Temperature and humidity calibration - Market size and forecast 2023-2028 ($ million)
- Data Table on Temperature and humidity calibration - Market size and forecast 2023-2028 ($ million)
- Chart on Temperature and humidity calibration - Year-over-year growth 2023-2028 (%)
- Data Table on Temperature and humidity calibration - Year-over-year growth 2023-2028 (%)
- 6.4 Electrical calibration - Market size and forecast 2023-2028
- Chart on Electrical calibration - Market size and forecast 2023-2028 ($ million)
- Data Table on Electrical calibration - Market size and forecast 2023-2028 ($ million)
- Chart on Electrical calibration - Year-over-year growth 2023-2028 (%)
- Data Table on Electrical calibration - Year-over-year growth 2023-2028 (%)
- 6.5 Pressure calibration - Market size and forecast 2023-2028
- Chart on Pressure calibration - Market size and forecast 2023-2028 ($ million)
- Data Table on Pressure calibration - Market size and forecast 2023-2028 ($ million)
- Chart on Pressure calibration - Year-over-year growth 2023-2028 (%)
- Data Table on Pressure calibration - Year-over-year growth 2023-2028 (%)
- 6.6 Mechanical calibration - Market size and forecast 2023-2028
- Chart on Mechanical calibration - Market size and forecast 2023-2028 ($ million)
- Data Table on Mechanical calibration - Market size and forecast 2023-2028 ($ million)
- Chart on Mechanical calibration - Year-over-year growth 2023-2028 (%)
- Data Table on Mechanical calibration - Year-over-year growth 2023-2028 (%)
- 6.7 Market opportunity by Type
- Market opportunity by Type ($ million)
- Data Table on Market opportunity by Type ($ million)
7 Market Segmentation by End-user
- 7.1 Market segments
- Chart on End-user - Market share 2023-2028 (%)
- Data Table on End-user - Market share 2023-2028 (%)
- 7.2 Comparison by End-user
- Chart on Comparison by End-user
- Data Table on Comparison by End-user
- 7.3 Process industries - Market size and forecast 2023-2028
- Chart on Process industries - Market size and forecast 2023-2028 ($ million)
- Data Table on Process industries - Market size and forecast 2023-2028 ($ million)
- Chart on Process industries - Year-over-year growth 2023-2028 (%)
- Data Table on Process industries - Year-over-year growth 2023-2028 (%)
- 7.4 Discrete industries - Market size and forecast 2023-2028
- Chart on Discrete industries - Market size and forecast 2023-2028 ($ million)
- Data Table on Discrete industries - Market size and forecast 2023-2028 ($ million)
- Chart on Discrete industries - Year-over-year growth 2023-2028 (%)
- Data Table on Discrete industries - Year-over-year growth 2023-2028 (%)
- 7.5 Market opportunity by End-user
- Market opportunity by End-user ($ million)
- Data Table on Market opportunity by End-user ($ million)
8 Customer Landscape
- 8.1 Customer landscape overview
- Analysis of price sensitivity, lifecycle, customer purchase basket, adoption rates, and purchase criteria
9 Geographic Landscape
- 9.1 Geographic segmentation
- Chart on Market share By Geographical Landscape 2023-2028 (%)
- Data Table on Market share By Geographical Landscape 2023-2028 (%)
- 9.2 Geographic comparison
- Chart on Geographic comparison
- Data Table on Geographic comparison
- 9.3 North America - Market size and forecast 2023-2028
- Chart on North America - Market size and forecast 2023-2028 ($ million)
- Data Table on North America - Market size and forecast 2023-2028 ($ million)
- Chart on North America - Year-over-year growth 2023-2028 (%)
- Data Table on North America - Year-over-year growth 2023-2028 (%)
- 9.4 Europe - Market size and forecast 2023-2028
- Chart on Europe - Market size and forecast 2023-2028 ($ million)
- Data Table on Europe - Market size and forecast 2023-2028 ($ million)
- Chart on Europe - Year-over-year growth 2023-2028 (%)
- Data Table on Europe - Year-over-year growth 2023-2028 (%)
- 9.5 APAC - Market size and forecast 2023-2028
- Chart on APAC - Market size and forecast 2023-2028 ($ million)
- Data Table on APAC - Market size and forecast 2023-2028 ($ million)
- Chart on APAC - Year-over-year growth 2023-2028 (%)
- Data Table on APAC - Year-over-year growth 2023-2028 (%)
- 9.6 South America - Market size and forecast 2023-2028
- Chart on South America - Market size and forecast 2023-2028 ($ million)
- Data Table on South America - Market size and forecast 2023-2028 ($ million)
- Chart on South America - Year-over-year growth 2023-2028 (%)
- Data Table on South America - Year-over-year growth 2023-2028 (%)
- 9.7 Middle East and Africa - Market size and forecast 2023-2028
- Chart on Middle East and Africa - Market size and forecast 2023-2028 ($ million)
- Data Table on Middle East and Africa - Market size and forecast 2023-2028 ($ million)
- Chart on Middle East and Africa - Year-over-year growth 2023-2028 (%)
- Data Table on Middle East and Africa - Year-over-year growth 2023-2028 (%)
- 9.8 US - Market size and forecast 2023-2028
- Chart on US - Market size and forecast 2023-2028 ($ million)
- Data Table on US - Market size and forecast 2023-2028 ($ million)
- Chart on US - Year-over-year growth 2023-2028 (%)
- Data Table on US - Year-over-year growth 2023-2028 (%)
- 9.9 China - Market size and forecast 2023-2028
- Chart on China - Market size and forecast 2023-2028 ($ million)
- Data Table on China - Market size and forecast 2023-2028 ($ million)
- Chart on China - Year-over-year growth 2023-2028 (%)
- Data Table on China - Year-over-year growth 2023-2028 (%)
- 9.10 Germany - Market size and forecast 2023-2028
- Chart on Germany - Market size and forecast 2023-2028 ($ million)
- Data Table on Germany - Market size and forecast 2023-2028 ($ million)
- Chart on Germany - Year-over-year growth 2023-2028 (%)
- Data Table on Germany - Year-over-year growth 2023-2028 (%)
- 9.11 France - Market size and forecast 2023-2028
- Chart on France - Market size and forecast 2023-2028 ($ million)
- Data Table on France - Market size and forecast 2023-2028 ($ million)
- Chart on France - Year-over-year growth 2023-2028 (%)
- Data Table on France - Year-over-year growth 2023-2028 (%)
- 9.12 UK - Market size and forecast 2023-2028
- Chart on UK - Market size and forecast 2023-2028 ($ million)
- Data Table on UK - Market size and forecast 2023-2028 ($ million)
- Chart on UK - Year-over-year growth 2023-2028 (%)
- Data Table on UK - Year-over-year growth 2023-2028 (%)
- 9.13 Market opportunity By Geographical Landscape
- Market opportunity By Geographical Landscape ($ million)
- Data Tables on Market opportunity By Geographical Landscape ($ million)
10 Drivers, Challenges, and Opportunity/Restraints
- 10.1 Market drivers
- 10.2 Market challenges
- 10.3 Impact of drivers and challenges
- Impact of drivers and challenges in 2023 and 2028
- 10.4 Market opportunities/restraints
11 Competitive Landscape
- 11.1 Overview
- 11.2 Competitive Landscape
- Overview on criticality of inputs and factors of differentiation
- 11.3 Landscape disruption
- Overview on factors of disruption
- 11.4 Industry risks
- Impact of key risks on business
12 Competitive Analysis
- 12.1 Companies profiled
- Companies covered
- 12.2 Market positioning of companies
- Matrix on companies position and classification
- 12.3 ABB Ltd.
- ABB Ltd. - Overview
- ABB Ltd. - Business segments
- ABB Ltd. - Key news
- ABB Ltd. - Key offerings
- ABB Ltd. - Segment focus
- 12.4 Applied Industrial Technologies Inc.
- Applied Industrial Technologies Inc. - Overview
- Applied Industrial Technologies Inc. - Business segments
- Applied Industrial Technologies Inc. - Key news
- Applied Industrial Technologies Inc. - Key offerings
- Applied Industrial Technologies Inc. - Segment focus
- 12.5 Branom Instrument Co.
- Branom Instrument Co. - Overview
- Branom Instrument Co. - Product / Service
- Branom Instrument Co. - Key offerings
- 12.6 Danaher Corp.
- Danaher Corp. - Overview
- Danaher Corp. - Business segments
- Danaher Corp. - Key news
- Danaher Corp. - Key offerings
- Danaher Corp. - Segment focus
- 12.7 Element Materials Technology Group Ltd.
- Element Materials Technology Group Ltd. - Overview
- Element Materials Technology Group Ltd. - Product / Service
- Element Materials Technology Group Ltd. - Key offerings
- 12.8 Endress Hauser Group Services AG
- Endress Hauser Group Services AG - Overview
- Endress Hauser Group Services AG - Product / Service
- Endress Hauser Group Services AG - Key news
- Endress Hauser Group Services AG - Key offerings
- 12.9 ENVEA
- ENVEA - Overview
- ENVEA - Product / Service
- ENVEA - Key offerings
- 12.10 Fortive Corp.
- Fortive Corp. - Overview
- Fortive Corp. - Business segments
- Fortive Corp. - Key news
- Fortive Corp. - Key offerings
- Fortive Corp. - Segment focus
- 12.11 General Electric Co.
- General Electric Co. - Overview
- General Electric Co. - Business segments
- General Electric Co. - Key news
- General Electric Co. - Key offerings
- General Electric Co. - Segment focus
- 12.12 Honeywell International Inc.
- Honeywell International Inc. - Overview
- Honeywell International Inc. - Business segments
- Honeywell International Inc. - Key news
- Honeywell International Inc. - Key offerings
- Honeywell International Inc. - Segment focus
- 12.13 Keysight Technologies Inc.
- Keysight Technologies Inc. - Overview
- Keysight Technologies Inc. - Business segments
- Keysight Technologies Inc. - Key news
- Keysight Technologies Inc. - Key offerings
- Keysight Technologies Inc. - Segment focus
- 12.14 PFREUNDT GmbH
- PFREUNDT GmbH - Overview
- PFREUNDT GmbH - Product / Service
- PFREUNDT GmbH - Key offerings
- 12.15 Rockwell Automation Inc.
- Rockwell Automation Inc. - Overview
- Rockwell Automation Inc. - Business segments
- Rockwell Automation Inc. - Key news
- Rockwell Automation Inc. - Key offerings
- Rockwell Automation Inc. - Segment focus
- 12.16 Rohde and Schwarz GmbH and Co. KG
- Rohde and Schwarz GmbH and Co. KG - Overview
- Rohde and Schwarz GmbH and Co. KG - Product / Service
- Rohde and Schwarz GmbH and Co. KG - Key news
- Rohde and Schwarz GmbH and Co. KG - Key offerings
- 12.17 Siemens AG
- Siemens AG - Overview
- Siemens AG - Business segments
- Siemens AG - Key news
- Siemens AG - Key offerings
- Siemens AG - Segment focus
13 Appendix
- 13.1 Scope of the report
- 13.2 Inclusions and exclusions checklist
- Inclusions checklist
- Exclusions checklist
- 13.3 Currency conversion rates for US$
- Currency conversion rates for US$
- 13.4 Research methodology
- Research methodology
- 13.5 Data procurement
- Information sources
- 13.6 Data validation
- Data validation
- 13.7 Validation techniques employed for market sizing
- Validation techniques employed for market sizing
- 13.8 Data synthesis
- Data synthesis
- 360 degree market analysis
- 360 degree market analysis
- 13.10 List of abbreviations
- List of abbreviations

