|
|
市場調査レポート
商品コード
1915565
世界の心血管情報システム(CVIS)市場2025-2029年Global Cardiovascular Information System (CVIS) Market 2025-2029 |
||||||
|
|||||||
カスタマイズ可能
|
|||||||

| 世界の心血管情報システム(CVIS)市場2025-2029年 |
|
出版日: 2026年01月19日
発行: TechNavio
ページ情報: 英文 281 Pages
納期: 即納可能
|

概要
世界の心血管情報システム(CVIS)市場は、2024年から2029年にかけて9億7,100万米ドルの成長が見込まれ、予測期間中のCAGRは11.6%と予測されています。
本報告書では、世界の心血管情報システム(CVIS)市場に関する包括的な分析、市場規模と予測、動向、成長要因、課題に加え、約25社のベンダー分析を提供しております。
本レポートは、現在の市場状況、最新の動向と促進要因、市場環境全般に関する最新の分析を提供します。心臓疾患の発生率上昇、データ駆動型医療への移行、医療インフラの整備が進んでいることが市場の成長を牽引しています。
本調査は、業界の主要関係者からの情報をはじめとする一次情報と二次情報を客観的に組み合わせて実施されました。本レポートには、主要企業の分析に加え、包括的な市場規模データ、地域別分析を伴うセグメント、ベンダー情勢が含まれています。レポートには過去データと予測データが記載されています。
| 市場範囲 | |
|---|---|
| 基準年 | 2025年 |
| 対象期間 | 2029年 |
| 予測期間 | 2025-2029 |
| 成長モメンタム | 加速 |
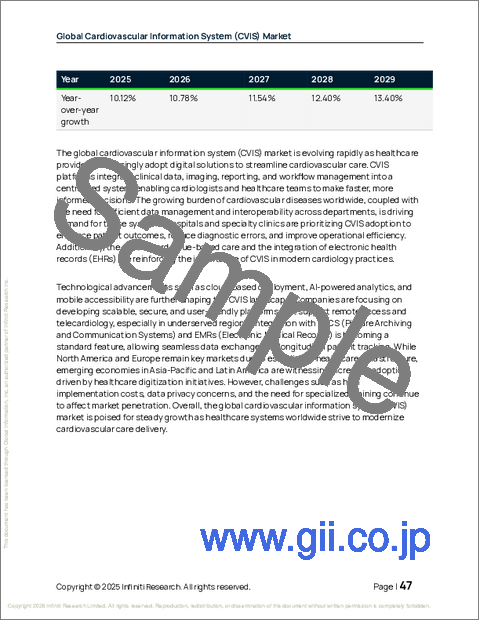
| 前年比 | 10.1% |
| CAGR | 11.6% |
| 増分額 | 9億7,100万米ドル |
本調査では、遠隔患者モニタリング(RPM)の導入拡大が、今後数年間における世界の心血管情報システム(CVIS)市場成長を牽引する主要な要因の一つであると特定しております。また、クラウドベースソリューションの導入拡大と新興市場における医療観光の増加が、市場において相当な需要を生み出すものと見込まれます。
目次
第1章 エグゼクティブサマリー
第2章 Technavio分析
- 価格・ライフサイクル・顧客購入バスケット・採用率・購入基準の分析
- インプットの重要性と差別化の要因
- 混乱の要因
- 促進要因と課題の影響
第3章 市場情勢
- 市場エコシステム
- 市場の特徴
- バリューチェーン分析
第4章 市場規模
- 市場の定義
- 市場セグメント分析
- 市場規模 2024
- 市場の見通し 2024-2029
第5章 市場規模実績
- 世界の心血管情報システム(CVIS)市場 2019-2023
- タイプセグメント分析 2019-2023
- 展開セグメント分析 2019-2023
- 部品セグメント分析 2019-2023
- 地域別セグメント分析 2019-2023
- 国別セグメント分析 2019-2023
第6章 定性分析
- AIの影響:世界の心血管情報システム(CVIS)市場
第7章 ファイブフォース分析
- ファイブフォースの要約
- 買い手の交渉力
- 供給企業の交渉力
- 新規参入業者の脅威
- 代替品の脅威
- 競争の脅威
- 市況
第8章 市場セグメンテーション:タイプ別
- 比較:タイプ別
- CVIS
- C-PACS
- 市場機会:タイプ別
第9章 市場セグメンテーション:展開別
- 比較:展開別
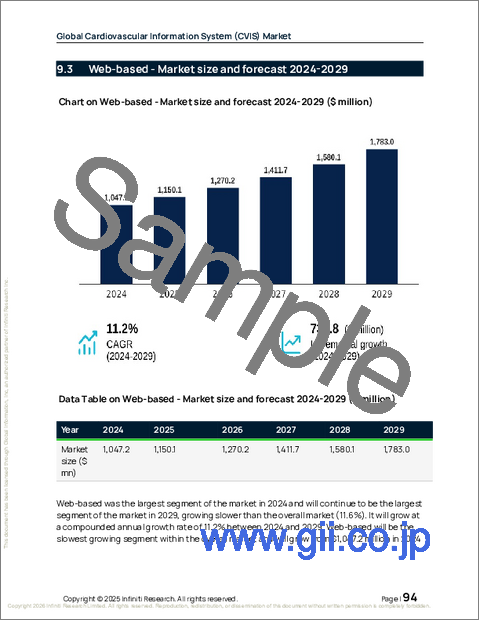
- Webベース
- オンサイト
- 市場機会:展開別
第10章 市場セグメンテーション:コンポーネント別
- 比較:コンポーネント別
- ソフトウェア
- サービス
- 市場機会:コンポーネント別
第11章 顧客情勢
第12章 地域別情勢
- 地域別セグメンテーション
- 地域別比較
- 北米
- 米国
- カナダ
- メキシコ
- 欧州
- ドイツ
- 英国
- フランス
- イタリア
- オランダ
- スペイン
- アジア
- 中国
- 日本
- インド
- 韓国
- インドネシア
- 世界のその他の地域
- ブラジル
- サウジアラビア
- アラブ首長国連邦
- オーストラリア
- 南アフリカ
- アルゼンチン
- イスラエル
- トルコ
- コロンビア
- 市場機会:地域別
第13章 促進要因・課題・機会
- 市場促進要因
- 市場の課題
- 促進要因と課題の影響
- 市場機会
第14章 競合情勢
- 概要
- 競合情勢
- 混乱の状況
- 業界のリスク
第15章 競合分析
- 企業プロファイル
- 企業ランキング指標
- 企業の市場ポジショニング
- Abbott Laboratories
- Agfa Gevaert NV
- Beijing Strong Guanyu Technology Development Co. Ltd.
- Central Data Networks Pty Ltd.
- Esaote Spa
- FUJIFILM Holdings Corp.
- General Electric Co.
- Intelerad Medical Systems Inc.
- Koninklijke Philips NV
- Merative L.P.
- Optum Inc.
- Oracle Corp.
- Shimadzu Corp.
- Siemens AG
- SOFTLINK INTERNATIONAL PVT. LTD.

