|
|
市場調査レポート
商品コード
1515986
ナースコールシステムの世界市場 2024-2028Global nurse call systems market 2024-2028 |
||||||
|
|||||||
カスタマイズ可能
|
|||||||


| ナースコールシステムの世界市場 2024-2028 |
|
出版日: 2024年06月12日
発行: TechNavio
ページ情報: 英文 168 Pages
納期: 即納可能
|

全表示
- 概要
- 図表
- 目次
ナースコールシステム市場は2023-2028年に17億8,630万米ドル、予測期間中のCAGRは13.64%で成長すると予測されます。
当レポートでは、ナースコールシステム市場の全体的な分析、市場規模・予測、動向、成長促進要因、課題、約25のベンダーを網羅したベンダー分析などを掲載しています。
現在の市場シナリオ、最新動向と促進要因、市場環境全体に関する最新分析を提供しています。市場は、老人人口の増加、効率的なヘルスケアコミュニケーションシステムに対する需要の増加、多言語ナースコールシステムに対する旺盛な需要が牽引しています。
| 市場範囲 | |
|---|---|
| 基準年 | 2024 |
| 終了年 | 2028 |
| 予測期間 | 2024-2028 |
| 成長モメンタム | 加速 |
| 前年比2024年 | 11.73% |
| CAGR | 13.64% |
| 増分額 | 17億8,630万米ドル |
本調査では、今後数年間のナースコールシステム市場成長を牽引する主な要因の1つとして、ヘルスケアインフラへの投資の増加を挙げています。また、デジタルヘルスケアに対する需要の増加や新興国における急成長の可能性も、市場の大きな需要につながります。
目次
第1章 エグゼクティブサマリー
- 市場概要
第2章 市場情勢
- 市場エコシステム
- 市場の特徴
- バリューチェーン分析
第3章 市場規模の評価
- 市場の定義
- 市場セグメント分析
- 市場規模 2023
- 市場の見通し 2023-2028
第4章 市場規模実績
- 世界ナースコールシステム市場 2018-2022
- 技術別セグメント分析 2018-2022
- エンドユーザー別セグメント分析 2018-2022
- 地域別セグメント分析 2018-2022
- 国別セグメント分析 2018-2022
第5章 ファイブフォース分析
- ファイブフォースの要約
- 買い手の交渉力
- 供給企業の交渉力
- 新規参入業者の脅威
- 代替品の脅威
- 競争の脅威
- 市況
第6章 市場セグメンテーション:技術別
- 市場セグメンテーション
- 比較:技術別
- 有線システム:市場規模と予測 2023-2028
- ワイヤレスシステム:市場規模と予測 2023-2028
- 市場機会:技術別
第7章 市場セグメンテーション:エンドユーザー別
- 市場セグメンテーション
- 比較:エンドユーザー別
- 病院:市場規模と予測 2023-2028
- ASC/クリニック:市場規模と予測 2023-2028
- 長期介護施設:市場規模と予測 2023-2028
- 市場機会:エンドユーザー別
第8章 顧客情勢
- 顧客情勢の概要
第9章 地域別情勢
- 地域別セグメンテーション
- 地域別比較
- 北米:市場規模と予測 2023-2028
- 欧州:市場規模と予測 2023-2028
- アジア太平洋:市場規模と予測 2023-2028
- 中東・アフリカ:市場規模と予測 2023-2028
- 南米:市場規模と予測 2023-2028
- 米国:市場規模と予測 2023-2028
- 中国:市場規模と予測 2023-2028
- ドイツ:市場規模と予測 2023-2028
- 英国:市場規模と予測 2023-2028
- カナダ:市場規模と予測 2023-2028
- 市場機会:地域情勢別
第10章 促進要因・課題・機会・抑制要因
- 市場促進要因
- 市場の課題
- 促進要因と課題の影響
- 市場の機会・抑制要因
第11章 競合情勢
- 概要
- 競合情勢
- 混乱の状況
- 業界のリスク
第12章 競合分析
- 企業プロファイル
- 企業の市場ポジショニング
- AMETEK Inc.
- Ascom Holding AG
- Austco Healthcare Ltd.
- Baxter International Inc.
- Bec Integrated Solutions LLC
- Carecom Co. Ltd.
- Caretronic d.o.o.
- Cornell Communications
- Essec Group
- Halma Plc
- Johnson Controls International Plc.
- Securitas AG
- TekTone Sound and Signal Mfg. Inc.
- TigerConnect Inc.
- Tunstall Healthcare Group Ltd.
第13章 付録
Exhibits:
- Exhibits1: Executive Summary - Chart on Market Overview
- Exhibits2: Executive Summary - Data Table on Market Overview
- Exhibits3: Executive Summary - Chart on Global Market Characteristics
- Exhibits4: Executive Summary - Chart on Market By Geographical Landscape
- Exhibits5: Executive Summary - Chart on Market Segmentation by Technology
- Exhibits6: Executive Summary - Chart on Market Segmentation by End-user
- Exhibits7: Executive Summary - Chart on Incremental Growth
- Exhibits8: Executive Summary - Data Table on Incremental Growth
- Exhibits9: Executive Summary - Chart on Company Market Positioning
- Exhibits10: Parent Market
- Exhibits11: Data Table on - Parent Market
- Exhibits12: Market characteristics analysis
- Exhibits13: Value Chain Analysis
- Exhibits14: Offerings of companies included in the market definition
- Exhibits15: Market segments
- Exhibits16: Chart on Global - Market size and forecast 2023-2028 ($ million)
- Exhibits17: Data Table on Global - Market size and forecast 2023-2028 ($ million)
- Exhibits18: Chart on Global Market: Year-over-year growth 2023-2028 (%)
- Exhibits19: Data Table on Global Market: Year-over-year growth 2023-2028 (%)
- Exhibits20: Historic Market Size - Data Table on Global Nurse Call Systems Market 2018 - 2022 ($ million)
- Exhibits21: Historic Market Size - Technology Segment 2018 - 2022 ($ million)
- Exhibits22: Historic Market Size - End-user Segment 2018 - 2022 ($ million)
- Exhibits23: Historic Market Size - Geography Segment 2018 - 2022 ($ million)
- Exhibits24: Historic Market Size - Country Segment 2018 - 2022 ($ million)
- Exhibits25: Five forces analysis - Comparison between 2023 and 2028
- Exhibits26: Bargaining power of buyers - Impact of key factors 2023 and 2028
- Exhibits27: Bargaining power of suppliers - Impact of key factors in 2023 and 2028
- Exhibits28: Threat of new entrants - Impact of key factors in 2023 and 2028
- Exhibits29: Threat of substitutes - Impact of key factors in 2023 and 2028
- Exhibits30: Threat of rivalry - Impact of key factors in 2023 and 2028
- Exhibits31: Chart on Market condition - Five forces 2023 and 2028
- Exhibits32: Chart on Technology - Market share 2023-2028 (%)
- Exhibits33: Data Table on Technology - Market share 2023-2028 (%)
- Exhibits34: Chart on Comparison by Technology
- Exhibits35: Data Table on Comparison by Technology
- Exhibits36: Chart on Wired systems - Market size and forecast 2023-2028 ($ million)
- Exhibits37: Data Table on Wired systems - Market size and forecast 2023-2028 ($ million)
- Exhibits38: Chart on Wired systems - Year-over-year growth 2023-2028 (%)
- Exhibits39: Data Table on Wired systems - Year-over-year growth 2023-2028 (%)
- Exhibits40: Chart on Wireless systems - Market size and forecast 2023-2028 ($ million)
- Exhibits41: Data Table on Wireless systems - Market size and forecast 2023-2028 ($ million)
- Exhibits42: Chart on Wireless systems - Year-over-year growth 2023-2028 (%)
- Exhibits43: Data Table on Wireless systems - Year-over-year growth 2023-2028 (%)
- Exhibits44: Market opportunity by Technology ($ million)
- Exhibits45: Data Table on Market opportunity by Technology ($ million)
- Exhibits46: Chart on End-user - Market share 2023-2028 (%)
- Exhibits47: Data Table on End-user - Market share 2023-2028 (%)
- Exhibits48: Chart on Comparison by End-user
- Exhibits49: Data Table on Comparison by End-user
- Exhibits50: Chart on Hospitals - Market size and forecast 2023-2028 ($ million)
- Exhibits51: Data Table on Hospitals - Market size and forecast 2023-2028 ($ million)
- Exhibits52: Chart on Hospitals - Year-over-year growth 2023-2028 (%)
- Exhibits53: Data Table on Hospitals - Year-over-year growth 2023-2028 (%)
- Exhibits54: Chart on ASCs/Clinics - Market size and forecast 2023-2028 ($ million)
- Exhibits55: Data Table on ASCs/Clinics - Market size and forecast 2023-2028 ($ million)
- Exhibits56: Chart on ASCs/Clinics - Year-over-year growth 2023-2028 (%)
- Exhibits57: Data Table on ASCs/Clinics - Year-over-year growth 2023-2028 (%)
- Exhibits58: Chart on Long-term care facilities - Market size and forecast 2023-2028 ($ million)
- Exhibits59: Data Table on Long-term care facilities - Market size and forecast 2023-2028 ($ million)
- Exhibits60: Chart on Long-term care facilities - Year-over-year growth 2023-2028 (%)
- Exhibits61: Data Table on Long-term care facilities - Year-over-year growth 2023-2028 (%)
- Exhibits62: Market opportunity by End-user ($ million)
- Exhibits63: Data Table on Market opportunity by End-user ($ million)
- Exhibits64: Analysis of price sensitivity, lifecycle, customer purchase basket, adoption rates, and purchase criteria
- Exhibits65: Chart on Market share By Geographical Landscape 2023-2028 (%)
- Exhibits66: Data Table on Market share By Geographical Landscape 2023-2028 (%)
- Exhibits67: Chart on Geographic comparison
- Exhibits68: Data Table on Geographic comparison
- Exhibits69: Chart on North America - Market size and forecast 2023-2028 ($ million)
- Exhibits70: Data Table on North America - Market size and forecast 2023-2028 ($ million)
- Exhibits71: Chart on North America - Year-over-year growth 2023-2028 (%)
- Exhibits72: Data Table on North America - Year-over-year growth 2023-2028 (%)
- Exhibits73: Chart on Europe - Market size and forecast 2023-2028 ($ million)
- Exhibits74: Data Table on Europe - Market size and forecast 2023-2028 ($ million)
- Exhibits75: Chart on Europe - Year-over-year growth 2023-2028 (%)
- Exhibits76: Data Table on Europe - Year-over-year growth 2023-2028 (%)
- Exhibits77: Chart on APAC - Market size and forecast 2023-2028 ($ million)
- Exhibits78: Data Table on APAC - Market size and forecast 2023-2028 ($ million)
- Exhibits79: Chart on APAC - Year-over-year growth 2023-2028 (%)
- Exhibits80: Data Table on APAC - Year-over-year growth 2023-2028 (%)
- Exhibits81: Chart on Middle East and Africa - Market size and forecast 2023-2028 ($ million)
- Exhibits82: Data Table on Middle East and Africa - Market size and forecast 2023-2028 ($ million)
- Exhibits83: Chart on Middle East and Africa - Year-over-year growth 2023-2028 (%)
- Exhibits84: Data Table on Middle East and Africa - Year-over-year growth 2023-2028 (%)
- Exhibits85: Chart on South America - Market size and forecast 2023-2028 ($ million)
- Exhibits86: Data Table on South America - Market size and forecast 2023-2028 ($ million)
- Exhibits87: Chart on South America - Year-over-year growth 2023-2028 (%)
- Exhibits88: Data Table on South America - Year-over-year growth 2023-2028 (%)
- Exhibits89: Chart on US - Market size and forecast 2023-2028 ($ million)
- Exhibits90: Data Table on US - Market size and forecast 2023-2028 ($ million)
- Exhibits91: Chart on US - Year-over-year growth 2023-2028 (%)
- Exhibits92: Data Table on US - Year-over-year growth 2023-2028 (%)
- Exhibits93: Chart on China - Market size and forecast 2023-2028 ($ million)
- Exhibits94: Data Table on China - Market size and forecast 2023-2028 ($ million)
- Exhibits95: Chart on China - Year-over-year growth 2023-2028 (%)
- Exhibits96: Data Table on China - Year-over-year growth 2023-2028 (%)
- Exhibits97: Chart on Germany - Market size and forecast 2023-2028 ($ million)
- Exhibits98: Data Table on Germany - Market size and forecast 2023-2028 ($ million)
- Exhibits99: Chart on Germany - Year-over-year growth 2023-2028 (%)
- Exhibits100: Data Table on Germany - Year-over-year growth 2023-2028 (%)
- Exhibits101: Chart on UK - Market size and forecast 2023-2028 ($ million)
- Exhibits102: Data Table on UK - Market size and forecast 2023-2028 ($ million)
- Exhibits103: Chart on UK - Year-over-year growth 2023-2028 (%)
- Exhibits104: Data Table on UK - Year-over-year growth 2023-2028 (%)
- Exhibits105: Chart on Canada - Market size and forecast 2023-2028 ($ million)
- Exhibits106: Data Table on Canada - Market size and forecast 2023-2028 ($ million)
- Exhibits107: Chart on Canada - Year-over-year growth 2023-2028 (%)
- Exhibits108: Data Table on Canada - Year-over-year growth 2023-2028 (%)
- Exhibits109: Market opportunity By Geographical Landscape ($ million)
- Exhibits110: Data Tables on Market opportunity By Geographical Landscape ($ million)
- Exhibits111: Impact of drivers and challenges in 2023 and 2028
- Exhibits112: Overview on criticality of inputs and factors of differentiation
- Exhibits113: Overview on factors of disruption
- Exhibits114: Impact of key risks on business
- Exhibits115: Companies covered
- Exhibits116: Matrix on companies position and classification
- Exhibits117: AMETEK Inc. - Overview
- Exhibits118: AMETEK Inc. - Business segments
- Exhibits119: AMETEK Inc. - Key news
- Exhibits120: AMETEK Inc. - Key offerings
- Exhibits121: AMETEK Inc. - Segment focus
- Exhibits122: Ascom Holding AG - Overview
- Exhibits123: Ascom Holding AG - Business segments
- Exhibits124: Ascom Holding AG - Key news
- Exhibits125: Ascom Holding AG - Key offerings
- Exhibits126: Ascom Holding AG - Segment focus
- Exhibits127: Austco Healthcare Ltd. - Overview
- Exhibits128: Austco Healthcare Ltd. - Business segments
- Exhibits129: Austco Healthcare Ltd. - Key offerings
- Exhibits130: Austco Healthcare Ltd. - Segment focus
- Exhibits131: Baxter International Inc. - Overview
- Exhibits132: Baxter International Inc. - Business segments
- Exhibits133: Baxter International Inc. - Key news
- Exhibits134: Baxter International Inc. - Key offerings
- Exhibits135: Baxter International Inc. - Segment focus
- Exhibits136: Bec Integrated Solutions LLC - Overview
- Exhibits137: Bec Integrated Solutions LLC - Product / Service
- Exhibits138: Bec Integrated Solutions LLC - Key offerings
- Exhibits139: Carecom Co. Ltd. - Overview
- Exhibits140: Carecom Co. Ltd. - Product / Service
- Exhibits141: Carecom Co. Ltd. - Key offerings
- Exhibits142: Caretronic d.o.o. - Overview
- Exhibits143: Caretronic d.o.o. - Product / Service
- Exhibits144: Caretronic d.o.o. - Key offerings
- Exhibits145: Cornell Communications - Overview
- Exhibits146: Cornell Communications - Product / Service
- Exhibits147: Cornell Communications - Key offerings
- Exhibits148: Essec Group - Overview
- Exhibits149: Essec Group - Product / Service
- Exhibits150: Essec Group - Key offerings
- Exhibits151: Halma Plc - Overview
- Exhibits152: Halma Plc - Business segments
- Exhibits153: Halma Plc - Key news
- Exhibits154: Halma Plc - Key offerings
- Exhibits155: Halma Plc - Segment focus
- Exhibits156: Johnson Controls International Plc. - Overview
- Exhibits157: Johnson Controls International Plc. - Business segments
- Exhibits158: Johnson Controls International Plc. - Key news
- Exhibits159: Johnson Controls International Plc. - Key offerings
- Exhibits160: Johnson Controls International Plc. - Segment focus
- Exhibits161: Securitas AG - Overview
- Exhibits162: Securitas AG - Product / Service
- Exhibits163: Securitas AG - Key offerings
- Exhibits164: TekTone Sound and Signal Mfg. Inc. - Overview
- Exhibits165: TekTone Sound and Signal Mfg. Inc. - Product / Service
- Exhibits166: TekTone Sound and Signal Mfg. Inc. - Key offerings
- Exhibits167: TigerConnect Inc. - Overview
- Exhibits168: TigerConnect Inc. - Product / Service
- Exhibits169: TigerConnect Inc. - Key offerings
- Exhibits170: Tunstall Healthcare Group Ltd. - Overview
- Exhibits171: Tunstall Healthcare Group Ltd. - Product / Service
- Exhibits172: Tunstall Healthcare Group Ltd. - Key offerings
- Exhibits173: Inclusions checklist
- Exhibits174: Exclusions checklist
- Exhibits175: Currency conversion rates for US$
- Exhibits176: Research methodology
- Exhibits177: Information sources
- Exhibits178: Data validation
- Exhibits179: Validation techniques employed for market sizing
- Exhibits180: Data synthesis
- Exhibits181: 360 degree market analysis
- Exhibits182: List of abbreviations
The nurse call systems market is forecasted to grow by USD 1786.3 mn during 2023-2028, accelerating at a CAGR of 13.64% during the forecast period. The report on the nurse call systems market provides a holistic analysis, market size and forecast, trends, growth drivers, and challenges, as well as vendor analysis covering around 25 vendors.
The report offers an up-to-date analysis regarding the current market scenario, the latest trends and drivers, and the overall market environment. The market is driven by growing geriatric population, increasing demand for efficient healthcare communication systems, and robust demand for multilingual nurse call system.
Technavio's nurse call systems market is segmented as below:
| Market Scope | |
|---|---|
| Base Year | 2024 |
| End Year | 2028 |
| Series Year | 2024-2028 |
| Growth Momentum | Accelerate |
| YOY 2024 | 11.73% |
| CAGR | 13.64% |
| Incremental Value | $1786.3mn |
By Technology
- Wired systems
- Wireless systems
By End-user
- Hospitals
- ASCs/Clinics
- Long-term care facilities
By Geographical Landscape
- North America
- Europe
- APAC
- Middle East and Africa
- South America
This study identifies the increasing investments in healthcare infrastructure as one of the prime reasons driving the nurse call systems market growth during the next few years. Also, increased demand for digital healthcare and rapid growth potential in emerging economies will lead to sizable demand in the market.
The report on the nurse call systems market covers the following areas:
- Nurse call systems market sizing
- Nurse call systems market forecast
- Nurse call systems market industry analysis
The robust vendor analysis is designed to help clients improve their market position, and in line with this, this report provides a detailed analysis of several leading nurse call systems market vendors that include Alpha Communications, AMETEK Inc., Ascom Holding AG, Austco Healthcare Ltd., Baxter International Inc., Bec Integrated Solutions LLC, Carecom Co. Ltd., Caretronic d.o.o., Cornell Communications, Essec Group, Halma Plc, Honeywell International Inc., Jeron Electronic Systems Inc., Johnson Controls International Plc., Securitas AG, System Technologies, TekTone Sound and Signal Mfg. Inc., TigerConnect Inc., Tunstall Healthcare Group Ltd., and West Com Nurse Call Systems Inc.. Also, the nurse call systems market analysis report includes information on upcoming trends and challenges that will influence market growth. This is to help companies strategize and leverage all forthcoming growth opportunities.
The study was conducted using an objective combination of primary and secondary information including inputs from key participants in the industry. The report contains a comprehensive market and vendor landscape in addition to an analysis of the key vendors.
The publisher presents a detailed picture of the market by the way of study, synthesis, and summation of data from multiple sources by an analysis of key parameters such as profit, pricing, competition, and promotions. It presents various market facets by identifying the key industry influencers. The data presented is comprehensive, reliable, and a result of extensive research - both primary and secondary. The market research reports provide a complete competitive landscape and an in-depth vendor selection methodology and analysis using qualitative and quantitative research to forecast the accurate market growth.
Table of Contents
1 Executive Summary
- 1.1 Market overview
- Executive Summary - Chart on Market Overview
- Executive Summary - Data Table on Market Overview
- Executive Summary - Chart on Global Market Characteristics
- Executive Summary - Chart on Market By Geographical Landscape
- Executive Summary - Chart on Market Segmentation by Technology
- Executive Summary - Chart on Market Segmentation by End-user
- Executive Summary - Chart on Incremental Growth
- Executive Summary - Data Table on Incremental Growth
- Executive Summary - Chart on Company Market Positioning
2 Market Landscape
- 2.1 Market ecosystem
- Parent Market
- Data Table on - Parent Market
- 2.2 Market characteristics
- Market characteristics analysis
- 2.3 Value chain analysis
- Value Chain Analysis
3 Market Sizing
- 3.1 Market definition
- Offerings of companies included in the market definition
- 3.2 Market segment analysis
- Market segments
- 3.3 Market size 2023
- 3.4 Market outlook: Forecast for 2023-2028
- Chart on Global - Market size and forecast 2023-2028 ($ million)
- Data Table on Global - Market size and forecast 2023-2028 ($ million)
- Chart on Global Market: Year-over-year growth 2023-2028 (%)
- Data Table on Global Market: Year-over-year growth 2023-2028 (%)
4 Historic Market Size
- 4.1 Global Nurse Call Systems Market 2018 - 2022
- Historic Market Size - Data Table on Global Nurse Call Systems Market 2018 - 2022 ($ million)
- 4.2 Technology segment analysis 2018 - 2022
- Historic Market Size - Technology Segment 2018 - 2022 ($ million)
- 4.3 End-user segment analysis 2018 - 2022
- Historic Market Size - End-user Segment 2018 - 2022 ($ million)
- 4.4 Geography segment analysis 2018 - 2022
- Historic Market Size - Geography Segment 2018 - 2022 ($ million)
- 4.5 Country segment analysis 2018 - 2022
- Historic Market Size - Country Segment 2018 - 2022 ($ million)
5 Five Forces Analysis
- 5.1 Five forces summary
- Five forces analysis - Comparison between 2023 and 2028
- 5.2 Bargaining power of buyers
- Bargaining power of buyers - Impact of key factors 2023 and 2028
- 5.3 Bargaining power of suppliers
- Bargaining power of suppliers - Impact of key factors in 2023 and 2028
- 5.4 Threat of new entrants
- Threat of new entrants - Impact of key factors in 2023 and 2028
- 5.5 Threat of substitutes
- Threat of substitutes - Impact of key factors in 2023 and 2028
- 5.6 Threat of rivalry
- Threat of rivalry - Impact of key factors in 2023 and 2028
- 5.7 Market condition
- Chart on Market condition - Five forces 2023 and 2028
6 Market Segmentation by Technology
- 6.1 Market segments
- Chart on Technology - Market share 2023-2028 (%)
- Data Table on Technology - Market share 2023-2028 (%)
- 6.2 Comparison by Technology
- Chart on Comparison by Technology
- Data Table on Comparison by Technology
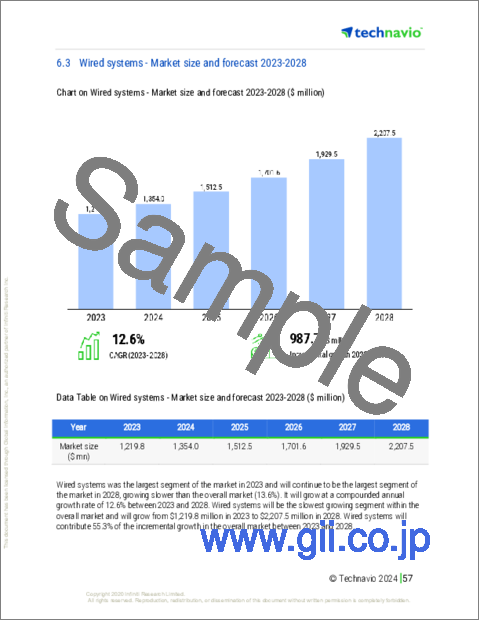
- 6.3 Wired systems - Market size and forecast 2023-2028
- Chart on Wired systems - Market size and forecast 2023-2028 ($ million)
- Data Table on Wired systems - Market size and forecast 2023-2028 ($ million)
- Chart on Wired systems - Year-over-year growth 2023-2028 (%)
- Data Table on Wired systems - Year-over-year growth 2023-2028 (%)
- 6.4 Wireless systems - Market size and forecast 2023-2028
- Chart on Wireless systems - Market size and forecast 2023-2028 ($ million)
- Data Table on Wireless systems - Market size and forecast 2023-2028 ($ million)
- Chart on Wireless systems - Year-over-year growth 2023-2028 (%)
- Data Table on Wireless systems - Year-over-year growth 2023-2028 (%)
- 6.5 Market opportunity by Technology
- Market opportunity by Technology ($ million)
- Data Table on Market opportunity by Technology ($ million)
7 Market Segmentation by End-user
- 7.1 Market segments
- Chart on End-user - Market share 2023-2028 (%)
- Data Table on End-user - Market share 2023-2028 (%)
- 7.2 Comparison by End-user
- Chart on Comparison by End-user
- Data Table on Comparison by End-user
- 7.3 Hospitals - Market size and forecast 2023-2028
- Chart on Hospitals - Market size and forecast 2023-2028 ($ million)
- Data Table on Hospitals - Market size and forecast 2023-2028 ($ million)
- Chart on Hospitals - Year-over-year growth 2023-2028 (%)
- Data Table on Hospitals - Year-over-year growth 2023-2028 (%)
- 7.4 ASCs/Clinics - Market size and forecast 2023-2028
- Chart on ASCs/Clinics - Market size and forecast 2023-2028 ($ million)
- Data Table on ASCs/Clinics - Market size and forecast 2023-2028 ($ million)
- Chart on ASCs/Clinics - Year-over-year growth 2023-2028 (%)
- Data Table on ASCs/Clinics - Year-over-year growth 2023-2028 (%)
- 7.5 Long-term care facilities - Market size and forecast 2023-2028
- Chart on Long-term care facilities - Market size and forecast 2023-2028 ($ million)
- Data Table on Long-term care facilities - Market size and forecast 2023-2028 ($ million)
- Chart on Long-term care facilities - Year-over-year growth 2023-2028 (%)
- Data Table on Long-term care facilities - Year-over-year growth 2023-2028 (%)
- 7.6 Market opportunity by End-user
- Market opportunity by End-user ($ million)
- Data Table on Market opportunity by End-user ($ million)
8 Customer Landscape
- 8.1 Customer landscape overview
- Analysis of price sensitivity, lifecycle, customer purchase basket, adoption rates, and purchase criteria
9 Geographic Landscape
- 9.1 Geographic segmentation
- Chart on Market share By Geographical Landscape 2023-2028 (%)
- Data Table on Market share By Geographical Landscape 2023-2028 (%)
- 9.2 Geographic comparison
- Chart on Geographic comparison
- Data Table on Geographic comparison
- 9.3 North America - Market size and forecast 2023-2028
- Chart on North America - Market size and forecast 2023-2028 ($ million)
- Data Table on North America - Market size and forecast 2023-2028 ($ million)
- Chart on North America - Year-over-year growth 2023-2028 (%)
- Data Table on North America - Year-over-year growth 2023-2028 (%)
- 9.4 Europe - Market size and forecast 2023-2028
- Chart on Europe - Market size and forecast 2023-2028 ($ million)
- Data Table on Europe - Market size and forecast 2023-2028 ($ million)
- Chart on Europe - Year-over-year growth 2023-2028 (%)
- Data Table on Europe - Year-over-year growth 2023-2028 (%)
- 9.5 APAC - Market size and forecast 2023-2028
- Chart on APAC - Market size and forecast 2023-2028 ($ million)
- Data Table on APAC - Market size and forecast 2023-2028 ($ million)
- Chart on APAC - Year-over-year growth 2023-2028 (%)
- Data Table on APAC - Year-over-year growth 2023-2028 (%)
- 9.6 Middle East and Africa - Market size and forecast 2023-2028
- Chart on Middle East and Africa - Market size and forecast 2023-2028 ($ million)
- Data Table on Middle East and Africa - Market size and forecast 2023-2028 ($ million)
- Chart on Middle East and Africa - Year-over-year growth 2023-2028 (%)
- Data Table on Middle East and Africa - Year-over-year growth 2023-2028 (%)
- 9.7 South America - Market size and forecast 2023-2028
- Chart on South America - Market size and forecast 2023-2028 ($ million)
- Data Table on South America - Market size and forecast 2023-2028 ($ million)
- Chart on South America - Year-over-year growth 2023-2028 (%)
- Data Table on South America - Year-over-year growth 2023-2028 (%)
- 9.8 US - Market size and forecast 2023-2028
- Chart on US - Market size and forecast 2023-2028 ($ million)
- Data Table on US - Market size and forecast 2023-2028 ($ million)
- Chart on US - Year-over-year growth 2023-2028 (%)
- Data Table on US - Year-over-year growth 2023-2028 (%)
- 9.9 China - Market size and forecast 2023-2028
- Chart on China - Market size and forecast 2023-2028 ($ million)
- Data Table on China - Market size and forecast 2023-2028 ($ million)
- Chart on China - Year-over-year growth 2023-2028 (%)
- Data Table on China - Year-over-year growth 2023-2028 (%)
- 9.10 Germany - Market size and forecast 2023-2028
- Chart on Germany - Market size and forecast 2023-2028 ($ million)
- Data Table on Germany - Market size and forecast 2023-2028 ($ million)
- Chart on Germany - Year-over-year growth 2023-2028 (%)
- Data Table on Germany - Year-over-year growth 2023-2028 (%)
- 9.11 UK - Market size and forecast 2023-2028
- Chart on UK - Market size and forecast 2023-2028 ($ million)
- Data Table on UK - Market size and forecast 2023-2028 ($ million)
- Chart on UK - Year-over-year growth 2023-2028 (%)
- Data Table on UK - Year-over-year growth 2023-2028 (%)
- 9.12 Canada - Market size and forecast 2023-2028
- Chart on Canada - Market size and forecast 2023-2028 ($ million)
- Data Table on Canada - Market size and forecast 2023-2028 ($ million)
- Chart on Canada - Year-over-year growth 2023-2028 (%)
- Data Table on Canada - Year-over-year growth 2023-2028 (%)
- 9.13 Market opportunity By Geographical Landscape
- Market opportunity By Geographical Landscape ($ million)
- Data Tables on Market opportunity By Geographical Landscape ($ million)
10 Drivers, Challenges, and Opportunity/Restraints
- 10.1 Market drivers
- 10.2 Market challenges
- 10.3 Impact of drivers and challenges
- Impact of drivers and challenges in 2023 and 2028
- 10.4 Market opportunities/restraints
11 Competitive Landscape
- 11.1 Overview
- 11.2 Competitive Landscape
- Overview on criticality of inputs and factors of differentiation
- 11.3 Landscape disruption
- Overview on factors of disruption
- 11.4 Industry risks
- Impact of key risks on business
12 Competitive Analysis
- 12.1 Companies profiled
- Companies covered
- 12.2 Market positioning of companies
- Matrix on companies position and classification
- 12.3 AMETEK Inc.
- AMETEK Inc. - Overview
- AMETEK Inc. - Business segments
- AMETEK Inc. - Key news
- AMETEK Inc. - Key offerings
- AMETEK Inc. - Segment focus
- 12.4 Ascom Holding AG
- Ascom Holding AG - Overview
- Ascom Holding AG - Business segments
- Ascom Holding AG - Key news
- Ascom Holding AG - Key offerings
- Ascom Holding AG - Segment focus
- 12.5 Austco Healthcare Ltd.
- Austco Healthcare Ltd. - Overview
- Austco Healthcare Ltd. - Business segments
- Austco Healthcare Ltd. - Key offerings
- Austco Healthcare Ltd. - Segment focus
- 12.6 Baxter International Inc.
- Baxter International Inc. - Overview
- Baxter International Inc. - Business segments
- Baxter International Inc. - Key news
- Baxter International Inc. - Key offerings
- Baxter International Inc. - Segment focus
- 12.7 Bec Integrated Solutions LLC
- Bec Integrated Solutions LLC - Overview
- Bec Integrated Solutions LLC - Product / Service
- Bec Integrated Solutions LLC - Key offerings
- 12.8 Carecom Co. Ltd.
- Carecom Co. Ltd. - Overview
- Carecom Co. Ltd. - Product / Service
- Carecom Co. Ltd. - Key offerings
- 12.9 Caretronic d.o.o.
- Caretronic d.o.o. - Overview
- Caretronic d.o.o. - Product / Service
- Caretronic d.o.o. - Key offerings
- 12.10 Cornell Communications
- Cornell Communications - Overview
- Cornell Communications - Product / Service
- Cornell Communications - Key offerings
- 12.11 Essec Group
- Essec Group - Overview
- Essec Group - Product / Service
- Essec Group - Key offerings
- 12.12 Halma Plc
- Halma Plc - Overview
- Halma Plc - Business segments
- Halma Plc - Key news
- Halma Plc - Key offerings
- Halma Plc - Segment focus
- 12.13 Johnson Controls International Plc.
- Johnson Controls International Plc. - Overview
- Johnson Controls International Plc. - Business segments
- Johnson Controls International Plc. - Key news
- Johnson Controls International Plc. - Key offerings
- Johnson Controls International Plc. - Segment focus
- 12.14 Securitas AG
- Securitas AG - Overview
- Securitas AG - Product / Service
- Securitas AG - Key offerings
- 12.15 TekTone Sound and Signal Mfg. Inc.
- TekTone Sound and Signal Mfg. Inc. - Overview
- TekTone Sound and Signal Mfg. Inc. - Product / Service
- TekTone Sound and Signal Mfg. Inc. - Key offerings
- 12.16 TigerConnect Inc.
- TigerConnect Inc. - Overview
- TigerConnect Inc. - Product / Service
- TigerConnect Inc. - Key offerings
- 12.17 Tunstall Healthcare Group Ltd.
- Tunstall Healthcare Group Ltd. - Overview
- Tunstall Healthcare Group Ltd. - Product / Service
- Tunstall Healthcare Group Ltd. - Key offerings
13 Appendix
- 13.1 Scope of the report
- 13.2 Inclusions and exclusions checklist
- Inclusions checklist
- Exclusions checklist
- 13.3 Currency conversion rates for US$
- Currency conversion rates for US$
- 13.4 Research methodology
- Research methodology
- 13.5 Data procurement
- Information sources
- 13.6 Data validation
- Data validation
- 13.7 Validation techniques employed for market sizing
- Validation techniques employed for market sizing
- 13.8 Data synthesis
- Data synthesis
- 13.9 360 degree market analysis
- 360 degree market analysis
- 13.10 List of abbreviations
- List of abbreviations

