|
|
市場調査レポート
商品コード
1723019
エンドポイントセキュリティの世界市場 2025~2029年Global Endpoint Security Market 2025-2029 |
||||||

|
|||||||
カスタマイズ可能
|
|||||||


| エンドポイントセキュリティの世界市場 2025~2029年 |
|
出版日: 2025年04月30日
発行: TechNavio
ページ情報: 英文 244 Pages
納期: 即納可能
|

全表示
- 概要
- 図表
- 目次
エンドポイントセキュリティ市場は2024~2029年に241億8,620万米ドル、予測期間中のCAGRは21.6%で成長すると予測されます。
当レポートでは、エンドポイントセキュリティ市場の全体的な分析、市場規模・予測、動向、成長促進要因、課題、約25のベンダーを網羅したベンダー分析などを掲載しています。
現在の市場シナリオ、最新動向と促進要因、市場環境全体に関する最新分析を提供しています。サイバー攻撃の増加、企業におけるエンタープライズモビリティとBYODポリシーの台頭、データ保護に関する厳しい規制と政策が市場を牽引しています。
| 市場範囲 | |
|---|---|
| 基準年 | 2025年 |
| 終了年 | 2029年 |
| 予測期間 | 2025~2029年 |
| 成長モメンタム | 加速 |
| 前年比2025年 | 18.4% |
| CAGR | 21.6% |
| 増分額 | 241億8,620万米ドル |
本調査は、業界の主要参加者からのインプットを含め、一次情報と二次情報を客観的に組み合わせて実施しました。レポートには、主要企業の分析に加え、包括的な市場規模データ、地域分析によるセグメント、ベンダー情勢が含まれています。レポートにはヒストリカルデータと予測データがあります。
本調査では、今後数年間のエンドポイントセキュリティ市場の成長を促進する主な要因の一つとして、企業間の戦略的提携や買収を挙げています。また、エンドポイントセキュリティソリューションに関連する最近の動向や、クラウドベースのエンドポイントセキュリティソリューションの採用拡大も、市場の大きな需要につながるでしょう。
目次
第1章 エグゼクティブサマリー
- 市場概要
第2章 Technavio分析
- 価格・ライフサイクル・顧客購入バスケット・採用率・購入基準の分析
- インプットの重要性と差別化の要因
- 混乱の要因
- 促進要因と課題の影響
第3章 市場情勢
- 市場エコシステム
- 市場の特徴
- バリューチェーン分析
第4章 市場規模
- 市場の定義
- 市場セグメント分析
- 市場規模 2024年
- 市場の見通し 2024~2029年
第5章 市場規模実績
- エンドポイントセキュリティの世界市場 2019~2023年
- 展開別セグメント分析 2019~2023年
- エンドユーザー別セグメント分析 2019~2023年
- サービス別セグメント分析 2019~2023年
- セクター別セグメント分析 2019~2023年
- 地域別セグメント分析 2019~2023年
- 国別セグメント分析 2019~2023年
第6章 定性分析
- AIの影響
第7章 ファイブフォース分析
- ファイブフォースの要約
- 買い手の交渉力
- 供給企業の交渉力
- 新規参入業者の脅威
- 代替品の脅威
- 競争の脅威
- 市況
第8章 市場セグメンテーション:展開別
- 市場セグメント
- 比較:展開別
- オンプレミス:市場規模と予測 2024~2029年
- クラウドベース:市場規模と予測 2024~2029年
- 市場機会:展開別
第9章 市場セグメンテーション:エンドユーザー別
- 市場セグメント
- 比較:エンドユーザー別
- BFSI:市場規模と予測 2024~2029年
- ITおよび通信:市場規模と予測 2024~2029年
- 小売り:市場規模と予測 2024~2029年
- ヘルスケア:市場規模と予測 2024~2029年
- その他:市場規模と予測 2024~2029年
- 市場機会:エンドユーザー別
第10章 市場セグメンテーション:サービス別
- 市場セグメント
- 比較:サービス別
- 専門サービス:市場規模と予測 2024~2029年
- マネージドサービス:市場規模と予測 2024~2029年
- 市場機会:サービス別
第11章 市場セグメンテーション:セクター別
- 市場セグメント
- 比較:セクター別
- 大企業:市場規模と予測 2024~2029年
- 中小企業:市場規模と予測 2024~2029年
- 市場機会:セクター別
第12章 顧客情勢
- 顧客情勢の概要
第13章 地域別情勢
- 地域別セグメンテーション
- 地域別比較
- 北米:市場規模と予測 2024~2029年
- 欧州:市場規模と予測 2024~2029年
- アジア太平洋:市場規模と予測 2024~2029年
- 中東・アフリカ:市場規模と予測 2024~2029年
- 南米:市場規模と予測 2024~2029年
- 米国:市場規模と予測 2024~2029年
- カナダ:市場規模と予測 2024~2029年
- 中国:市場規模と予測 2024~2029年
- メキシコ:市場規模と予測 2024~2029年
- ドイツ:市場規模と予測 2024~2029年
- 英国:市場規模と予測 2024~2029年
- ロシア:市場規模と予測 2024~2029年
- サウジアラビア:市場規模と予測 2024~2029年
- 日本:市場規模と予測 2024~2029年
- フランス:市場規模と予測 2024~2029年
- 市場機会:地域情勢別
第14章 促進要因・課題・機会・抑制要因
- 市場促進要因
- 市場の課題
- 促進要因と課題の影響
- 市場の機会・抑制要因
第15章 競合情勢
- 概要
- 競合情勢
- 混乱の状況
- 業界のリスク
第16章 競合分析
- 企業プロファイル
- 企業ランキング指数
- 企業の市場ポジショニング
- AO Kaspersky Lab
- BlackBerry Ltd.
- Broadcom Inc.
- Check Point Software Technologies Ltd.
- Cisco Systems Inc.
- CrowdStrike Inc.
- ESET North America
- F Secure Corp.
- Fortinet Inc.
- McAfee LLC
- Microsoft Corp.
- Musarubra US LLC
- Palo Alto Networks Inc.
- S.C. BITDEFENDER S.R.L
- WatchGuard Technologies Inc.
第17章 付録
Exhibits:
- Exhibits1: Executive Summary - Chart on Market Overview
- Exhibits2: Executive Summary - Data Table on Market Overview
- Exhibits3: Executive Summary - Chart on Global Market Characteristics
- Exhibits4: Executive Summary - Chart on Market By Geographical Landscape
- Exhibits5: Executive Summary - Chart on Market Segmentation by Deployment
- Exhibits6: Executive Summary - Chart on Market Segmentation by End-user
- Exhibits7: Executive Summary - Chart on Market Segmentation by Service
- Exhibits8: Executive Summary - Chart on Market Segmentation by Sector
- Exhibits9: Executive Summary - Chart on Incremental Growth
- Exhibits10: Executive Summary - Data Table on Incremental Growth
- Exhibits11: Executive Summary - Chart on Company Market Positioning
- Exhibits12: Analysis of price sensitivity, lifecycle, customer purchase basket, adoption rates, and purchase criteria
- Exhibits13: Overview on criticality of inputs and factors of differentiation
- Exhibits14: Overview on factors of disruption
- Exhibits15: Impact of drivers and challenges in 2024 and 2029
- Exhibits16: Parent Market
- Exhibits17: Data Table on - Parent Market
- Exhibits18: Market characteristics analysis
- Exhibits19: Value chain analysis
- Exhibits20: Offerings of companies included in the market definition
- Exhibits21: Market segments
- Exhibits22: Chart on Global - Market size and forecast 2024-2029 ($ million)
- Exhibits23: Data Table on Global - Market size and forecast 2024-2029 ($ million)
- Exhibits24: Chart on Global Market: Year-over-year growth 2024-2029 (%)
- Exhibits25: Data Table on Global Market: Year-over-year growth 2024-2029 (%)
- Exhibits26: Historic Market Size - Data Table on Global Endpoint Security Market 2019 - 2023 ($ million)
- Exhibits27: Historic Market Size - Deployment Segment 2019 - 2023 ($ million)
- Exhibits28: Historic Market Size - End-user Segment 2019 - 2023 ($ million)
- Exhibits29: Historic Market Size - Service Segment 2019 - 2023 ($ million)
- Exhibits30: Historic Market Size - Sector Segment 2019 - 2023 ($ million)
- Exhibits31: Historic Market Size - Geography Segment 2019 - 2023 ($ million)
- Exhibits32: Historic Market Size - Country Segment 2019 - 2023 ($ million)
- Exhibits33: Five forces analysis - Comparison between 2024 and 2029
- Exhibits34: Bargaining power of buyers - Impact of key factors 2024 and 2029
- Exhibits35: Bargaining power of suppliers - Impact of key factors in 2024 and 2029
- Exhibits36: Threat of new entrants - Impact of key factors in 2024 and 2029
- Exhibits37: Threat of substitutes - Impact of key factors in 2024 and 2029
- Exhibits38: Threat of rivalry - Impact of key factors in 2024 and 2029
- Exhibits39: Chart on Market condition - Five forces 2024 and 2029
- Exhibits40: Chart on Deployment - Market share 2024-2029 (%)
- Exhibits41: Data Table on Deployment - Market share 2024-2029 (%)
- Exhibits42: Chart on Comparison by Deployment
- Exhibits43: Data Table on Comparison by Deployment
- Exhibits44: Chart on On-premises - Market size and forecast 2024-2029 ($ million)
- Exhibits45: Data Table on On-premises - Market size and forecast 2024-2029 ($ million)
- Exhibits46: Chart on On-premises - Year-over-year growth 2024-2029 (%)
- Exhibits47: Data Table on On-premises - Year-over-year growth 2024-2029 (%)
- Exhibits48: Chart on Cloud-based - Market size and forecast 2024-2029 ($ million)
- Exhibits49: Data Table on Cloud-based - Market size and forecast 2024-2029 ($ million)
- Exhibits50: Chart on Cloud-based - Year-over-year growth 2024-2029 (%)
- Exhibits51: Data Table on Cloud-based - Year-over-year growth 2024-2029 (%)
- Exhibits52: Market opportunity by Deployment ($ million)
- Exhibits53: Data Table on Market opportunity by Deployment ($ million)
- Exhibits54: Chart on End-user - Market share 2024-2029 (%)
- Exhibits55: Data Table on End-user - Market share 2024-2029 (%)
- Exhibits56: Chart on Comparison by End-user
- Exhibits57: Data Table on Comparison by End-user
- Exhibits58: Chart on BFSI - Market size and forecast 2024-2029 ($ million)
- Exhibits59: Data Table on BFSI - Market size and forecast 2024-2029 ($ million)
- Exhibits60: Chart on BFSI - Year-over-year growth 2024-2029 (%)
- Exhibits61: Data Table on BFSI - Year-over-year growth 2024-2029 (%)
- Exhibits62: Chart on IT and Telecommunications - Market size and forecast 2024-2029 ($ million)
- Exhibits63: Data Table on IT and Telecommunications - Market size and forecast 2024-2029 ($ million)
- Exhibits64: Chart on IT and Telecommunications - Year-over-year growth 2024-2029 (%)
- Exhibits65: Data Table on IT and Telecommunications - Year-over-year growth 2024-2029 (%)
- Exhibits66: Chart on Retail - Market size and forecast 2024-2029 ($ million)
- Exhibits67: Data Table on Retail - Market size and forecast 2024-2029 ($ million)
- Exhibits68: Chart on Retail - Year-over-year growth 2024-2029 (%)
- Exhibits69: Data Table on Retail - Year-over-year growth 2024-2029 (%)
- Exhibits70: Chart on Healthcare - Market size and forecast 2024-2029 ($ million)
- Exhibits71: Data Table on Healthcare - Market size and forecast 2024-2029 ($ million)
- Exhibits72: Chart on Healthcare - Year-over-year growth 2024-2029 (%)
- Exhibits73: Data Table on Healthcare - Year-over-year growth 2024-2029 (%)
- Exhibits74: Chart on Others - Market size and forecast 2024-2029 ($ million)
- Exhibits75: Data Table on Others - Market size and forecast 2024-2029 ($ million)
- Exhibits76: Chart on Others - Year-over-year growth 2024-2029 (%)
- Exhibits77: Data Table on Others - Year-over-year growth 2024-2029 (%)
- Exhibits78: Market opportunity by End-user ($ million)
- Exhibits79: Data Table on Market opportunity by End-user ($ million)
- Exhibits80: Chart on Service - Market share 2024-2029 (%)
- Exhibits81: Data Table on Service - Market share 2024-2029 (%)
- Exhibits82: Chart on Comparison by Service
- Exhibits83: Data Table on Comparison by Service
- Exhibits84: Chart on Professional services - Market size and forecast 2024-2029 ($ million)
- Exhibits85: Data Table on Professional services - Market size and forecast 2024-2029 ($ million)
- Exhibits86: Chart on Professional services - Year-over-year growth 2024-2029 (%)
- Exhibits87: Data Table on Professional services - Year-over-year growth 2024-2029 (%)
- Exhibits88: Chart on Managed services - Market size and forecast 2024-2029 ($ million)
- Exhibits89: Data Table on Managed services - Market size and forecast 2024-2029 ($ million)
- Exhibits90: Chart on Managed services - Year-over-year growth 2024-2029 (%)
- Exhibits91: Data Table on Managed services - Year-over-year growth 2024-2029 (%)
- Exhibits92: Market opportunity by Service ($ million)
- Exhibits93: Data Table on Market opportunity by Service ($ million)
- Exhibits94: Chart on Sector - Market share 2024-2029 (%)
- Exhibits95: Data Table on Sector - Market share 2024-2029 (%)
- Exhibits96: Chart on Comparison by Sector
- Exhibits97: Data Table on Comparison by Sector
- Exhibits98: Chart on Large enterprises - Market size and forecast 2024-2029 ($ million)
- Exhibits99: Data Table on Large enterprises - Market size and forecast 2024-2029 ($ million)
- Exhibits100: Chart on Large enterprises - Year-over-year growth 2024-2029 (%)
- Exhibits101: Data Table on Large enterprises - Year-over-year growth 2024-2029 (%)
- Exhibits102: Chart on Small and medium-sized enterprises - Market size and forecast 2024-2029 ($ million)
- Exhibits103: Data Table on Small and medium-sized enterprises - Market size and forecast 2024-2029 ($ million)
- Exhibits104: Chart on Small and medium-sized enterprises - Year-over-year growth 2024-2029 (%)
- Exhibits105: Data Table on Small and medium-sized enterprises - Year-over-year growth 2024-2029 (%)
- Exhibits106: Market opportunity by Sector ($ million)
- Exhibits107: Data Table on Market opportunity by Sector ($ million)
- Exhibits108: Analysis of price sensitivity, lifecycle, customer purchase basket, adoption rates, and purchase criteria
- Exhibits109: Chart on Market share By Geographical Landscape 2024-2029 (%)
- Exhibits110: Data Table on Market share By Geographical Landscape 2024-2029 (%)
- Exhibits111: Chart on Geographic comparison
- Exhibits112: Data Table on Geographic comparison
- Exhibits113: Chart on North America - Market size and forecast 2024-2029 ($ million)
- Exhibits114: Data Table on North America - Market size and forecast 2024-2029 ($ million)
- Exhibits115: Chart on North America - Year-over-year growth 2024-2029 (%)
- Exhibits116: Data Table on North America - Year-over-year growth 2024-2029 (%)
- Exhibits117: Chart on Europe - Market size and forecast 2024-2029 ($ million)
- Exhibits118: Data Table on Europe - Market size and forecast 2024-2029 ($ million)
- Exhibits119: Chart on Europe - Year-over-year growth 2024-2029 (%)
- Exhibits120: Data Table on Europe - Year-over-year growth 2024-2029 (%)
- Exhibits121: Chart on APAC - Market size and forecast 2024-2029 ($ million)
- Exhibits122: Data Table on APAC - Market size and forecast 2024-2029 ($ million)
- Exhibits123: Chart on APAC - Year-over-year growth 2024-2029 (%)
- Exhibits124: Data Table on APAC - Year-over-year growth 2024-2029 (%)
- Exhibits125: Chart on Middle East and Africa - Market size and forecast 2024-2029 ($ million)
- Exhibits126: Data Table on Middle East and Africa - Market size and forecast 2024-2029 ($ million)
- Exhibits127: Chart on Middle East and Africa - Year-over-year growth 2024-2029 (%)
- Exhibits128: Data Table on Middle East and Africa - Year-over-year growth 2024-2029 (%)
- Exhibits129: Chart on South America - Market size and forecast 2024-2029 ($ million)
- Exhibits130: Data Table on South America - Market size and forecast 2024-2029 ($ million)
- Exhibits131: Chart on South America - Year-over-year growth 2024-2029 (%)
- Exhibits132: Data Table on South America - Year-over-year growth 2024-2029 (%)
- Exhibits133: Chart on US - Market size and forecast 2024-2029 ($ million)
- Exhibits134: Data Table on US - Market size and forecast 2024-2029 ($ million)
- Exhibits135: Chart on US - Year-over-year growth 2024-2029 (%)
- Exhibits136: Data Table on US - Year-over-year growth 2024-2029 (%)
- Exhibits137: Chart on Canada - Market size and forecast 2024-2029 ($ million)
- Exhibits138: Data Table on Canada - Market size and forecast 2024-2029 ($ million)
- Exhibits139: Chart on Canada - Year-over-year growth 2024-2029 (%)
- Exhibits140: Data Table on Canada - Year-over-year growth 2024-2029 (%)
- Exhibits141: Chart on China - Market size and forecast 2024-2029 ($ million)
- Exhibits142: Data Table on China - Market size and forecast 2024-2029 ($ million)
- Exhibits143: Chart on China - Year-over-year growth 2024-2029 (%)
- Exhibits144: Data Table on China - Year-over-year growth 2024-2029 (%)
- Exhibits145: Chart on Mexico - Market size and forecast 2024-2029 ($ million)
- Exhibits146: Data Table on Mexico - Market size and forecast 2024-2029 ($ million)
- Exhibits147: Chart on Mexico - Year-over-year growth 2024-2029 (%)
- Exhibits148: Data Table on Mexico - Year-over-year growth 2024-2029 (%)
- Exhibits149: Chart on Germany - Market size and forecast 2024-2029 ($ million)
- Exhibits150: Data Table on Germany - Market size and forecast 2024-2029 ($ million)
- Exhibits151: Chart on Germany - Year-over-year growth 2024-2029 (%)
- Exhibits152: Data Table on Germany - Year-over-year growth 2024-2029 (%)
- Exhibits153: Chart on UK - Market size and forecast 2024-2029 ($ million)
- Exhibits154: Data Table on UK - Market size and forecast 2024-2029 ($ million)
- Exhibits155: Chart on UK - Year-over-year growth 2024-2029 (%)
- Exhibits156: Data Table on UK - Year-over-year growth 2024-2029 (%)
- Exhibits157: Chart on Russia - Market size and forecast 2024-2029 ($ million)
- Exhibits158: Data Table on Russia - Market size and forecast 2024-2029 ($ million)
- Exhibits159: Chart on Russia - Year-over-year growth 2024-2029 (%)
- Exhibits160: Data Table on Russia - Year-over-year growth 2024-2029 (%)
- Exhibits161: Chart on Saudi Arabia - Market size and forecast 2024-2029 ($ million)
- Exhibits162: Data Table on Saudi Arabia - Market size and forecast 2024-2029 ($ million)
- Exhibits163: Chart on Saudi Arabia - Year-over-year growth 2024-2029 (%)
- Exhibits164: Data Table on Saudi Arabia - Year-over-year growth 2024-2029 (%)
- Exhibits165: Chart on Japan - Market size and forecast 2024-2029 ($ million)
- Exhibits166: Data Table on Japan - Market size and forecast 2024-2029 ($ million)
- Exhibits167: Chart on Japan - Year-over-year growth 2024-2029 (%)
- Exhibits168: Data Table on Japan - Year-over-year growth 2024-2029 (%)
- Exhibits169: Chart on France - Market size and forecast 2024-2029 ($ million)
- Exhibits170: Data Table on France - Market size and forecast 2024-2029 ($ million)
- Exhibits171: Chart on France - Year-over-year growth 2024-2029 (%)
- Exhibits172: Data Table on France - Year-over-year growth 2024-2029 (%)
- Exhibits173: Market opportunity By Geographical Landscape ($ million)
- Exhibits174: Data Tables on Market opportunity By Geographical Landscape ($ million)
- Exhibits175: Impact of drivers and challenges in 2024 and 2029
- Exhibits176: Overview on criticality of inputs and factors of differentiation
- Exhibits177: Overview on factors of disruption
- Exhibits178: Impact of key risks on business
- Exhibits179: Companies covered
- Exhibits180: Company ranking index
- Exhibits181: Matrix on companies position and classification
- Exhibits182: AO Kaspersky Lab - Overview
- Exhibits183: AO Kaspersky Lab - Product / Service
- Exhibits184: AO Kaspersky Lab - Key offerings
- Exhibits185: SWOT
- Exhibits186: BlackBerry Ltd. - Overview
- Exhibits187: BlackBerry Ltd. - Business segments
- Exhibits188: BlackBerry Ltd. - Key news
- Exhibits189: BlackBerry Ltd. - Key offerings
- Exhibits190: BlackBerry Ltd. - Segment focus
- Exhibits191: SWOT
- Exhibits192: Broadcom Inc. - Overview
- Exhibits193: Broadcom Inc. - Business segments
- Exhibits194: Broadcom Inc. - Key news
- Exhibits195: Broadcom Inc. - Key offerings
- Exhibits196: Broadcom Inc. - Segment focus
- Exhibits197: SWOT
- Exhibits198: Check Point Software Technologies Ltd. - Overview
- Exhibits199: Check Point Software Technologies Ltd. - Product / Service
- Exhibits200: Check Point Software Technologies Ltd. - Key news
- Exhibits201: Check Point Software Technologies Ltd. - Key offerings
- Exhibits202: SWOT
- Exhibits203: Cisco Systems Inc. - Overview
- Exhibits204: Cisco Systems Inc. - Business segments
- Exhibits205: Cisco Systems Inc. - Key news
- Exhibits206: Cisco Systems Inc. - Key offerings
- Exhibits207: Cisco Systems Inc. - Segment focus
- Exhibits208: SWOT
- Exhibits209: CrowdStrike Inc. - Overview
- Exhibits210: CrowdStrike Inc. - Product / Service
- Exhibits211: CrowdStrike Inc. - Key offerings
- Exhibits212: SWOT
- Exhibits213: ESET North America - Overview
- Exhibits214: ESET North America - Product / Service
- Exhibits215: ESET North America - Key offerings
- Exhibits216: SWOT
- Exhibits217: F Secure Corp. - Overview
- Exhibits218: F Secure Corp. - Product / Service
- Exhibits219: F Secure Corp. - Key offerings
- Exhibits220: SWOT
- Exhibits221: Fortinet Inc. - Overview
- Exhibits222: Fortinet Inc. - Product / Service
- Exhibits223: Fortinet Inc. - Key news
- Exhibits224: Fortinet Inc. - Key offerings
- Exhibits225: SWOT
- Exhibits226: McAfee LLC - Overview
- Exhibits227: McAfee LLC - Product / Service
- Exhibits228: McAfee LLC - Key offerings
- Exhibits229: SWOT
- Exhibits230: Microsoft Corp. - Overview
- Exhibits231: Microsoft Corp. - Business segments
- Exhibits232: Microsoft Corp. - Key news
- Exhibits233: Microsoft Corp. - Key offerings
- Exhibits234: Microsoft Corp. - Segment focus
- Exhibits235: SWOT
- Exhibits236: Musarubra US LLC - Overview
- Exhibits237: Musarubra US LLC - Product / Service
- Exhibits238: Musarubra US LLC - Key news
- Exhibits239: Musarubra US LLC - Key offerings
- Exhibits240: SWOT
- Exhibits241: Palo Alto Networks Inc. - Overview
- Exhibits242: Palo Alto Networks Inc. - Product / Service
- Exhibits243: Palo Alto Networks Inc. - Key news
- Exhibits244: Palo Alto Networks Inc. - Key offerings
- Exhibits245: SWOT
- Exhibits246: S.C. BITDEFENDER S.R.L - Overview
- Exhibits247: S.C. BITDEFENDER S.R.L - Product / Service
- Exhibits248: S.C. BITDEFENDER S.R.L - Key offerings
- Exhibits249: SWOT
- Exhibits250: WatchGuard Technologies Inc. - Overview
- Exhibits251: WatchGuard Technologies Inc. - Product / Service
- Exhibits252: WatchGuard Technologies Inc. - Key offerings
- Exhibits253: SWOT
- Exhibits254: Inclusions checklist
- Exhibits255: Exclusions checklist
- Exhibits256: Currency conversion rates for US$
- Exhibits257: Research methodology
- Exhibits258: Information sources
- Exhibits259: Data validation
- Exhibits260: Validation techniques employed for market sizing
- Exhibits261: Data synthesis
- Exhibits262: 360 degree market analysis
- Exhibits263: List of abbreviations
The endpoint security market is forecasted to grow by USD 24186.2 mn during 2024-2029, accelerating at a CAGR of 21.6% during the forecast period. The report on the endpoint security market provides a holistic analysis, market size and forecast, trends, growth drivers, and challenges, as well as vendor analysis covering around 25 vendors.
The report offers an up-to-date analysis regarding the current market scenario, the latest trends and drivers, and the overall market environment. The market is driven by increasing incidence of cyberattacks, emergence of enterprise mobility and byod policy among enterprises, and stringent regulations regarding data protection.
| Market Scope | |
|---|---|
| Base Year | 2025 |
| End Year | 2029 |
| Series Year | 2025-2029 |
| Growth Momentum | Accelerate |
| YOY 2025 | 18.4% |
| CAGR | 21.6% |
| Incremental Value | $24186.2 mn |
The study was conducted using an objective combination of primary and secondary information including inputs from key participants in the industry. The report contains a comprehensive market size data, segment with regional analysis and vendor landscape in addition to an analysis of the key companies. Reports have historic and forecast data.
Technavio's endpoint security market is segmented as below:
By Deployment
- On-premises
- Cloud-based
By End-user
- BFSI
- IT and Telecommunications
- Retail
- Healthcare
- Others
By Service
- Professional services
- Managed services
By Sector
- Large enterprises
- Small and medium-sized enterprises
By Geographical Landscape
- North America
- Europe
- APAC
- Middle East and Africa
- South America
This study identifies the strategic partnerships and acquisitions among companies as one of the prime reasons driving the endpoint security market growth during the next few years. Also, recent developments associated with endpoint security solutions and increasing adoption of cloud-based endpoint security solutions will lead to sizable demand in the market.
The report on the endpoint security market covers the following areas:
- Endpoint Security Market sizing
- Endpoint Security Market forecast
- Endpoint Security Market industry analysis
The robust vendor analysis is designed to help clients improve their market position, and in line with this, this report provides a detailed analysis of several leading endpoint security market vendors that include AO Kaspersky Lab, BlackBerry Ltd., Broadcom Inc., Check Point Software Technologies Ltd., Cisco Systems Inc., CrowdStrike Inc., ESET North America, F Secure Corp., Fortinet Inc., Malwarebytes Inc., McAfee LLC, Microsoft Corp., Musarubra US LLC, Palo Alto Networks Inc., S.C. BITDEFENDER S.R.L, Sophos Ltd., VMware Inc., and WatchGuard Technologies Inc.. Also, the endpoint security market analysis report includes information on upcoming trends and challenges that will influence market growth. This is to help companies strategize and leverage all forthcoming growth opportunities.
The publisher presents a detailed picture of the market by the way of study, synthesis, and summation of data from multiple sources by an analysis of key parameters such as profit, pricing, competition, and promotions. It presents various market facets by identifying the key industry influencers. The data presented is comprehensive, reliable, and a result of extensive primary and secondary research. The market research reports provide a complete competitive landscape and an in-depth vendor selection methodology and analysis using qualitative and quantitative research to forecast accurate market growth.
Table of Contents
1 Executive Summary
- 1.1 Market overview
- Executive Summary - Chart on Market Overview
- Executive Summary - Data Table on Market Overview
- Executive Summary - Chart on Global Market Characteristics
- Executive Summary - Chart on Market By Geographical Landscape
- Executive Summary - Chart on Market Segmentation by Deployment
- Executive Summary - Chart on Market Segmentation by End-user
- Executive Summary - Chart on Market Segmentation by Service
- Executive Summary - Chart on Market Segmentation by Sector
- Executive Summary - Chart on Incremental Growth
- Executive Summary - Data Table on Incremental Growth
- Executive Summary - Chart on Company Market Positioning
2 Technavio Analysis
- 2.1 Analysis of price sensitivity, lifecycle, customer purchase basket, adoption rates, and purchase criteria
- Analysis of price sensitivity, lifecycle, customer purchase basket, adoption rates, and purchase criteria
- 2.2 Criticality of inputs and Factors of differentiation
- Overview on criticality of inputs and factors of differentiation
- 2.3 Factors of disruption
- Overview on factors of disruption
- 2.4 Impact of drivers and challenges
- Impact of drivers and challenges in 2024 and 2029
3 Market Landscape
- 3.1 Market ecosystem
- Parent Market
- Data Table on - Parent Market
- 3.2 Market characteristics
- Market characteristics analysis
- 3.3 Value chain analysis
- Value chain analysis
4 Market Sizing
- 4.1 Market definition
- Offerings of companies included in the market definition
- 4.2 Market segment analysis
- Market segments
- 4.3 Market size 2024
- 4.4 Market outlook: Forecast for 2024-2029
- Chart on Global - Market size and forecast 2024-2029 ($ million)
- Data Table on Global - Market size and forecast 2024-2029 ($ million)
- Chart on Global Market: Year-over-year growth 2024-2029 (%)
- Data Table on Global Market: Year-over-year growth 2024-2029 (%)
5 Historic Market Size
- 5.1 Global Endpoint Security Market 2019 - 2023
- Historic Market Size - Data Table on Global Endpoint Security Market 2019 - 2023 ($ million)
- 5.2 Deployment segment analysis 2019 - 2023
- Historic Market Size - Deployment Segment 2019 - 2023 ($ million)
- 5.3 End-user segment analysis 2019 - 2023
- Historic Market Size - End-user Segment 2019 - 2023 ($ million)
- 5.4 Service segment analysis 2019 - 2023
- Historic Market Size - Service Segment 2019 - 2023 ($ million)
- 5.5 Sector segment analysis 2019 - 2023
- Historic Market Size - Sector Segment 2019 - 2023 ($ million)
- 5.6 Geography segment analysis 2019 - 2023
- Historic Market Size - Geography Segment 2019 - 2023 ($ million)
- 5.7 Country segment analysis 2019 - 2023
- Historic Market Size - Country Segment 2019 - 2023 ($ million)
6 Qualitative Analysis
- 6.1 Impact of AI on Global Endpoint Security Market
7 Five Forces Analysis
- 7.1 Five forces summary
- Five forces analysis - Comparison between 2024 and 2029
- 7.2 Bargaining power of buyers
- Bargaining power of buyers - Impact of key factors 2024 and 2029
- 7.3 Bargaining power of suppliers
- Bargaining power of suppliers - Impact of key factors in 2024 and 2029
- 7.4 Threat of new entrants
- Threat of new entrants - Impact of key factors in 2024 and 2029
- 7.5 Threat of substitutes
- Threat of substitutes - Impact of key factors in 2024 and 2029
- 7.6 Threat of rivalry
- Threat of rivalry - Impact of key factors in 2024 and 2029
- 7.7 Market condition
- Chart on Market condition - Five forces 2024 and 2029
8 Market Segmentation by Deployment
- 8.1 Market segments
- Chart on Deployment - Market share 2024-2029 (%)
- Data Table on Deployment - Market share 2024-2029 (%)
- 8.2 Comparison by Deployment
- Chart on Comparison by Deployment
- Data Table on Comparison by Deployment
- 8.3 On-premises - Market size and forecast 2024-2029
- Chart on On-premises - Market size and forecast 2024-2029 ($ million)
- Data Table on On-premises - Market size and forecast 2024-2029 ($ million)
- Chart on On-premises - Year-over-year growth 2024-2029 (%)
- Data Table on On-premises - Year-over-year growth 2024-2029 (%)
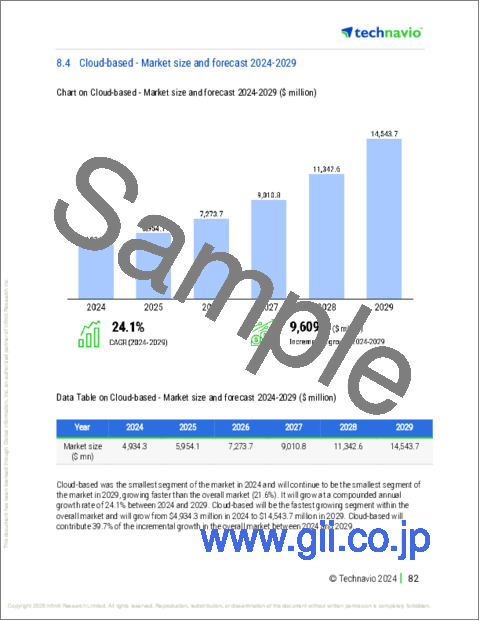
- 8.4 Cloud-based - Market size and forecast 2024-2029
- Chart on Cloud-based - Market size and forecast 2024-2029 ($ million)
- Data Table on Cloud-based - Market size and forecast 2024-2029 ($ million)
- Chart on Cloud-based - Year-over-year growth 2024-2029 (%)
- Data Table on Cloud-based - Year-over-year growth 2024-2029 (%)
- 8.5 Market opportunity by Deployment
- Market opportunity by Deployment ($ million)
- Data Table on Market opportunity by Deployment ($ million)
9 Market Segmentation by End-user
- 9.1 Market segments
- Chart on End-user - Market share 2024-2029 (%)
- Data Table on End-user - Market share 2024-2029 (%)
- 9.2 Comparison by End-user
- Chart on Comparison by End-user
- Data Table on Comparison by End-user
- 9.3 BFSI - Market size and forecast 2024-2029
- Chart on BFSI - Market size and forecast 2024-2029 ($ million)
- Data Table on BFSI - Market size and forecast 2024-2029 ($ million)
- Chart on BFSI - Year-over-year growth 2024-2029 (%)
- Data Table on BFSI - Year-over-year growth 2024-2029 (%)
- 9.4 IT and Telecommunications - Market size and forecast 2024-2029
- Chart on IT and Telecommunications - Market size and forecast 2024-2029 ($ million)
- Data Table on IT and Telecommunications - Market size and forecast 2024-2029 ($ million)
- Chart on IT and Telecommunications - Year-over-year growth 2024-2029 (%)
- Data Table on IT and Telecommunications - Year-over-year growth 2024-2029 (%)
- 9.5 Retail - Market size and forecast 2024-2029
- Chart on Retail - Market size and forecast 2024-2029 ($ million)
- Data Table on Retail - Market size and forecast 2024-2029 ($ million)
- Chart on Retail - Year-over-year growth 2024-2029 (%)
- Data Table on Retail - Year-over-year growth 2024-2029 (%)
- 9.6 Healthcare - Market size and forecast 2024-2029
- Chart on Healthcare - Market size and forecast 2024-2029 ($ million)
- Data Table on Healthcare - Market size and forecast 2024-2029 ($ million)
- Chart on Healthcare - Year-over-year growth 2024-2029 (%)
- Data Table on Healthcare - Year-over-year growth 2024-2029 (%)
- 9.7 Others - Market size and forecast 2024-2029
- Chart on Others - Market size and forecast 2024-2029 ($ million)
- Data Table on Others - Market size and forecast 2024-2029 ($ million)
- Chart on Others - Year-over-year growth 2024-2029 (%)
- Data Table on Others - Year-over-year growth 2024-2029 (%)
- 9.8 Market opportunity by End-user
- Market opportunity by End-user ($ million)
- Data Table on Market opportunity by End-user ($ million)
10 Market Segmentation by Service
- 10.1 Market segments
- Chart on Service - Market share 2024-2029 (%)
- Data Table on Service - Market share 2024-2029 (%)
- 10.2 Comparison by Service
- Chart on Comparison by Service
- Data Table on Comparison by Service
- 10.3 Professional services - Market size and forecast 2024-2029
- Chart on Professional services - Market size and forecast 2024-2029 ($ million)
- Data Table on Professional services - Market size and forecast 2024-2029 ($ million)
- Chart on Professional services - Year-over-year growth 2024-2029 (%)
- Data Table on Professional services - Year-over-year growth 2024-2029 (%)
- 10.4 Managed services - Market size and forecast 2024-2029
- Chart on Managed services - Market size and forecast 2024-2029 ($ million)
- Data Table on Managed services - Market size and forecast 2024-2029 ($ million)
- Chart on Managed services - Year-over-year growth 2024-2029 (%)
- Data Table on Managed services - Year-over-year growth 2024-2029 (%)
- 10.5 Market opportunity by Service
- Market opportunity by Service ($ million)
- Data Table on Market opportunity by Service ($ million)
11 Market Segmentation by Sector
- 11.1 Market segments
- Chart on Sector - Market share 2024-2029 (%)
- Data Table on Sector - Market share 2024-2029 (%)
- 11.2 Comparison by Sector
- Chart on Comparison by Sector
- Data Table on Comparison by Sector
- 11.3 Large enterprises - Market size and forecast 2024-2029
- Chart on Large enterprises - Market size and forecast 2024-2029 ($ million)
- Data Table on Large enterprises - Market size and forecast 2024-2029 ($ million)
- Chart on Large enterprises - Year-over-year growth 2024-2029 (%)
- Data Table on Large enterprises - Year-over-year growth 2024-2029 (%)
- 11.4 Small and medium-sized enterprises - Market size and forecast 2024-2029
- Chart on Small and medium-sized enterprises - Market size and forecast 2024-2029 ($ million)
- Data Table on Small and medium-sized enterprises - Market size and forecast 2024-2029 ($ million)
- Chart on Small and medium-sized enterprises - Year-over-year growth 2024-2029 (%)
- Data Table on Small and medium-sized enterprises - Year-over-year growth 2024-2029 (%)
- 11.5 Market opportunity by Sector
- Market opportunity by Sector ($ million)
- Data Table on Market opportunity by Sector ($ million)
12 Customer Landscape
- 12.1 Customer landscape overview
- Analysis of price sensitivity, lifecycle, customer purchase basket, adoption rates, and purchase criteria
13 Geographic Landscape
- 13.1 Geographic segmentation
- Chart on Market share By Geographical Landscape 2024-2029 (%)
- Data Table on Market share By Geographical Landscape 2024-2029 (%)
- 13.2 Geographic comparison
- Chart on Geographic comparison
- Data Table on Geographic comparison
- 13.3 North America - Market size and forecast 2024-2029
- Chart on North America - Market size and forecast 2024-2029 ($ million)
- Data Table on North America - Market size and forecast 2024-2029 ($ million)
- Chart on North America - Year-over-year growth 2024-2029 (%)
- Data Table on North America - Year-over-year growth 2024-2029 (%)
- 13.4 Europe - Market size and forecast 2024-2029
- Chart on Europe - Market size and forecast 2024-2029 ($ million)
- Data Table on Europe - Market size and forecast 2024-2029 ($ million)
- Chart on Europe - Year-over-year growth 2024-2029 (%)
- Data Table on Europe - Year-over-year growth 2024-2029 (%)
- 13.5 APAC - Market size and forecast 2024-2029
- Chart on APAC - Market size and forecast 2024-2029 ($ million)
- Data Table on APAC - Market size and forecast 2024-2029 ($ million)
- Chart on APAC - Year-over-year growth 2024-2029 (%)
- Data Table on APAC - Year-over-year growth 2024-2029 (%)
- 13.6 Middle East and Africa - Market size and forecast 2024-2029
- Chart on Middle East and Africa - Market size and forecast 2024-2029 ($ million)
- Data Table on Middle East and Africa - Market size and forecast 2024-2029 ($ million)
- Chart on Middle East and Africa - Year-over-year growth 2024-2029 (%)
- Data Table on Middle East and Africa - Year-over-year growth 2024-2029 (%)
- 13.7 South America - Market size and forecast 2024-2029
- Chart on South America - Market size and forecast 2024-2029 ($ million)
- Data Table on South America - Market size and forecast 2024-2029 ($ million)
- Chart on South America - Year-over-year growth 2024-2029 (%)
- Data Table on South America - Year-over-year growth 2024-2029 (%)
- 13.8 US - Market size and forecast 2024-2029
- Chart on US - Market size and forecast 2024-2029 ($ million)
- Data Table on US - Market size and forecast 2024-2029 ($ million)
- Chart on US - Year-over-year growth 2024-2029 (%)
- Data Table on US - Year-over-year growth 2024-2029 (%)
- 13.9 Canada - Market size and forecast 2024-2029
- Chart on Canada - Market size and forecast 2024-2029 ($ million)
- Data Table on Canada - Market size and forecast 2024-2029 ($ million)
- Chart on Canada - Year-over-year growth 2024-2029 (%)
- Data Table on Canada - Year-over-year growth 2024-2029 (%)
- 13.10 China - Market size and forecast 2024-2029
- Chart on China - Market size and forecast 2024-2029 ($ million)
- Data Table on China - Market size and forecast 2024-2029 ($ million)
- Chart on China - Year-over-year growth 2024-2029 (%)
- Data Table on China - Year-over-year growth 2024-2029 (%)
- 13.11 Mexico - Market size and forecast 2024-2029
- Chart on Mexico - Market size and forecast 2024-2029 ($ million)
- Data Table on Mexico - Market size and forecast 2024-2029 ($ million)
- Chart on Mexico - Year-over-year growth 2024-2029 (%)
- Data Table on Mexico - Year-over-year growth 2024-2029 (%)
- 13.12 Germany - Market size and forecast 2024-2029
- Chart on Germany - Market size and forecast 2024-2029 ($ million)
- Data Table on Germany - Market size and forecast 2024-2029 ($ million)
- Chart on Germany - Year-over-year growth 2024-2029 (%)
- Data Table on Germany - Year-over-year growth 2024-2029 (%)
- 13.13 UK - Market size and forecast 2024-2029
- Chart on UK - Market size and forecast 2024-2029 ($ million)
- Data Table on UK - Market size and forecast 2024-2029 ($ million)
- Chart on UK - Year-over-year growth 2024-2029 (%)
- Data Table on UK - Year-over-year growth 2024-2029 (%)
- 13.14 Russia - Market size and forecast 2024-2029
- Chart on Russia - Market size and forecast 2024-2029 ($ million)
- Data Table on Russia - Market size and forecast 2024-2029 ($ million)
- Chart on Russia - Year-over-year growth 2024-2029 (%)
- Data Table on Russia - Year-over-year growth 2024-2029 (%)
- 13.15 Saudi Arabia - Market size and forecast 2024-2029
- Chart on Saudi Arabia - Market size and forecast 2024-2029 ($ million)
- Data Table on Saudi Arabia - Market size and forecast 2024-2029 ($ million)
- Chart on Saudi Arabia - Year-over-year growth 2024-2029 (%)
- Data Table on Saudi Arabia - Year-over-year growth 2024-2029 (%)
- 13.16 Japan - Market size and forecast 2024-2029
- Chart on Japan - Market size and forecast 2024-2029 ($ million)
- Data Table on Japan - Market size and forecast 2024-2029 ($ million)
- Chart on Japan - Year-over-year growth 2024-2029 (%)
- Data Table on Japan - Year-over-year growth 2024-2029 (%)
- 13.17 France - Market size and forecast 2024-2029
- Chart on France - Market size and forecast 2024-2029 ($ million)
- Data Table on France - Market size and forecast 2024-2029 ($ million)
- Chart on France - Year-over-year growth 2024-2029 (%)
- Data Table on France - Year-over-year growth 2024-2029 (%)
- 13.18 Market opportunity By Geographical Landscape
- Market opportunity By Geographical Landscape ($ million)
- Data Tables on Market opportunity By Geographical Landscape ($ million)
14 Drivers, Challenges, and Opportunity/Restraints
- 14.1 Market drivers
- 14.2 Market challenges
- 14.3 Impact of drivers and challenges
- Impact of drivers and challenges in 2024 and 2029
- 14.4 Market opportunities/restraints
15 Competitive Landscape
- 15.1 Overview
- 15.2 Competitive Landscape
- Overview on criticality of inputs and factors of differentiation
- 15.3 Landscape disruption
- Overview on factors of disruption
- 15.4 Industry risks
- Impact of key risks on business
16 Competitive Analysis
- 16.1 Companies profiled
- Companies covered
- 16.2 Company ranking index
- Company ranking index
- 16.3 Market positioning of companies
- Matrix on companies position and classification
- 16.4 AO Kaspersky Lab
- AO Kaspersky Lab - Overview
- AO Kaspersky Lab - Product / Service
- AO Kaspersky Lab - Key offerings
- SWOT
- 16.5 BlackBerry Ltd.
- BlackBerry Ltd. - Overview
- BlackBerry Ltd. - Business segments
- BlackBerry Ltd. - Key news
- BlackBerry Ltd. - Key offerings
- BlackBerry Ltd. - Segment focus
- SWOT
- 16.6 Broadcom Inc.
- Broadcom Inc. - Overview
- Broadcom Inc. - Business segments
- Broadcom Inc. - Key news
- Broadcom Inc. - Key offerings
- Broadcom Inc. - Segment focus
- SWOT
- 16.7 Check Point Software Technologies Ltd.
- Check Point Software Technologies Ltd. - Overview
- Check Point Software Technologies Ltd. - Product / Service
- Check Point Software Technologies Ltd. - Key news
- Check Point Software Technologies Ltd. - Key offerings
- SWOT
- 16.8 Cisco Systems Inc.
- Cisco Systems Inc. - Overview
- Cisco Systems Inc. - Business segments
- Cisco Systems Inc. - Key news
- Cisco Systems Inc. - Key offerings
- Cisco Systems Inc. - Segment focus
- SWOT
- 16.9 CrowdStrike Inc.
- CrowdStrike Inc. - Overview
- CrowdStrike Inc. - Product / Service
- CrowdStrike Inc. - Key offerings
- SWOT
- 16.10 ESET North America
- ESET North America - Overview
- ESET North America - Product / Service
- ESET North America - Key offerings
- SWOT
- 16.11 F Secure Corp.
- F Secure Corp. - Overview
- F Secure Corp. - Product / Service
- F Secure Corp. - Key offerings
- SWOT
- 16.12 Fortinet Inc.
- Fortinet Inc. - Overview
- Fortinet Inc. - Product / Service
- Fortinet Inc. - Key news
- Fortinet Inc. - Key offerings
- SWOT
- 16.13 McAfee LLC
- McAfee LLC - Overview
- McAfee LLC - Product / Service
- McAfee LLC - Key offerings
- SWOT
- 16.14 Microsoft Corp.
- Microsoft Corp. - Overview
- Microsoft Corp. - Business segments
- Microsoft Corp. - Key news
- Microsoft Corp. - Key offerings
- Microsoft Corp. - Segment focus
- SWOT
- 16.15 Musarubra US LLC
- Musarubra US LLC - Overview
- Musarubra US LLC - Product / Service
- Musarubra US LLC - Key news
- Musarubra US LLC - Key offerings
- SWOT
- 16.16 Palo Alto Networks Inc.
- Palo Alto Networks Inc. - Overview
- Palo Alto Networks Inc. - Product / Service
- Palo Alto Networks Inc. - Key news
- Palo Alto Networks Inc. - Key offerings
- SWOT
- 16.17 S.C. BITDEFENDER S.R.L
- S.C. BITDEFENDER S.R.L - Overview
- S.C. BITDEFENDER S.R.L - Product / Service
- S.C. BITDEFENDER S.R.L - Key offerings
- SWOT
- 16.18 WatchGuard Technologies Inc.
- WatchGuard Technologies Inc. - Overview
- WatchGuard Technologies Inc. - Product / Service
- WatchGuard Technologies Inc. - Key offerings
- SWOT
17 Appendix
- 17.1 Scope of the report
- 17.2 Inclusions and exclusions checklist
- Inclusions checklist
- Exclusions checklist
- 17.3 Currency conversion rates for US$
- Currency conversion rates for US$
- 17.4 Research methodology
- Research methodology
- 17.5 Data procurement
- Information sources
- 17.6 Data validation
- Data validation
- 17.7 Validation techniques employed for market sizing
- Validation techniques employed for market sizing
- 17.8 Data synthesis
- Data synthesis
- 17.9 360 degree market analysis
- 360 degree market analysis
- 17.10 List of abbreviations
- List of abbreviations

