|
|
市場調査レポート
商品コード
1558602
プロセス産業における監視制御とデータ収集の世界市場、2024~2028年Global Supervisory Control and Data Acquisition Market in Process Industries 2024-2028 |
||||||

|
|||||||
カスタマイズ可能
|
|||||||


| プロセス産業における監視制御とデータ収集の世界市場、2024~2028年 |
|
出版日: 2024年08月19日
発行: TechNavio
ページ情報: 英文 174 Pages
納期: 即納可能
|

全表示
- 概要
- 図表
- 目次
プロセス産業における監視制御とデータ収集の世界市場、2024~202年
プロセス産業における監視制御とデータ収集市場は、2023~2028年に38億3,580万米ドル、予測期間中のCAGRは9.45%で成長すると予測されます。当レポートでは、プロセス産業における監視制御とデータ収集市場について、市場規模や予測、動向、成長促進要因、さらに約25のベンダーを網羅したベンダー分析など、総合的な分析を提供しています。
現在の市場シナリオ、最新動向と促進要因、市場環境全体に関する最新分析を提供しています。市場を牽引しているのは、金属・鉱業・鉱物産業におけるエネルギー損失削減の必要性、プロセス産業における機器の監視・可視化・制御の需要拡大、プロセス産業におけるモバイルScadaシステムの採用拡大などがあります。
| 市場範囲 | |
|---|---|
| 基準年 | 2024年 |
| 終了年 | 2028年 |
| 予測期間 | 2024~2028年 |
| 成長モメンタム | 加速 |
| 前年比[2024年] | 8.42% |
| CAGR | 9.45% |
| 増分額 | 38億3,580万米ドル |
本調査では、クラウドベースのscadaシステムに対する需要の高まりが、今後数年間のプロセス産業における監視制御とデータ収集市場の成長を促進する主要な理由の1つであると特定しています。また、オープンソースscadaの人気の高まりとビッグデータ分析の増加は、市場の大きな需要につながります。
目次
第1章 エグゼクティブサマリー
- 市場概要
第2章 市場情勢
- 市場エコシステム
- 市場の特徴
- バリューチェーン分析
第3章 市場規模の評価
- 市場の定義
- 市場セグメント分析
- 市場規模 2023年
- 市場の展望 2023~2028年
第4章 市場規模実績
- プロセス産業における監視制御とデータ収集の世界市場 2018~2022年
- エンドユーザー別セグメント分析 2018~2022年
- コンポーネント別セグメント分析 2018~2022年
- 地域別セグメント分析 2018~2022年
- 国別セグメント分析 2018~2022年
第5章 ファイブフォース分析
- ファイブフォースの要約
- 買い手の交渉力
- 供給企業の交渉力
- 新規参入業者の脅威
- 代替品の脅威
- 競争の脅威
- 市況
第6章 市場セグメンテーション:エンドユーザー別
- 市場セグメンテーション
- 比較:エンドユーザー別
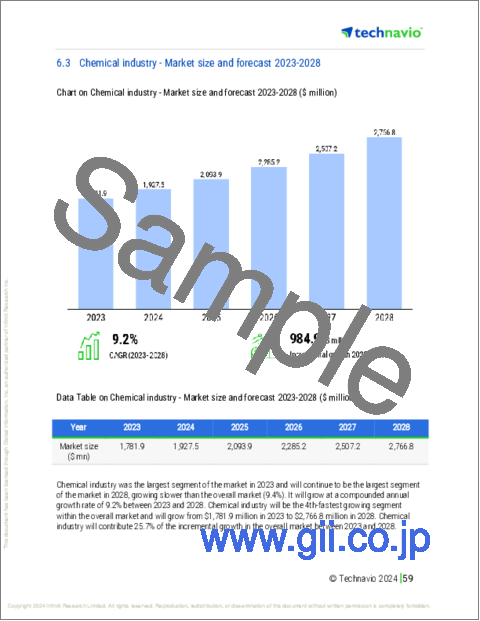
- 化学産業:市場規模と予測 2023~2028年
- 石油・ガス産業:市場規模と予測 2023~2028年
- 飲食品産業:市場規模と予測 2023~2028年
- 製薬産業:市場規模と予測 2023~2028年
- その他:市場規模と予測 2023~2028年
- 市場機会:エンドユーザー別
第7章 市場セグメンテーション:コンポーネント別
- 市場セグメンテーション
- 比較:コンポーネント別
- ソリューション:市場規模と予測 2023~2028年
- サービス:市場規模と予測 2023~2028年
- 市場機会:コンポーネント別
第8章 顧客情勢
- 顧客情勢概要
第9章 地域別情勢
- 地域別セグメンテーション
- 比較:地域別
- アジア太平洋:市場規模と予測 2023~2028年
- 北米:市場規模と予測 2023~2028年
- 欧州:市場規模と予測 2023~2028年
- 中東・アフリカ:市場規模と予測 2023~2028年
- 南米:市場規模と予測 2023~2028年
- 米国:市場規模と予測 2023~2028年
- 中国:市場規模と予測 2023~2028年
- 日本:市場規模と予測 2023~2028年
- ドイツ:市場規模と予測 2023~2028年
- フランス:市場規模と予測 2023~2028年
- 市場機会:地域情勢別
第10章 促進要因・課題・機会・抑制要因
- 市場促進要因
- 市場課題
- 促進要因と課題の影響
- 市場の機会・抑制要因
第11章 競合情勢
- 概要
- 競合情勢
- 混乱の状況
- 業界のリスク
第12章 競合分析
- 企業プロファイル
- 企業の市場ポジショニング
- ABB Ltd.
- ALSTOM SA
- eLynx Technologies LLC
- Emerson Electric Co.
- General Electric Co.
- GlobaLogix
- Honeywell International Inc.
- Indi.An GmbH
- JFE Holdings Inc.
- Mitsubishi Electric Corp.
- OMRON Corp.
- Rockwell Automation Inc.
- Schneider Electric SE
- Siemens AG
- Yokogawa Electric Corp.
第13章 付録
Exhibits:
- Exhibits1: Executive Summary - Chart on Market Overview
- Exhibits2: Executive Summary - Data Table on Market Overview
- Exhibits3: Executive Summary - Chart on Global Market Characteristics
- Exhibits4: Executive Summary - Chart on Market By Geographical Landscape
- Exhibits5: Executive Summary - Chart on Market Segmentation by End-user
- Exhibits6: Executive Summary - Chart on Market Segmentation by Component
- Exhibits7: Executive Summary - Chart on Incremental Growth
- Exhibits8: Executive Summary - Data Table on Incremental Growth
- Exhibits9: Executive Summary - Chart on Company Market Positioning
- Exhibits10: Parent Market
- Exhibits11: Data Table on - Parent Market
- Exhibits12: Market characteristics analysis
- Exhibits13: Value Chain Analysis
- Exhibits14: Offerings of companies included in the market definition
- Exhibits15: Market segments
- Exhibits16: Chart on Global - Market size and forecast 2023-2028 ($ million)
- Exhibits17: Data Table on Global - Market size and forecast 2023-2028 ($ million)
- Exhibits18: Chart on Global Market: Year-over-year growth 2023-2028 (%)
- Exhibits19: Data Table on Global Market: Year-over-year growth 2023-2028 (%)
- Exhibits20: Historic Market Size - Data Table on Global Supervisory Control And Data Acquisition Market In Process Industries 2018 - 2022 ($ million)
- Exhibits21: Historic Market Size - End-user Segment 2018 - 2022 ($ million)
- Exhibits22: Historic Market Size - Component Segment 2018 - 2022 ($ million)
- Exhibits23: Historic Market Size - Geography Segment 2018 - 2022 ($ million)
- Exhibits24: Historic Market Size - Country Segment 2018 - 2022 ($ million)
- Exhibits25: Five forces analysis - Comparison between 2023 and 2028
- Exhibits26: Bargaining power of buyers - Impact of key factors 2023 and 2028
- Exhibits27: Bargaining power of suppliers - Impact of key factors in 2023 and 2028
- Exhibits28: Threat of new entrants - Impact of key factors in 2023 and 2028
- Exhibits29: Threat of substitutes - Impact of key factors in 2023 and 2028
- Exhibits30: Threat of rivalry - Impact of key factors in 2023 and 2028
- Exhibits31: Chart on Market condition - Five forces 2023 and 2028
- Exhibits32: Chart on End-user - Market share 2023-2028 (%)
- Exhibits33: Data Table on End-user - Market share 2023-2028 (%)
- Exhibits34: Chart on Comparison by End-user
- Exhibits35: Data Table on Comparison by End-user
- Exhibits36: Chart on Chemical industry - Market size and forecast 2023-2028 ($ million)
- Exhibits37: Data Table on Chemical industry - Market size and forecast 2023-2028 ($ million)
- Exhibits38: Chart on Chemical industry - Year-over-year growth 2023-2028 (%)
- Exhibits39: Data Table on Chemical industry - Year-over-year growth 2023-2028 (%)
- Exhibits40: Chart on Oil and gas industry - Market size and forecast 2023-2028 ($ million)
- Exhibits41: Data Table on Oil and gas industry - Market size and forecast 2023-2028 ($ million)
- Exhibits42: Chart on Oil and gas industry - Year-over-year growth 2023-2028 (%)
- Exhibits43: Data Table on Oil and gas industry - Year-over-year growth 2023-2028 (%)
- Exhibits44: Chart on Food and beverage industry - Market size and forecast 2023-2028 ($ million)
- Exhibits45: Data Table on Food and beverage industry - Market size and forecast 2023-2028 ($ million)
- Exhibits46: Chart on Food and beverage industry - Year-over-year growth 2023-2028 (%)
- Exhibits47: Data Table on Food and beverage industry - Year-over-year growth 2023-2028 (%)
- Exhibits48: Chart on Pharmaceutical industry - Market size and forecast 2023-2028 ($ million)
- Exhibits49: Data Table on Pharmaceutical industry - Market size and forecast 2023-2028 ($ million)
- Exhibits50: Chart on Pharmaceutical industry - Year-over-year growth 2023-2028 (%)
- Exhibits51: Data Table on Pharmaceutical industry - Year-over-year growth 2023-2028 (%)
- Exhibits52: Chart on Others - Market size and forecast 2023-2028 ($ million)
- Exhibits53: Data Table on Others - Market size and forecast 2023-2028 ($ million)
- Exhibits54: Chart on Others - Year-over-year growth 2023-2028 (%)
- Exhibits55: Data Table on Others - Year-over-year growth 2023-2028 (%)
- Exhibits56: Market opportunity by End-user ($ million)
- Exhibits57: Data Table on Market opportunity by End-user ($ million)
- Exhibits58: Chart on Component - Market share 2023-2028 (%)
- Exhibits59: Data Table on Component - Market share 2023-2028 (%)
- Exhibits60: Chart on Comparison by Component
- Exhibits61: Data Table on Comparison by Component
- Exhibits62: Chart on Solution - Market size and forecast 2023-2028 ($ million)
- Exhibits63: Data Table on Solution - Market size and forecast 2023-2028 ($ million)
- Exhibits64: Chart on Solution - Year-over-year growth 2023-2028 (%)
- Exhibits65: Data Table on Solution - Year-over-year growth 2023-2028 (%)
- Exhibits66: Chart on Services - Market size and forecast 2023-2028 ($ million)
- Exhibits67: Data Table on Services - Market size and forecast 2023-2028 ($ million)
- Exhibits68: Chart on Services - Year-over-year growth 2023-2028 (%)
- Exhibits69: Data Table on Services - Year-over-year growth 2023-2028 (%)
- Exhibits70: Market opportunity by Component ($ million)
- Exhibits71: Data Table on Market opportunity by Component ($ million)
- Exhibits72: Analysis of price sensitivity, lifecycle, customer purchase basket, adoption rates, and purchase criteria
- Exhibits73: Chart on Market share By Geographical Landscape 2023-2028 (%)
- Exhibits74: Data Table on Market share By Geographical Landscape 2023-2028 (%)
- Exhibits75: Chart on Geographic comparison
- Exhibits76: Data Table on Geographic comparison
- Exhibits77: Chart on APAC - Market size and forecast 2023-2028 ($ million)
- Exhibits78: Data Table on APAC - Market size and forecast 2023-2028 ($ million)
- Exhibits79: Chart on APAC - Year-over-year growth 2023-2028 (%)
- Exhibits80: Data Table on APAC - Year-over-year growth 2023-2028 (%)
- Exhibits81: Chart on North America - Market size and forecast 2023-2028 ($ million)
- Exhibits82: Data Table on North America - Market size and forecast 2023-2028 ($ million)
- Exhibits83: Chart on North America - Year-over-year growth 2023-2028 (%)
- Exhibits84: Data Table on North America - Year-over-year growth 2023-2028 (%)
- Exhibits85: Chart on Europe - Market size and forecast 2023-2028 ($ million)
- Exhibits86: Data Table on Europe - Market size and forecast 2023-2028 ($ million)
- Exhibits87: Chart on Europe - Year-over-year growth 2023-2028 (%)
- Exhibits88: Data Table on Europe - Year-over-year growth 2023-2028 (%)
- Exhibits89: Chart on Middle East and Africa - Market size and forecast 2023-2028 ($ million)
- Exhibits90: Data Table on Middle East and Africa - Market size and forecast 2023-2028 ($ million)
- Exhibits91: Chart on Middle East and Africa - Year-over-year growth 2023-2028 (%)
- Exhibits92: Data Table on Middle East and Africa - Year-over-year growth 2023-2028 (%)
- Exhibits93: Chart on South America - Market size and forecast 2023-2028 ($ million)
- Exhibits94: Data Table on South America - Market size and forecast 2023-2028 ($ million)
- Exhibits95: Chart on South America - Year-over-year growth 2023-2028 (%)
- Exhibits96: Data Table on South America - Year-over-year growth 2023-2028 (%)
- Exhibits97: Chart on US - Market size and forecast 2023-2028 ($ million)
- Exhibits98: Data Table on US - Market size and forecast 2023-2028 ($ million)
- Exhibits99: Chart on US - Year-over-year growth 2023-2028 (%)
- Exhibits100: Data Table on US - Year-over-year growth 2023-2028 (%)
- Exhibits101: Chart on China - Market size and forecast 2023-2028 ($ million)
- Exhibits102: Data Table on China - Market size and forecast 2023-2028 ($ million)
- Exhibits103: Chart on China - Year-over-year growth 2023-2028 (%)
- Exhibits104: Data Table on China - Year-over-year growth 2023-2028 (%)
- Exhibits105: Chart on Japan - Market size and forecast 2023-2028 ($ million)
- Exhibits106: Data Table on Japan - Market size and forecast 2023-2028 ($ million)
- Exhibits107: Chart on Japan - Year-over-year growth 2023-2028 (%)
- Exhibits108: Data Table on Japan - Year-over-year growth 2023-2028 (%)
- Exhibits109: Chart on Germany - Market size and forecast 2023-2028 ($ million)
- Exhibits110: Data Table on Germany - Market size and forecast 2023-2028 ($ million)
- Exhibits111: Chart on Germany - Year-over-year growth 2023-2028 (%)
- Exhibits112: Data Table on Germany - Year-over-year growth 2023-2028 (%)
- Exhibits113: Chart on France - Market size and forecast 2023-2028 ($ million)
- Exhibits114: Data Table on France - Market size and forecast 2023-2028 ($ million)
- Exhibits115: Chart on France - Year-over-year growth 2023-2028 (%)
- Exhibits116: Data Table on France - Year-over-year growth 2023-2028 (%)
- Exhibits117: Market opportunity By Geographical Landscape ($ million)
- Exhibits118: Data Tables on Market opportunity By Geographical Landscape ($ million)
- Exhibits119: Impact of drivers and challenges in 2023 and 2028
- Exhibits120: Overview on criticality of inputs and factors of differentiation
- Exhibits121: Overview on factors of disruption
- Exhibits122: Impact of key risks on business
- Exhibits123: Companies covered
- Exhibits124: Matrix on companies position and classification
- Exhibits125: ABB Ltd. - Overview
- Exhibits126: ABB Ltd. - Business segments
- Exhibits127: ABB Ltd. - Key news
- Exhibits128: ABB Ltd. - Key offerings
- Exhibits129: ABB Ltd. - Segment focus
- Exhibits130: ALSTOM SA - Overview
- Exhibits131: ALSTOM SA - Business segments
- Exhibits132: ALSTOM SA - Key news
- Exhibits133: ALSTOM SA - Key offerings
- Exhibits134: ALSTOM SA - Segment focus
- Exhibits135: eLynx Technologies LLC - Overview
- Exhibits136: eLynx Technologies LLC - Product / Service
- Exhibits137: eLynx Technologies LLC - Key offerings
- Exhibits138: Emerson Electric Co. - Overview
- Exhibits139: Emerson Electric Co. - Business segments
- Exhibits140: Emerson Electric Co. - Key news
- Exhibits141: Emerson Electric Co. - Key offerings
- Exhibits142: Emerson Electric Co. - Segment focus
- Exhibits143: General Electric Co. - Overview
- Exhibits144: General Electric Co. - Business segments
- Exhibits145: General Electric Co. - Key news
- Exhibits146: General Electric Co. - Key offerings
- Exhibits147: General Electric Co. - Segment focus
- Exhibits148: GlobaLogix - Overview
- Exhibits149: GlobaLogix - Product / Service
- Exhibits150: GlobaLogix - Key offerings
- Exhibits151: Honeywell International Inc. - Overview
- Exhibits152: Honeywell International Inc. - Business segments
- Exhibits153: Honeywell International Inc. - Key news
- Exhibits154: Honeywell International Inc. - Key offerings
- Exhibits155: Honeywell International Inc. - Segment focus
- Exhibits156: Indi.An GmbH - Overview
- Exhibits157: Indi.An GmbH - Product / Service
- Exhibits158: Indi.An GmbH - Key offerings
- Exhibits159: JFE Holdings Inc. - Overview
- Exhibits160: JFE Holdings Inc. - Business segments
- Exhibits161: JFE Holdings Inc. - Key news
- Exhibits162: JFE Holdings Inc. - Key offerings
- Exhibits163: JFE Holdings Inc. - Segment focus
- Exhibits164: Mitsubishi Electric Corp. - Overview
- Exhibits165: Mitsubishi Electric Corp. - Business segments
- Exhibits166: Mitsubishi Electric Corp. - Key news
- Exhibits167: Mitsubishi Electric Corp. - Key offerings
- Exhibits168: Mitsubishi Electric Corp. - Segment focus
- Exhibits169: OMRON Corp. - Overview
- Exhibits170: OMRON Corp. - Business segments
- Exhibits171: OMRON Corp. - Key news
- Exhibits172: OMRON Corp. - Key offerings
- Exhibits173: OMRON Corp. - Segment focus
- Exhibits174: Rockwell Automation Inc. - Overview
- Exhibits175: Rockwell Automation Inc. - Business segments
- Exhibits176: Rockwell Automation Inc. - Key news
- Exhibits177: Rockwell Automation Inc. - Key offerings
- Exhibits178: Rockwell Automation Inc. - Segment focus
- Exhibits179: Schneider Electric SE - Overview
- Exhibits180: Schneider Electric SE - Business segments
- Exhibits181: Schneider Electric SE - Key news
- Exhibits182: Schneider Electric SE - Key offerings
- Exhibits183: Schneider Electric SE - Segment focus
- Exhibits184: Siemens AG - Overview
- Exhibits185: Siemens AG - Business segments
- Exhibits186: Siemens AG - Key news
- Exhibits187: Siemens AG - Key offerings
- Exhibits188: Siemens AG - Segment focus
- Exhibits189: Yokogawa Electric Corp. - Overview
- Exhibits190: Yokogawa Electric Corp. - Business segments
- Exhibits191: Yokogawa Electric Corp. - Key news
- Exhibits192: Yokogawa Electric Corp. - Key offerings
- Exhibits193: Yokogawa Electric Corp. - Segment focus
- Exhibits194: Inclusions checklist
- Exhibits195: Exclusions checklist
- Exhibits196: Currency conversion rates for US$
- Exhibits197: Research methodology
- Exhibits198: Information sources
- Exhibits199: Data validation
- Exhibits200: Validation techniques employed for market sizing
- Exhibits201: Data synthesis
- Exhibits202: 360 degree market analysis
- Exhibits203: List of abbreviations
Global Supervisory Control And Data Acquisition In Process Industries Market 2024-2028
The supervisory control and data acquisition in process industries market is forecasted to grow by USD 3835.8 mn during 2023-2028, accelerating at a CAGR of 9.45% during the forecast period. The report on the supervisory control and data acquisition in process industries market provides a holistic analysis, market size and forecast, trends, growth drivers, and challenges, as well as vendor analysis covering around 25 vendors.
The report offers an up-to-date analysis regarding the current market scenario, the latest trends and drivers, and the overall market environment. The market is driven by need to reduce energy losses in metal, mining, and mineral industries, growing demand for monitoring, visualizing, and controlling equipment in process industries, and increasing adoption of mobile scada systems in process industries.
| Market Scope | |
|---|---|
| Base Year | 2024 |
| End Year | 2028 |
| Series Year | 2024-2028 |
| Growth Momentum | Accelerate |
| YOY 2024 | 8.42% |
| CAGR | 9.45% |
| Incremental Value | $3835.8 mn |
Technavio's supervisory control and data acquisition in process industries market is segmented as below:
By End-user
- Chemical industry
- Oil and gas industry
- Food and beverage industry
- Pharmaceutical industry
- Others
By Component
- Solution
- Services
By Geographical Landscape
- APAC
- North America
- Europe
- Middle East and Africa
- South America
This study identifies the growing demand for cloud-based scada systems as one of the prime reasons driving the supervisory control and data acquisition in process industries market growth during the next few years. Also, growing popularity of open-source scada and rise in big data analytics will lead to sizable demand in the market.
The report on the supervisory control and data acquisition in process industries market covers the following areas:
- Supervisory control and data acquisition in process industries market sizing
- Supervisory control and data acquisition in process industries market forecast
- Supervisory control and data acquisition in process industries market industry analysis
The robust vendor analysis is designed to help clients improve their market position, and in line with this, this report provides a detailed analysis of several leading supervisory control and data acquisition in process industries market vendors that include ABB Ltd., ALSTOM SA, ANSYS Inc., Cogent Communications Holdings Inc., eLynx Technologies LLC, Emerson Electric Co., General Electric Co., GlobaLogix, HACI OMER SABANCI HOLDING A.S., Honeywell International Inc., Indi.An GmbH, Inductive Automation LLC, JFE Holdings Inc., Mitsubishi Electric Corp., OMRON Corp., Rockwell Automation Inc., Schneider Electric SE, Siemens AG, and Yokogawa Electric Corp.. Also, the supervisory control and data acquisition in process industries market analysis report includes information on upcoming trends and challenges that will influence market growth. This is to help companies strategize and leverage all forthcoming growth opportunities.
The study was conducted using an objective combination of primary and secondary information including inputs from key participants in the industry. The report contains a comprehensive market and vendor landscape in addition to an analysis of the key vendors.
The publisher presents a detailed picture of the market by the way of study, synthesis, and summation of data from multiple sources by an analysis of key parameters such as profit, pricing, competition, and promotions. It presents various market facets by identifying the key industry influencers. The data presented is comprehensive, reliable, and a result of extensive research - both primary and secondary. The market research reports provide a complete competitive landscape and an in-depth vendor selection methodology and analysis using qualitative and quantitative research to forecast the accurate market growth.
Table of Contents
1 Executive Summary
- 1.1 Market overview
- Executive Summary - Chart on Market Overview
- Executive Summary - Data Table on Market Overview
- Executive Summary - Chart on Global Market Characteristics
- Executive Summary - Chart on Market By Geographical Landscape
- Executive Summary - Chart on Market Segmentation by End-user
- Executive Summary - Chart on Market Segmentation by Component
- Executive Summary - Chart on Incremental Growth
- Executive Summary - Data Table on Incremental Growth
- Executive Summary - Chart on Company Market Positioning
2 Market Landscape
- 2.1 Market ecosystem
- Parent Market
- Data Table on - Parent Market
- 2.2 Market characteristics
- Market characteristics analysis
- 2.3 Value chain analysis
- Value Chain Analysis
3 Market Sizing
- 3.1 Market definition
- Offerings of companies included in the market definition
- 3.2 Market segment analysis
- Market segments
- 3.3 Market size 2023
- 3.4 Market outlook: Forecast for 2023-2028
- Chart on Global - Market size and forecast 2023-2028 ($ million)
- Data Table on Global - Market size and forecast 2023-2028 ($ million)
- Chart on Global Market: Year-over-year growth 2023-2028 (%)
- Data Table on Global Market: Year-over-year growth 2023-2028 (%)
4 Historic Market Size
- 4.1 Global Supervisory Control And Data Acquisition Market In Process Industries 2018 - 2022
- Historic Market Size - Data Table on Global Supervisory Control And Data Acquisition Market In Process Industries 2018 - 2022 ($ million)
- 4.2 End-user segment analysis 2018 - 2022
- Historic Market Size - End-user Segment 2018 - 2022 ($ million)
- 4.3 Component segment analysis 2018 - 2022
- Historic Market Size - Component Segment 2018 - 2022 ($ million)
- 4.4 Geography segment analysis 2018 - 2022
- Historic Market Size - Geography Segment 2018 - 2022 ($ million)
- 4.5 Country segment analysis 2018 - 2022
- Historic Market Size - Country Segment 2018 - 2022 ($ million)
5 Five Forces Analysis
- 5.1 Five forces summary
- Five forces analysis - Comparison between 2023 and 2028
- 5.2 Bargaining power of buyers
- Bargaining power of buyers - Impact of key factors 2023 and 2028
- 5.3 Bargaining power of suppliers
- Bargaining power of suppliers - Impact of key factors in 2023 and 2028
- 5.4 Threat of new entrants
- Threat of new entrants - Impact of key factors in 2023 and 2028
- 5.5 Threat of substitutes
- Threat of substitutes - Impact of key factors in 2023 and 2028
- 5.6 Threat of rivalry
- Threat of rivalry - Impact of key factors in 2023 and 2028
- 5.7 Market condition
- Chart on Market condition - Five forces 2023 and 2028
6 Market Segmentation by End-user
- 6.1 Market segments
- Chart on End-user - Market share 2023-2028 (%)
- Data Table on End-user - Market share 2023-2028 (%)
- 6.2 Comparison by End-user
- Chart on Comparison by End-user
- Data Table on Comparison by End-user
- 6.3 Chemical industry - Market size and forecast 2023-2028
- Chart on Chemical industry - Market size and forecast 2023-2028 ($ million)
- Data Table on Chemical industry - Market size and forecast 2023-2028 ($ million)
- Chart on Chemical industry - Year-over-year growth 2023-2028 (%)
- Data Table on Chemical industry - Year-over-year growth 2023-2028 (%)
- 6.4 Oil and gas industry - Market size and forecast 2023-2028
- Chart on Oil and gas industry - Market size and forecast 2023-2028 ($ million)
- Data Table on Oil and gas industry - Market size and forecast 2023-2028 ($ million)
- Chart on Oil and gas industry - Year-over-year growth 2023-2028 (%)
- Data Table on Oil and gas industry - Year-over-year growth 2023-2028 (%)
- 6.5 Food and beverage industry - Market size and forecast 2023-2028
- Chart on Food and beverage industry - Market size and forecast 2023-2028 ($ million)
- Data Table on Food and beverage industry - Market size and forecast 2023-2028 ($ million)
- Chart on Food and beverage industry - Year-over-year growth 2023-2028 (%)
- Data Table on Food and beverage industry - Year-over-year growth 2023-2028 (%)
- 6.6 Pharmaceutical industry - Market size and forecast 2023-2028
- Chart on Pharmaceutical industry - Market size and forecast 2023-2028 ($ million)
- Data Table on Pharmaceutical industry - Market size and forecast 2023-2028 ($ million)
- Chart on Pharmaceutical industry - Year-over-year growth 2023-2028 (%)
- Data Table on Pharmaceutical industry - Year-over-year growth 2023-2028 (%)
- 6.7 Others - Market size and forecast 2023-2028
- Chart on Others - Market size and forecast 2023-2028 ($ million)
- Data Table on Others - Market size and forecast 2023-2028 ($ million)
- Chart on Others - Year-over-year growth 2023-2028 (%)
- Data Table on Others - Year-over-year growth 2023-2028 (%)
- 6.8 Market opportunity by End-user
- Market opportunity by End-user ($ million)
- Data Table on Market opportunity by End-user ($ million)
7 Market Segmentation by Component
- 7.1 Market segments
- Chart on Component - Market share 2023-2028 (%)
- Data Table on Component - Market share 2023-2028 (%)
- 7.2 Comparison by Component
- Chart on Comparison by Component
- Data Table on Comparison by Component
- 7.3 Solution - Market size and forecast 2023-2028
- Chart on Solution - Market size and forecast 2023-2028 ($ million)
- Data Table on Solution - Market size and forecast 2023-2028 ($ million)
- Chart on Solution - Year-over-year growth 2023-2028 (%)
- Data Table on Solution - Year-over-year growth 2023-2028 (%)
- 7.4 Services - Market size and forecast 2023-2028
- Chart on Services - Market size and forecast 2023-2028 ($ million)
- Data Table on Services - Market size and forecast 2023-2028 ($ million)
- Chart on Services - Year-over-year growth 2023-2028 (%)
- Data Table on Services - Year-over-year growth 2023-2028 (%)
- 7.5 Market opportunity by Component
- Market opportunity by Component ($ million)
- Data Table on Market opportunity by Component ($ million)
8 Customer Landscape
- 8.1 Customer landscape overview
- Analysis of price sensitivity, lifecycle, customer purchase basket, adoption rates, and purchase criteria
9 Geographic Landscape
- 9.1 Geographic segmentation
- Chart on Market share By Geographical Landscape 2023-2028 (%)
- Data Table on Market share By Geographical Landscape 2023-2028 (%)
- 9.2 Geographic comparison
- Chart on Geographic comparison
- Data Table on Geographic comparison
- 9.3 APAC - Market size and forecast 2023-2028
- Chart on APAC - Market size and forecast 2023-2028 ($ million)
- Data Table on APAC - Market size and forecast 2023-2028 ($ million)
- Chart on APAC - Year-over-year growth 2023-2028 (%)
- Data Table on APAC - Year-over-year growth 2023-2028 (%)
- 9.4 North America - Market size and forecast 2023-2028
- Chart on North America - Market size and forecast 2023-2028 ($ million)
- Data Table on North America - Market size and forecast 2023-2028 ($ million)
- Chart on North America - Year-over-year growth 2023-2028 (%)
- Data Table on North America - Year-over-year growth 2023-2028 (%)
- 9.5 Europe - Market size and forecast 2023-2028
- Chart on Europe - Market size and forecast 2023-2028 ($ million)
- Data Table on Europe - Market size and forecast 2023-2028 ($ million)
- Chart on Europe - Year-over-year growth 2023-2028 (%)
- Data Table on Europe - Year-over-year growth 2023-2028 (%)
- 9.6 Middle East and Africa - Market size and forecast 2023-2028
- Chart on Middle East and Africa - Market size and forecast 2023-2028 ($ million)
- Data Table on Middle East and Africa - Market size and forecast 2023-2028 ($ million)
- Chart on Middle East and Africa - Year-over-year growth 2023-2028 (%)
- Data Table on Middle East and Africa - Year-over-year growth 2023-2028 (%)
- 9.7 South America - Market size and forecast 2023-2028
- Chart on South America - Market size and forecast 2023-2028 ($ million)
- Data Table on South America - Market size and forecast 2023-2028 ($ million)
- Chart on South America - Year-over-year growth 2023-2028 (%)
- Data Table on South America - Year-over-year growth 2023-2028 (%)
- 9.8 US - Market size and forecast 2023-2028
- Chart on US - Market size and forecast 2023-2028 ($ million)
- Data Table on US - Market size and forecast 2023-2028 ($ million)
- Chart on US - Year-over-year growth 2023-2028 (%)
- Data Table on US - Year-over-year growth 2023-2028 (%)
- 9.9 China - Market size and forecast 2023-2028
- Chart on China - Market size and forecast 2023-2028 ($ million)
- Data Table on China - Market size and forecast 2023-2028 ($ million)
- Chart on China - Year-over-year growth 2023-2028 (%)
- Data Table on China - Year-over-year growth 2023-2028 (%)
- 9.10 Japan - Market size and forecast 2023-2028
- Chart on Japan - Market size and forecast 2023-2028 ($ million)
- Data Table on Japan - Market size and forecast 2023-2028 ($ million)
- Chart on Japan - Year-over-year growth 2023-2028 (%)
- Data Table on Japan - Year-over-year growth 2023-2028 (%)
- 9.11 Germany - Market size and forecast 2023-2028
- Chart on Germany - Market size and forecast 2023-2028 ($ million)
- Data Table on Germany - Market size and forecast 2023-2028 ($ million)
- Chart on Germany - Year-over-year growth 2023-2028 (%)
- Data Table on Germany - Year-over-year growth 2023-2028 (%)
- 9.12 France - Market size and forecast 2023-2028
- Chart on France - Market size and forecast 2023-2028 ($ million)
- Data Table on France - Market size and forecast 2023-2028 ($ million)
- Chart on France - Year-over-year growth 2023-2028 (%)
- Data Table on France - Year-over-year growth 2023-2028 (%)
- 9.13 Market opportunity By Geographical Landscape
- Market opportunity By Geographical Landscape ($ million)
- Data Tables on Market opportunity By Geographical Landscape ($ million)
10 Drivers, Challenges, and Opportunity/Restraints
- 10.1 Market drivers
- 10.2 Market challenges
- 10.3 Impact of drivers and challenges
- Impact of drivers and challenges in 2023 and 2028
- 10.4 Market opportunities/restraints
11 Competitive Landscape
- 11.1 Overview
- 11.2 Competitive Landscape
- Overview on criticality of inputs and factors of differentiation
- 11.3 Landscape disruption
- Overview on factors of disruption
- 11.4 Industry risks
- Impact of key risks on business
12 Competitive Analysis
- 12.1 Companies profiled
- Companies covered
- 12.2 Market positioning of companies
- Matrix on companies position and classification
- 12.3 ABB Ltd.
- ABB Ltd. - Overview
- ABB Ltd. - Business segments
- ABB Ltd. - Key news
- ABB Ltd. - Key offerings
- ABB Ltd. - Segment focus
- 12.4 ALSTOM SA
- ALSTOM SA - Overview
- ALSTOM SA - Business segments
- ALSTOM SA - Key news
- ALSTOM SA - Key offerings
- ALSTOM SA - Segment focus
- 12.5 eLynx Technologies LLC
- eLynx Technologies LLC - Overview
- eLynx Technologies LLC - Product / Service
- eLynx Technologies LLC - Key offerings
- 12.6 Emerson Electric Co.
- Emerson Electric Co. - Overview
- Emerson Electric Co. - Business segments
- Emerson Electric Co. - Key news
- Emerson Electric Co. - Key offerings
- Emerson Electric Co. - Segment focus
- 12.7 General Electric Co.
- General Electric Co. - Overview
- General Electric Co. - Business segments
- General Electric Co. - Key news
- General Electric Co. - Key offerings
- General Electric Co. - Segment focus
- 12.8 GlobaLogix
- GlobaLogix - Overview
- GlobaLogix - Product / Service
- GlobaLogix - Key offerings
- 12.9 Honeywell International Inc.
- Honeywell International Inc. - Overview
- Honeywell International Inc. - Business segments
- Honeywell International Inc. - Key news
- Honeywell International Inc. - Key offerings
- Honeywell International Inc. - Segment focus
- 12.10 Indi.An GmbH
- Indi.An GmbH - Overview
- Indi.An GmbH - Product / Service
- Indi.An GmbH - Key offerings
- 12.11 JFE Holdings Inc.
- JFE Holdings Inc. - Overview
- JFE Holdings Inc. - Business segments
- JFE Holdings Inc. - Key news
- JFE Holdings Inc. - Key offerings
- JFE Holdings Inc. - Segment focus
- 12.12 Mitsubishi Electric Corp.
- Mitsubishi Electric Corp. - Overview
- Mitsubishi Electric Corp. - Business segments
- Mitsubishi Electric Corp. - Key news
- Mitsubishi Electric Corp. - Key offerings
- Mitsubishi Electric Corp. - Segment focus
- 12.13 OMRON Corp.
- OMRON Corp. - Overview
- OMRON Corp. - Business segments
- OMRON Corp. - Key news
- OMRON Corp. - Key offerings
- OMRON Corp. - Segment focus
- 12.14 Rockwell Automation Inc.
- Rockwell Automation Inc. - Overview
- Rockwell Automation Inc. - Business segments
- Rockwell Automation Inc. - Key news
- Rockwell Automation Inc. - Key offerings
- Rockwell Automation Inc. - Segment focus
- 12.15 Schneider Electric SE
- Schneider Electric SE - Overview
- Schneider Electric SE - Business segments
- Schneider Electric SE - Key news
- Schneider Electric SE - Key offerings
- Schneider Electric SE - Segment focus
- 12.16 Siemens AG
- Siemens AG - Overview
- Siemens AG - Business segments
- Siemens AG - Key news
- Siemens AG - Key offerings
- Siemens AG - Segment focus
- 12.17 Yokogawa Electric Corp.
- Yokogawa Electric Corp. - Overview
- Yokogawa Electric Corp. - Business segments
- Yokogawa Electric Corp. - Key news
- Yokogawa Electric Corp. - Key offerings
- Yokogawa Electric Corp. - Segment focus
13 Appendix
- 13.1 Scope of the report
- 13.2 Inclusions and exclusions checklist
- Inclusions checklist
- Exclusions checklist
- 13.3 Currency conversion rates for US$
- Currency conversion rates for US$
- 13.4 Research methodology
- Research methodology
- 13.5 Data procurement
- Information sources
- 13.6 Data validation
- Data validation
- 13.7 Validation techniques employed for market sizing
- Validation techniques employed for market sizing
- 13.8 Data synthesis
- Data synthesis
- 13.9 360 degree market analysis
- 360 degree market analysis
- 13.10 List of abbreviations
- List of abbreviations

