|
|
市場調査レポート
商品コード
1558595
電気自動車(EV)充電ケーブルの世界市場、2024~2028年Global Electric Vehicle (EV) Charging Cable 2024-2028 |
||||||
|
|||||||
カスタマイズ可能
|
|||||||

| 電気自動車(EV)充電ケーブルの世界市場、2024~2028年 |
|
出版日: 2024年08月19日
発行: TechNavio
ページ情報: 英文 159 Pages
納期: 即納可能
|

全表示
- 概要
- 図表
- 目次
電気自動車(EV)充電ケーブルの世界市場、2024~202年
電気自動車(EV)充電ケーブル市場は、2023~2028年に44億7,010万米ドル、予測期間中のCAGRは43.61%で成長すると予測されます。この調査レポートは、電気自動車(EV)用充電ケーブル市場の全体的な分析、市場規模と予測、動向、成長促進要因、約25のベンダーを網羅したベンダー分析などを掲載しています。
現在の市場シナリオ、最新動向と促進要因、市場環境全体に関する最新分析を提供しています。市場は、EVと充電器の採用を促進する燃料の排出と効率に関する規制、カーボンフットプリントの削減に関する政府の懸念、コイル状充電ケーブルと直流充電ケーブルの採用増加によって牽引されています。
| 市場範囲 | |
|---|---|
| 基準年 | 2024年 |
| 終了年 | 2028年 |
| 予測期間 | 2024~2028年 |
| 成長モメンタム | 加速 |
| 前年比[2024年] | 31.53% |
| CAGR | 43.61% |
| 増分額 | 44億7,010万米ドル |
本調査では、今後数年間の電気自動車(EV)充電ケーブル市場の成長を促進する主要要因の1つとして、税制優遇措置によるEV販売の増加が、整備されたEV充電インフラへの需要を後押ししていることを挙げています。また、公共のEV充電ステーションのインフラ開拓の増加とEV充電ケーブルの技術進歩は、市場の大きな需要につながります。
目次
第1章 エグゼクティブサマリー
- 市場概要
第2章 市場情勢
- 市場エコシステム
- 市場の特徴
- バリューチェーン分析
第3章 市場規模の評価
- 市場の定義
- 市場セグメント分析
- 市場規模 2023年
- 市場の展望 2023~2028年
第4章 市場規模実績
- 世界の電気自動車(EV)充電ケーブル 2018~2022年
- 用途別セグメント分析 2018~2022年
- タイプ別セグメント分析 2018~2022年
- 地域別セグメント分析 2018~2022年
- 国別セグメント分析 2018~2022年
第5章 ファイブフォース分析
- ファイブフォースの要約
- 買い手の交渉力
- 供給企業の交渉力
- 新規参入業者の脅威
- 代替品の脅威
- 競争の脅威
- 市況
第6章 市場セグメンテーション:用途別
- 市場セグメンテーション
- 比較:用途別
- 個人用充電:市場規模と予測 2023~2028年
- 公共用充電:市場規模と予測 2023~2028年
- 市場機会:用途別
第7章 市場セグメンテーション:タイプ別
- 市場セグメンテーション
- 比較:タイプ別
- ストレートケーブル:市場規模と予測 2023~2028年
- コイルケーブル:市場規模と予測 2023~2028年
- 市場機会:タイプ別
第8章 顧客情勢
- 顧客情勢概要
第9章 地域別情勢
- 地域別セグメンテーション
- 比較:地域別
- アジア太平洋:市場規模と予測 2023~2028年
- 欧州:市場規模と予測 2023~2028年
- 北米:市場規模と予測 2023~2028年
- 南米:市場規模と予測 2023~2028年
- 中東・アフリカ:市場規模と予測 2023~2028年
- 中国:市場規模と予測 2023~2028年
- 米国:市場規模と予測 2023~2028年
- 日本:市場規模と予測 2023~2028年
- ドイツ:市場規模と予測 2023~2028年
- 英国:市場規模と予測 2023~2028年
- 市場機会:地域情勢別
第10章 促進要因・課題・機会・抑制要因
- 市場促進要因
- 市場課題
- 促進要因と課題の影響
- 市場の機会・抑制要因
第11章 競合情勢
- 概要
- 競合情勢
- 混乱の状況
- 業界のリスク
第12章 競合分析
- 企業プロファイル
- 企業の市場ポジショニング
- ABB Ltd.
- AG Electrical Technology Co. Ltd.
- Besen International Group Co. Ltd
- BorgWarner Inc.
- BRUGG GROUP AG
- Dyden Corp.
- Guangdong OMG Transmitting Technology Co. Ltd.
- HUBER SUHNER AG
- Inteplast Group
- Leoni AG
- Manlon Polymers
- Phoenix Contact GmbH and Co. KG
- Schneider Electric SE
- SINBON Electronics Co. Ltd.
- TE Connectivity Ltd.
第13章 付録
Exhibits:
- Exhibits1: Executive Summary - Chart on Market Overview
- Exhibits2: Executive Summary - Data Table on Market Overview
- Exhibits3: Executive Summary - Chart on Global Market Characteristics
- Exhibits4: Executive Summary - Chart on Market By Geographical Landscape
- Exhibits5: Executive Summary - Chart on Market Segmentation by Application
- Exhibits6: Executive Summary - Chart on Market Segmentation by Type
- Exhibits7: Executive Summary - Chart on Incremental Growth
- Exhibits8: Executive Summary - Data Table on Incremental Growth
- Exhibits9: Executive Summary - Chart on Company Market Positioning
- Exhibits10: Parent Market
- Exhibits11: Data Table on - Parent Market
- Exhibits12: Market characteristics analysis
- Exhibits13: Value Chain Analysis
- Exhibits14: Offerings of companies included in the market definition
- Exhibits15: Market segments
- Exhibits16: Chart on Global - Market size and forecast 2023-2028 ($ million)
- Exhibits17: Data Table on Global - Market size and forecast 2023-2028 ($ million)
- Exhibits18: Chart on Global Market: Year-over-year growth 2023-2028 (%)
- Exhibits19: Data Table on Global Market: Year-over-year growth 2023-2028 (%)
- Exhibits20: Historic Market Size - Data Table on Global Electric Vehicle (EV) Charging Cable 2018 - 2022 ($ million)
- Exhibits21: Historic Market Size - Application Segment 2018 - 2022 ($ million)
- Exhibits22: Historic Market Size - Type Segment 2018 - 2022 ($ million)
- Exhibits23: Historic Market Size - Geography Segment 2018 - 2022 ($ million)
- Exhibits24: Historic Market Size - Country Segment 2018 - 2022 ($ million)
- Exhibits25: Five forces analysis - Comparison between 2023 and 2028
- Exhibits26: Bargaining power of buyers - Impact of key factors 2023 and 2028
- Exhibits27: Bargaining power of suppliers - Impact of key factors in 2023 and 2028
- Exhibits28: Threat of new entrants - Impact of key factors in 2023 and 2028
- Exhibits29: Threat of substitutes - Impact of key factors in 2023 and 2028
- Exhibits30: Threat of rivalry - Impact of key factors in 2023 and 2028
- Exhibits31: Chart on Market condition - Five forces 2023 and 2028
- Exhibits32: Chart on Application - Market share 2023-2028 (%)
- Exhibits33: Data Table on Application - Market share 2023-2028 (%)
- Exhibits34: Chart on Comparison by Application
- Exhibits35: Data Table on Comparison by Application
- Exhibits36: Chart on Private charging - Market size and forecast 2023-2028 ($ million)
- Exhibits37: Data Table on Private charging - Market size and forecast 2023-2028 ($ million)
- Exhibits38: Chart on Private charging - Year-over-year growth 2023-2028 (%)
- Exhibits39: Data Table on Private charging - Year-over-year growth 2023-2028 (%)
- Exhibits40: Chart on Public charging - Market size and forecast 2023-2028 ($ million)
- Exhibits41: Data Table on Public charging - Market size and forecast 2023-2028 ($ million)
- Exhibits42: Chart on Public charging - Year-over-year growth 2023-2028 (%)
- Exhibits43: Data Table on Public charging - Year-over-year growth 2023-2028 (%)
- Exhibits44: Market opportunity by Application ($ million)
- Exhibits45: Data Table on Market opportunity by Application ($ million)
- Exhibits46: Chart on Type - Market share 2023-2028 (%)
- Exhibits47: Data Table on Type - Market share 2023-2028 (%)
- Exhibits48: Chart on Comparison by Type
- Exhibits49: Data Table on Comparison by Type
- Exhibits50: Chart on Straight cable - Market size and forecast 2023-2028 ($ million)
- Exhibits51: Data Table on Straight cable - Market size and forecast 2023-2028 ($ million)
- Exhibits52: Chart on Straight cable - Year-over-year growth 2023-2028 (%)
- Exhibits53: Data Table on Straight cable - Year-over-year growth 2023-2028 (%)
- Exhibits54: Chart on Coiled cable - Market size and forecast 2023-2028 ($ million)
- Exhibits55: Data Table on Coiled cable - Market size and forecast 2023-2028 ($ million)
- Exhibits56: Chart on Coiled cable - Year-over-year growth 2023-2028 (%)
- Exhibits57: Data Table on Coiled cable - Year-over-year growth 2023-2028 (%)
- Exhibits58: Market opportunity by Type ($ million)
- Exhibits59: Data Table on Market opportunity by Type ($ million)
- Exhibits60: Analysis of price sensitivity, lifecycle, customer purchase basket, adoption rates, and purchase criteria
- Exhibits61: Chart on Market share By Geographical Landscape 2023-2028 (%)
- Exhibits62: Data Table on Market share By Geographical Landscape 2023-2028 (%)
- Exhibits63: Chart on Geographic comparison
- Exhibits64: Data Table on Geographic comparison
- Exhibits65: Chart on APAC - Market size and forecast 2023-2028 ($ million)
- Exhibits66: Data Table on APAC - Market size and forecast 2023-2028 ($ million)
- Exhibits67: Chart on APAC - Year-over-year growth 2023-2028 (%)
- Exhibits68: Data Table on APAC - Year-over-year growth 2023-2028 (%)
- Exhibits69: Chart on Europe - Market size and forecast 2023-2028 ($ million)
- Exhibits70: Data Table on Europe - Market size and forecast 2023-2028 ($ million)
- Exhibits71: Chart on Europe - Year-over-year growth 2023-2028 (%)
- Exhibits72: Data Table on Europe - Year-over-year growth 2023-2028 (%)
- Exhibits73: Chart on North America - Market size and forecast 2023-2028 ($ million)
- Exhibits74: Data Table on North America - Market size and forecast 2023-2028 ($ million)
- Exhibits75: Chart on North America - Year-over-year growth 2023-2028 (%)
- Exhibits76: Data Table on North America - Year-over-year growth 2023-2028 (%)
- Exhibits77: Chart on South America - Market size and forecast 2023-2028 ($ million)
- Exhibits78: Data Table on South America - Market size and forecast 2023-2028 ($ million)
- Exhibits79: Chart on South America - Year-over-year growth 2023-2028 (%)
- Exhibits80: Data Table on South America - Year-over-year growth 2023-2028 (%)
- Exhibits81: Chart on Middle East and Africa - Market size and forecast 2023-2028 ($ million)
- Exhibits82: Data Table on Middle East and Africa - Market size and forecast 2023-2028 ($ million)
- Exhibits83: Chart on Middle East and Africa - Year-over-year growth 2023-2028 (%)
- Exhibits84: Data Table on Middle East and Africa - Year-over-year growth 2023-2028 (%)
- Exhibits85: Chart on China - Market size and forecast 2023-2028 ($ million)
- Exhibits86: Data Table on China - Market size and forecast 2023-2028 ($ million)
- Exhibits87: Chart on China - Year-over-year growth 2023-2028 (%)
- Exhibits88: Data Table on China - Year-over-year growth 2023-2028 (%)
- Exhibits89: Chart on US - Market size and forecast 2023-2028 ($ million)
- Exhibits90: Data Table on US - Market size and forecast 2023-2028 ($ million)
- Exhibits91: Chart on US - Year-over-year growth 2023-2028 (%)
- Exhibits92: Data Table on US - Year-over-year growth 2023-2028 (%)
- Exhibits93: Chart on Japan - Market size and forecast 2023-2028 ($ million)
- Exhibits94: Data Table on Japan - Market size and forecast 2023-2028 ($ million)
- Exhibits95: Chart on Japan - Year-over-year growth 2023-2028 (%)
- Exhibits96: Data Table on Japan - Year-over-year growth 2023-2028 (%)
- Exhibits97: Chart on Germany - Market size and forecast 2023-2028 ($ million)
- Exhibits98: Data Table on Germany - Market size and forecast 2023-2028 ($ million)
- Exhibits99: Chart on Germany - Year-over-year growth 2023-2028 (%)
- Exhibits100: Data Table on Germany - Year-over-year growth 2023-2028 (%)
- Exhibits101: Chart on UK - Market size and forecast 2023-2028 ($ million)
- Exhibits102: Data Table on UK - Market size and forecast 2023-2028 ($ million)
- Exhibits103: Chart on UK - Year-over-year growth 2023-2028 (%)
- Exhibits104: Data Table on UK - Year-over-year growth 2023-2028 (%)
- Exhibits105: Market opportunity By Geographical Landscape ($ million)
- Exhibits106: Data Tables on Market opportunity By Geographical Landscape ($ million)
- Exhibits107: Impact of drivers and challenges in 2023 and 2028
- Exhibits108: Overview on criticality of inputs and factors of differentiation
- Exhibits109: Overview on factors of disruption
- Exhibits110: Impact of key risks on business
- Exhibits111: Companies covered
- Exhibits112: Matrix on companies position and classification
- Exhibits113: ABB Ltd. - Overview
- Exhibits114: ABB Ltd. - Business segments
- Exhibits115: ABB Ltd. - Key news
- Exhibits116: ABB Ltd. - Key offerings
- Exhibits117: ABB Ltd. - Segment focus
- Exhibits118: AG Electrical Technology Co. Ltd. - Overview
- Exhibits119: AG Electrical Technology Co. Ltd. - Product / Service
- Exhibits120: AG Electrical Technology Co. Ltd. - Key offerings
- Exhibits121: Besen International Group Co. Ltd - Overview
- Exhibits122: Besen International Group Co. Ltd - Product / Service
- Exhibits123: Besen International Group Co. Ltd - Key offerings
- Exhibits124: BorgWarner Inc. - Overview
- Exhibits125: BorgWarner Inc. - Business segments
- Exhibits126: BorgWarner Inc. - Key news
- Exhibits127: BorgWarner Inc. - Key offerings
- Exhibits128: BorgWarner Inc. - Segment focus
- Exhibits129: BRUGG GROUP AG - Overview
- Exhibits130: BRUGG GROUP AG - Product / Service
- Exhibits131: BRUGG GROUP AG - Key offerings
- Exhibits132: Dyden Corp. - Overview
- Exhibits133: Dyden Corp. - Product / Service
- Exhibits134: Dyden Corp. - Key offerings
- Exhibits135: Guangdong OMG Transmitting Technology Co. Ltd. - Overview
- Exhibits136: Guangdong OMG Transmitting Technology Co. Ltd. - Product / Service
- Exhibits137: Guangdong OMG Transmitting Technology Co. Ltd. - Key offerings
- Exhibits138: HUBER SUHNER AG - Overview
- Exhibits139: HUBER SUHNER AG - Business segments
- Exhibits140: HUBER SUHNER AG - Key offerings
- Exhibits141: HUBER SUHNER AG - Segment focus
- Exhibits142: Inteplast Group - Overview
- Exhibits143: Inteplast Group - Product / Service
- Exhibits144: Inteplast Group - Key offerings
- Exhibits145: Leoni AG - Overview
- Exhibits146: Leoni AG - Business segments
- Exhibits147: Leoni AG - Key offerings
- Exhibits148: Leoni AG - Segment focus
- Exhibits149: Manlon Polymers - Overview
- Exhibits150: Manlon Polymers - Product / Service
- Exhibits151: Manlon Polymers - Key offerings
- Exhibits152: Phoenix Contact GmbH and Co. KG - Overview
- Exhibits153: Phoenix Contact GmbH and Co. KG - Product / Service
- Exhibits154: Phoenix Contact GmbH and Co. KG - Key offerings
- Exhibits155: Schneider Electric SE - Overview
- Exhibits156: Schneider Electric SE - Business segments
- Exhibits157: Schneider Electric SE - Key news
- Exhibits158: Schneider Electric SE - Key offerings
- Exhibits159: Schneider Electric SE - Segment focus
- Exhibits160: SINBON Electronics Co. Ltd. - Overview
- Exhibits161: SINBON Electronics Co. Ltd. - Business segments
- Exhibits162: SINBON Electronics Co. Ltd. - Key offerings
- Exhibits163: SINBON Electronics Co. Ltd. - Segment focus
- Exhibits164: TE Connectivity Ltd. - Overview
- Exhibits165: TE Connectivity Ltd. - Business segments
- Exhibits166: TE Connectivity Ltd. - Key news
- Exhibits167: TE Connectivity Ltd. - Key offerings
- Exhibits168: TE Connectivity Ltd. - Segment focus
- Exhibits169: Inclusions checklist
- Exhibits170: Exclusions checklist
- Exhibits171: Currency conversion rates for US$
- Exhibits172: Research methodology
- Exhibits173: Information sources
- Exhibits174: Data validation
- Exhibits175: Validation techniques employed for market sizing
- Exhibits176: Data synthesis
- Exhibits177: 360 degree market analysis
- Exhibits178: List of abbreviations
Global Electric Vehicle (Ev) Charging Cable Market 2024-2028
The electric vehicle (ev) charging cable market is forecasted to grow by USD 4470.1 mn during 2023-2028, accelerating at a CAGR of 43.61% during the forecast period. The report on the electric vehicle (ev) charging cable market provides a holistic analysis, market size and forecast, trends, growth drivers, and challenges, as well as vendor analysis covering around 25 vendors.
The report offers an up-to-date analysis regarding the current market scenario, the latest trends and drivers, and the overall market environment. The market is driven by fuel emission and efficiency regulations driving adoption of evs and chargers, government concerns over reducing carbon footprints, and rising adoption of coiled charging cables and dc charging cables.
| Market Scope | |
|---|---|
| Base Year | 2024 |
| End Year | 2028 |
| Series Year | 2024-2028 |
| Growth Momentum | Accelerate |
| YOY 2024 | 31.53% |
| CAGR | 43.61% |
| Incremental Value | $4470.1 mn |
Technavio's electric vehicle (ev) charging cable market is segmented as below:
By Application
- Private charging
- Public charging
By Type
- Straight cable
- Coiled cable
By Geographical Landscape
- APAC
- Europe
- North America
- South America
- Middle East and Africa
This study identifies the increasing ev sales through tax incentives pushing demand for well-built ev charging infrastructure as one of the prime reasons driving the electric vehicle (ev) charging cable market growth during the next few years. Also, rise in infrastructural developments of public ev charging stations and technological advancement in ev charging cables will lead to sizable demand in the market.
The report on the electric vehicle (ev) charging cable market covers the following areas:
- Electric vehicle (ev) charging cable market sizing
- Electric vehicle (ev) charging cable market forecast
- Electric vehicle (ev) charging cable market industry analysis
The robust vendor analysis is designed to help clients improve their market position, and in line with this, this report provides a detailed analysis of several leading electric vehicle (ev) charging cable market vendors that include ABB Ltd., AG Electrical Technology Co. Ltd., Besen International Group Co. Ltd, BorgWarner Inc., BRUGG GROUP AG, Dyden Corp., Fujikura Co. Ltd., Guangdong OMG Transmitting Technology Co. Ltd., HUBER SUHNER AG, Inteplast Group, KEBA Group AG, Lapp Holding SE, Leoni AG, Manlon Polymers, Nexans SA, Phoenix Contact GmbH and Co. KG, Schneider Electric SE, SINBON Electronics Co. Ltd. , Sumitomo Electric Industries Ltd., and TE Connectivity Ltd.. Also, the electric vehicle (ev) charging cable market analysis report includes information on upcoming trends and challenges that will influence market growth. This is to help companies strategize and leverage all forthcoming growth opportunities.
The study was conducted using an objective combination of primary and secondary information including inputs from key participants in the industry. The report contains a comprehensive market and vendor landscape in addition to an analysis of the key vendors.
The publisher presents a detailed picture of the market by the way of study, synthesis, and summation of data from multiple sources by an analysis of key parameters such as profit, pricing, competition, and promotions. It presents various market facets by identifying the key industry influencers. The data presented is comprehensive, reliable, and a result of extensive research - both primary and secondary. The market research reports provide a complete competitive landscape and an in-depth vendor selection methodology and analysis using qualitative and quantitative research to forecast the accurate market growth.
Table of Contents
1 Executive Summary
- 1.1 Market overview
- Executive Summary - Chart on Market Overview
- Executive Summary - Data Table on Market Overview
- Executive Summary - Chart on Global Market Characteristics
- Executive Summary - Chart on Market By Geographical Landscape
- Executive Summary - Chart on Market Segmentation by Application
- Executive Summary - Chart on Market Segmentation by Type
- Executive Summary - Chart on Incremental Growth
- Executive Summary - Data Table on Incremental Growth
- Executive Summary - Chart on Company Market Positioning
2 Market Landscape
- 2.1 Market ecosystem
- Parent Market
- Data Table on - Parent Market
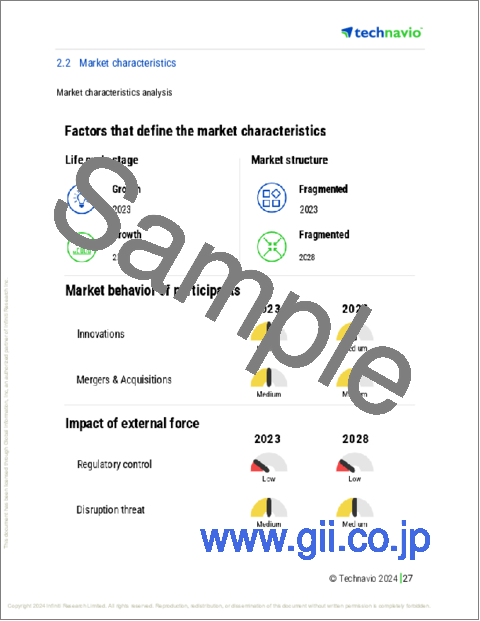
- 2.2 Market characteristics
- Market characteristics analysis
- 2.3 Value chain analysis
- Value Chain Analysis
3 Market Sizing
- 3.1 Market definition
- Offerings of companies included in the market definition
- 3.2 Market segment analysis
- Market segments
- 3.3 Market size 2023
- 3.4 Market outlook: Forecast for 2023-2028
- Chart on Global - Market size and forecast 2023-2028 ($ million)
- Data Table on Global - Market size and forecast 2023-2028 ($ million)
- Chart on Global Market: Year-over-year growth 2023-2028 (%)
- Data Table on Global Market: Year-over-year growth 2023-2028 (%)
4 Historic Market Size
- 4.1 Global Electric Vehicle (EV) Charging Cable 2018 - 2022
- Historic Market Size - Data Table on Global Electric Vehicle (EV) Charging Cable 2018 - 2022 ($ million)
- 4.2 Application segment analysis 2018 - 2022
- Historic Market Size - Application Segment 2018 - 2022 ($ million)
- 4.3 Type segment analysis 2018 - 2022
- Historic Market Size - Type Segment 2018 - 2022 ($ million)
- 4.4 Geography segment analysis 2018 - 2022
- Historic Market Size - Geography Segment 2018 - 2022 ($ million)
- 4.5 Country segment analysis 2018 - 2022
- Historic Market Size - Country Segment 2018 - 2022 ($ million)
5 Five Forces Analysis
- 5.1 Five forces summary
- Five forces analysis - Comparison between 2023 and 2028
- 5.2 Bargaining power of buyers
- Bargaining power of buyers - Impact of key factors 2023 and 2028
- 5.3 Bargaining power of suppliers
- Bargaining power of suppliers - Impact of key factors in 2023 and 2028
- 5.4 Threat of new entrants
- Threat of new entrants - Impact of key factors in 2023 and 2028
- 5.5 Threat of substitutes
- Threat of substitutes - Impact of key factors in 2023 and 2028
- 5.6 Threat of rivalry
- Threat of rivalry - Impact of key factors in 2023 and 2028
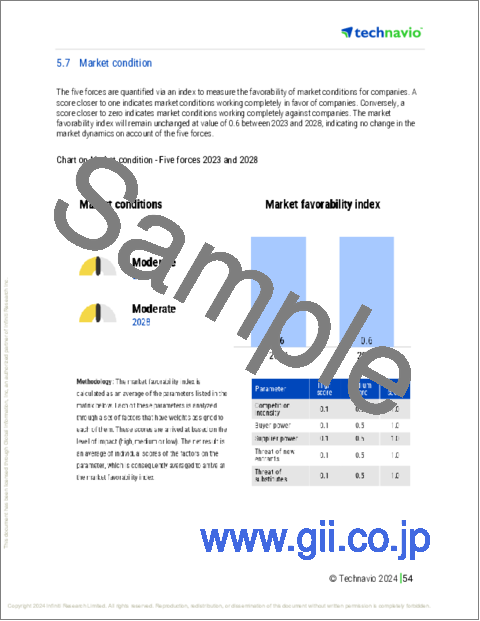
- 5.7 Market condition
- Chart on Market condition - Five forces 2023 and 2028
6 Market Segmentation by Application
- 6.1 Market segments
- Chart on Application - Market share 2023-2028 (%)
- Data Table on Application - Market share 2023-2028 (%)
- 6.2 Comparison by Application
- Chart on Comparison by Application
- Data Table on Comparison by Application
- 6.3 Private charging - Market size and forecast 2023-2028
- Chart on Private charging - Market size and forecast 2023-2028 ($ million)
- Data Table on Private charging - Market size and forecast 2023-2028 ($ million)
- Chart on Private charging - Year-over-year growth 2023-2028 (%)
- Data Table on Private charging - Year-over-year growth 2023-2028 (%)
- 6.4 Public charging - Market size and forecast 2023-2028
- Chart on Public charging - Market size and forecast 2023-2028 ($ million)
- Data Table on Public charging - Market size and forecast 2023-2028 ($ million)
- Chart on Public charging - Year-over-year growth 2023-2028 (%)
- Data Table on Public charging - Year-over-year growth 2023-2028 (%)
- 6.5 Market opportunity by Application
- Market opportunity by Application ($ million)
- Data Table on Market opportunity by Application ($ million)
7 Market Segmentation by Type
- 7.1 Market segments
- Chart on Type - Market share 2023-2028 (%)
- Data Table on Type - Market share 2023-2028 (%)
- 7.2 Comparison by Type
- Chart on Comparison by Type
- Data Table on Comparison by Type
- 7.3 Straight cable - Market size and forecast 2023-2028
- Chart on Straight cable - Market size and forecast 2023-2028 ($ million)
- Data Table on Straight cable - Market size and forecast 2023-2028 ($ million)
- Chart on Straight cable - Year-over-year growth 2023-2028 (%)
- Data Table on Straight cable - Year-over-year growth 2023-2028 (%)
- 7.4 Coiled cable - Market size and forecast 2023-2028
- Chart on Coiled cable - Market size and forecast 2023-2028 ($ million)
- Data Table on Coiled cable - Market size and forecast 2023-2028 ($ million)
- Chart on Coiled cable - Year-over-year growth 2023-2028 (%)
- Data Table on Coiled cable - Year-over-year growth 2023-2028 (%)
- 7.5 Market opportunity by Type
- Market opportunity by Type ($ million)
- Data Table on Market opportunity by Type ($ million)
8 Customer Landscape
- 8.1 Customer landscape overview
- Analysis of price sensitivity, lifecycle, customer purchase basket, adoption rates, and purchase criteria
9 Geographic Landscape
- 9.1 Geographic segmentation
- Chart on Market share By Geographical Landscape 2023-2028 (%)
- Data Table on Market share By Geographical Landscape 2023-2028 (%)
- 9.2 Geographic comparison
- Chart on Geographic comparison
- Data Table on Geographic comparison
- 9.3 APAC - Market size and forecast 2023-2028
- Chart on APAC - Market size and forecast 2023-2028 ($ million)
- Data Table on APAC - Market size and forecast 2023-2028 ($ million)
- Chart on APAC - Year-over-year growth 2023-2028 (%)
- Data Table on APAC - Year-over-year growth 2023-2028 (%)
- 9.4 Europe - Market size and forecast 2023-2028
- Chart on Europe - Market size and forecast 2023-2028 ($ million)
- Data Table on Europe - Market size and forecast 2023-2028 ($ million)
- Chart on Europe - Year-over-year growth 2023-2028 (%)
- Data Table on Europe - Year-over-year growth 2023-2028 (%)
- 9.5 North America - Market size and forecast 2023-2028
- Chart on North America - Market size and forecast 2023-2028 ($ million)
- Data Table on North America - Market size and forecast 2023-2028 ($ million)
- Chart on North America - Year-over-year growth 2023-2028 (%)
- Data Table on North America - Year-over-year growth 2023-2028 (%)
- 9.6 South America - Market size and forecast 2023-2028
- Chart on South America - Market size and forecast 2023-2028 ($ million)
- Data Table on South America - Market size and forecast 2023-2028 ($ million)
- Chart on South America - Year-over-year growth 2023-2028 (%)
- Data Table on South America - Year-over-year growth 2023-2028 (%)
- 9.7 Middle East and Africa - Market size and forecast 2023-2028
- Chart on Middle East and Africa - Market size and forecast 2023-2028 ($ million)
- Data Table on Middle East and Africa - Market size and forecast 2023-2028 ($ million)
- Chart on Middle East and Africa - Year-over-year growth 2023-2028 (%)
- Data Table on Middle East and Africa - Year-over-year growth 2023-2028 (%)
- 9.8 China - Market size and forecast 2023-2028
- Chart on China - Market size and forecast 2023-2028 ($ million)
- Data Table on China - Market size and forecast 2023-2028 ($ million)
- Chart on China - Year-over-year growth 2023-2028 (%)
- Data Table on China - Year-over-year growth 2023-2028 (%)
- 9.9 US - Market size and forecast 2023-2028
- Chart on US - Market size and forecast 2023-2028 ($ million)
- Data Table on US - Market size and forecast 2023-2028 ($ million)
- Chart on US - Year-over-year growth 2023-2028 (%)
- Data Table on US - Year-over-year growth 2023-2028 (%)
- 9.10 Japan - Market size and forecast 2023-2028
- Chart on Japan - Market size and forecast 2023-2028 ($ million)
- Data Table on Japan - Market size and forecast 2023-2028 ($ million)
- Chart on Japan - Year-over-year growth 2023-2028 (%)
- Data Table on Japan - Year-over-year growth 2023-2028 (%)
- 9.11 Germany - Market size and forecast 2023-2028
- Chart on Germany - Market size and forecast 2023-2028 ($ million)
- Data Table on Germany - Market size and forecast 2023-2028 ($ million)
- Chart on Germany - Year-over-year growth 2023-2028 (%)
- Data Table on Germany - Year-over-year growth 2023-2028 (%)
- 9.12 UK - Market size and forecast 2023-2028
- Chart on UK - Market size and forecast 2023-2028 ($ million)
- Data Table on UK - Market size and forecast 2023-2028 ($ million)
- Chart on UK - Year-over-year growth 2023-2028 (%)
- Data Table on UK - Year-over-year growth 2023-2028 (%)
- 9.13 Market opportunity By Geographical Landscape
- Market opportunity By Geographical Landscape ($ million)
- Data Tables on Market opportunity By Geographical Landscape ($ million)
10 Drivers, Challenges, and Opportunity/Restraints
- 10.1 Market drivers
- 10.2 Market challenges
- 10.3 Impact of drivers and challenges
- Impact of drivers and challenges in 2023 and 2028
- 10.4 Market opportunities/restraints
11 Competitive Landscape
- 11.1 Overview
- 11.2 Competitive Landscape
- Overview on criticality of inputs and factors of differentiation
- 11.3 Landscape disruption
- Overview on factors of disruption
- 11.4 Industry risks
- Impact of key risks on business
12 Competitive Analysis
- 12.1 Companies profiled
- Companies covered
- 12.2 Market positioning of companies
- Matrix on companies position and classification
- 12.3 ABB Ltd.
- ABB Ltd. - Overview
- ABB Ltd. - Business segments
- ABB Ltd. - Key news
- ABB Ltd. - Key offerings
- ABB Ltd. - Segment focus
- 12.4 AG Electrical Technology Co. Ltd.
- AG Electrical Technology Co. Ltd. - Overview
- AG Electrical Technology Co. Ltd. - Product / Service
- AG Electrical Technology Co. Ltd. - Key offerings
- 12.5 Besen International Group Co. Ltd
- Besen International Group Co. Ltd - Overview
- Besen International Group Co. Ltd - Product / Service
- Besen International Group Co. Ltd - Key offerings
- 12.6 BorgWarner Inc.
- BorgWarner Inc. - Overview
- BorgWarner Inc. - Business segments
- BorgWarner Inc. - Key news
- BorgWarner Inc. - Key offerings
- BorgWarner Inc. - Segment focus
- 12.7 BRUGG GROUP AG
- BRUGG GROUP AG - Overview
- BRUGG GROUP AG - Product / Service
- BRUGG GROUP AG - Key offerings
- 12.8 Dyden Corp.
- Dyden Corp. - Overview
- Dyden Corp. - Product / Service
- Dyden Corp. - Key offerings
- 12.9 Guangdong OMG Transmitting Technology Co. Ltd.
- Guangdong OMG Transmitting Technology Co. Ltd. - Overview
- Guangdong OMG Transmitting Technology Co. Ltd. - Product / Service
- Guangdong OMG Transmitting Technology Co. Ltd. - Key offerings
- 12.10 HUBER SUHNER AG
- HUBER SUHNER AG - Overview
- HUBER SUHNER AG - Business segments
- HUBER SUHNER AG - Key offerings
- HUBER SUHNER AG - Segment focus
- 12.11 Inteplast Group
- Inteplast Group - Overview
- Inteplast Group - Product / Service
- Inteplast Group - Key offerings
- 12.12 Leoni AG
- Leoni AG - Overview
- Leoni AG - Business segments
- Leoni AG - Key offerings
- Leoni AG - Segment focus
- 12.13 Manlon Polymers
- Manlon Polymers - Overview
- Manlon Polymers - Product / Service
- Manlon Polymers - Key offerings
- 12.14 Phoenix Contact GmbH and Co. KG
- Phoenix Contact GmbH and Co. KG - Overview
- Phoenix Contact GmbH and Co. KG - Product / Service
- Phoenix Contact GmbH and Co. KG - Key offerings
- 12.15 Schneider Electric SE
- Schneider Electric SE - Overview
- Schneider Electric SE - Business segments
- Schneider Electric SE - Key news
- Schneider Electric SE - Key offerings
- Schneider Electric SE - Segment focus
- 12.16 SINBON Electronics Co. Ltd.
- SINBON Electronics Co. Ltd. - Overview
- SINBON Electronics Co. Ltd. - Business segments
- SINBON Electronics Co. Ltd. - Key offerings
- SINBON Electronics Co. Ltd. - Segment focus
- 12.17 TE Connectivity Ltd.
- TE Connectivity Ltd. - Overview
- TE Connectivity Ltd. - Business segments
- TE Connectivity Ltd. - Key news
- TE Connectivity Ltd. - Key offerings
- TE Connectivity Ltd. - Segment focus
13 Appendix
- 13.1 Scope of the report
- 13.2 Inclusions and exclusions checklist
- Inclusions checklist
- Exclusions checklist
- 13.3 Currency conversion rates for US$
- Currency conversion rates for US$
- 13.4 Research methodology
- Research methodology
- 13.5 Data procurement
- Information sources
- 13.6 Data validation
- Data validation
- 13.7 Validation techniques employed for market sizing
- Validation techniques employed for market sizing
- 13.8 Data synthesis
- Data synthesis
- 13.9 360 degree market analysis
- 360 degree market analysis
- 13.10 List of abbreviations
- List of abbreviations

