|
|
市場調査レポート
商品コード
1525105
細胞選別の世界市場 2024-2028Global cell sorting market 2024-2028 |
||||||
|
|||||||
カスタマイズ可能
|
|||||||

| 細胞選別の世界市場 2024-2028 |
|
出版日: 2024年07月09日
発行: TechNavio
ページ情報: 英文 162 Pages
納期: 即納可能
|

全表示
- 概要
- 図表
- 目次
細胞選別市場は2023-2028年に1億4,290万米ドル、予測期間中のCAGRは8.09%で成長すると予測されます。
当レポートでは、細胞選別市場の全体的な分析、市場規模・予測、動向、成長促進要因、課題、約25のベンダーを網羅したベンダー分析などを掲載しています。
現在の市場シナリオ、最新動向と促進要因、市場環境全体に関する最新分析を提供しています。市場は、慢性疾患の有病率の増加、臨床診断需要の増加、細胞ベースの研究に対する資金提供の増加によって牽引されています。
| 市場範囲 | |
|---|---|
| 基準年 | 2024 |
| 終了年 | 2028 |
| 予測期間 | 2024-2028 |
| 成長モメンタム | 加速 |
| 前年比2024年 | 7.32% |
| CAGR | 8.09% |
| 増分額 | 1億4,290万米ドル |
本調査では、今後数年間の細胞選別市場成長を促進する主な要因の1つとして、法医学調査における遺伝子工学の採用拡大を挙げています。また、世界の細胞選別市場における技術的進歩やハイスループット細胞選別に対する需要の高まりは、市場の大きな需要につながります。
目次
第1章 エグゼクティブサマリー
- 市場概要
第2章 市場情勢
- 市場エコシステム
- 市場の特徴
- バリューチェーン分析
第3章 市場規模の評価
- 市場の定義
- 市場セグメント分析
- 市場規模 2023
- 市場の見通し 2023-2028
第4章 市場規模実績
- 世界細胞選別市場 2018-2022
- エンドユーザー別セグメント分析 2018-2022
- 技術別セグメント分析 2018-2022
- 地域別セグメント分析 2018-2022
- 国別セグメント分析 2018-2022
第5章 ファイブフォース分析
- ファイブフォースの要約
- 買い手の交渉力
- 供給企業の交渉力
- 新規参入業者の脅威
- 代替品の脅威
- 競争の脅威
- 市況
第6章 市場セグメンテーション:エンドユーザー別
- 市場セグメンテーション
- 比較:エンドユーザー別
- 製薬・バイオテクノロジー企業:市場規模と予測 2023-2028
- 病院・臨床検査室:市場規模と予測 2023-2028
- その他:市場規模と予測 2023-2028
- 市場機会:エンドユーザー別
第7章 市場セグメンテーション:技術別
- 市場セグメンテーション
- 比較:技術別
- 蛍光ベースの液滴細胞選別:市場規模と予測 2023-2028
- 磁気活性化細胞選別:市場規模と予測 2023-2028
- マイクロ電気機械システム:市場規模と予測 2023-2028
- 市場機会:技術別
第8章 顧客情勢
- 顧客情勢の概要
第9章 地域別情勢
- 地域別セグメンテーション
- 地域別比較
- 北米:市場規模と予測 2023-2028
- 欧州:市場規模と予測 2023-2028
- アジア:市場規模と予測 2023-2028
- 世界のその他の地域:市場規模と予測 2023-2028
- 米国:市場規模と予測 2023-2028
- 中国:市場規模と予測 2023-2028
- ドイツ:市場規模と予測 2023-2028
- 英国:市場規模と予測 2023-2028
- 日本:市場規模と予測 2023-2028
- 市場機会:地域情勢別
第10章 促進要因・課題・機会・抑制要因
- 市場促進要因
- 市場の課題
- 促進要因と課題の影響
- 市場の機会・抑制要因
第11章 競合情勢
- 概要
- 競合情勢
- 混乱の状況
- 業界のリスク
第12章 競合分析
- 企業プロファイル
- 企業の市場ポジショニング
- Becton Dickinson and Co.
- Bio Rad Laboratories Inc.
- Bulldog-Bio Inc.
- Cell Microsystems Inc.
- Cytonome ST LLC
- Danaher Corp.
- Miltenyi Biotec B.V. and Co. KG
- Namocell Inc.
- NanoCellect Biomedical Inc.
- On-Chip Biotechnologies Co. Ltd.
- Sony Group Corp.
- STEMCELL Technologies Inc.
- Terumo Corp.
- Thermo Fisher Scientific Inc.
- Union Biometrica Inc.
第13章 付録
Exhibits:
- Exhibits1: Executive Summary - Chart on Market Overview
- Exhibits2: Executive Summary - Data Table on Market Overview
- Exhibits3: Executive Summary - Chart on Global Market Characteristics
- Exhibits4: Executive Summary - Chart on Market By Geographical Landscape
- Exhibits5: Executive Summary - Chart on Market Segmentation by End-user
- Exhibits6: Executive Summary - Chart on Market Segmentation by Technology
- Exhibits7: Executive Summary - Chart on Incremental Growth
- Exhibits8: Executive Summary - Data Table on Incremental Growth
- Exhibits9: Executive Summary - Chart on Company Market Positioning
- Exhibits10: Parent Market
- Exhibits11: Data Table on - Parent Market
- Exhibits12: Market characteristics analysis
- Exhibits13: Value Chain Analysis
- Exhibits14: Offerings of companies included in the market definition
- Exhibits15: Market segments
- Exhibits16: Chart on Global - Market size and forecast 2023-2028 ($ million)
- Exhibits17: Data Table on Global - Market size and forecast 2023-2028 ($ million)
- Exhibits18: Chart on Global Market: Year-over-year growth 2023-2028 (%)
- Exhibits19: Data Table on Global Market: Year-over-year growth 2023-2028 (%)
- Exhibits20: Historic Market Size - Data Table on Global Cell Sorting Market 2018 - 2022 ($ million)
- Exhibits21: Historic Market Size - End-user Segment 2018 - 2022 ($ million)
- Exhibits22: Historic Market Size - Technology Segment 2018 - 2022 ($ million)
- Exhibits23: Historic Market Size - Geography Segment 2018 - 2022 ($ million)
- Exhibits24: Historic Market Size - Country Segment 2018 - 2022 ($ million)
- Exhibits25: Five forces analysis - Comparison between 2023 and 2028
- Exhibits26: Bargaining power of buyers - Impact of key factors 2023 and 2028
- Exhibits27: Bargaining power of suppliers - Impact of key factors in 2023 and 2028
- Exhibits28: Threat of new entrants - Impact of key factors in 2023 and 2028
- Exhibits29: Threat of substitutes - Impact of key factors in 2023 and 2028
- Exhibits30: Threat of rivalry - Impact of key factors in 2023 and 2028
- Exhibits31: Chart on Market condition - Five forces 2023 and 2028
- Exhibits32: Chart on End-user - Market share 2023-2028 (%)
- Exhibits33: Data Table on End-user - Market share 2023-2028 (%)
- Exhibits34: Chart on Comparison by End-user
- Exhibits35: Data Table on Comparison by End-user
- Exhibits36: Chart on Pharmaceutical and biotechnology companies - Market size and forecast 2023-2028 ($ million)
- Exhibits37: Data Table on Pharmaceutical and biotechnology companies - Market size and forecast 2023-2028 ($ million)
- Exhibits38: Chart on Pharmaceutical and biotechnology companies - Year-over-year growth 2023-2028 (%)
- Exhibits39: Data Table on Pharmaceutical and biotechnology companies - Year-over-year growth 2023-2028 (%)
- Exhibits40: Chart on Hospitals and clinical testing laboratories - Market size and forecast 2023-2028 ($ million)
- Exhibits41: Data Table on Hospitals and clinical testing laboratories - Market size and forecast 2023-2028 ($ million)
- Exhibits42: Chart on Hospitals and clinical testing laboratories - Year-over-year growth 2023-2028 (%)
- Exhibits43: Data Table on Hospitals and clinical testing laboratories - Year-over-year growth 2023-2028 (%)
- Exhibits44: Chart on Others - Market size and forecast 2023-2028 ($ million)
- Exhibits45: Data Table on Others - Market size and forecast 2023-2028 ($ million)
- Exhibits46: Chart on Others - Year-over-year growth 2023-2028 (%)
- Exhibits47: Data Table on Others - Year-over-year growth 2023-2028 (%)
- Exhibits48: Market opportunity by End-user ($ million)
- Exhibits49: Data Table on Market opportunity by End-user ($ million)
- Exhibits50: Chart on Technology - Market share 2023-2028 (%)
- Exhibits51: Data Table on Technology - Market share 2023-2028 (%)
- Exhibits52: Chart on Comparison by Technology
- Exhibits53: Data Table on Comparison by Technology
- Exhibits54: Chart on Fluorescence-based droplet cell sorting - Market size and forecast 2023-2028 ($ million)
- Exhibits55: Data Table on Fluorescence-based droplet cell sorting - Market size and forecast 2023-2028 ($ million)
- Exhibits56: Chart on Fluorescence-based droplet cell sorting - Year-over-year growth 2023-2028 (%)
- Exhibits57: Data Table on Fluorescence-based droplet cell sorting - Year-over-year growth 2023-2028 (%)
- Exhibits58: Chart on Magnetic-activated cell sorting - Market size and forecast 2023-2028 ($ million)
- Exhibits59: Data Table on Magnetic-activated cell sorting - Market size and forecast 2023-2028 ($ million)
- Exhibits60: Chart on Magnetic-activated cell sorting - Year-over-year growth 2023-2028 (%)
- Exhibits61: Data Table on Magnetic-activated cell sorting - Year-over-year growth 2023-2028 (%)
- Exhibits62: Chart on Micro-electromechanical systems - Market size and forecast 2023-2028 ($ million)
- Exhibits63: Data Table on Micro-electromechanical systems - Market size and forecast 2023-2028 ($ million)
- Exhibits64: Chart on Micro-electromechanical systems - Year-over-year growth 2023-2028 (%)
- Exhibits65: Data Table on Micro-electromechanical systems - Year-over-year growth 2023-2028 (%)
- Exhibits66: Market opportunity by Technology ($ million)
- Exhibits67: Data Table on Market opportunity by Technology ($ million)
- Exhibits68: Analysis of price sensitivity, lifecycle, customer purchase basket, adoption rates, and purchase criteria
- Exhibits69: Chart on Market share By Geographical Landscape 2023-2028 (%)
- Exhibits70: Data Table on Market share By Geographical Landscape 2023-2028 (%)
- Exhibits71: Chart on Geographic comparison
- Exhibits72: Data Table on Geographic comparison
- Exhibits73: Chart on North America - Market size and forecast 2023-2028 ($ million)
- Exhibits74: Data Table on North America - Market size and forecast 2023-2028 ($ million)
- Exhibits75: Chart on North America - Year-over-year growth 2023-2028 (%)
- Exhibits76: Data Table on North America - Year-over-year growth 2023-2028 (%)
- Exhibits77: Chart on Europe - Market size and forecast 2023-2028 ($ million)
- Exhibits78: Data Table on Europe - Market size and forecast 2023-2028 ($ million)
- Exhibits79: Chart on Europe - Year-over-year growth 2023-2028 (%)
- Exhibits80: Data Table on Europe - Year-over-year growth 2023-2028 (%)
- Exhibits81: Chart on Asia - Market size and forecast 2023-2028 ($ million)
- Exhibits82: Data Table on Asia - Market size and forecast 2023-2028 ($ million)
- Exhibits83: Chart on Asia - Year-over-year growth 2023-2028 (%)
- Exhibits84: Data Table on Asia - Year-over-year growth 2023-2028 (%)
- Exhibits85: Chart on Rest of World (ROW) - Market size and forecast 2023-2028 ($ million)
- Exhibits86: Data Table on Rest of World (ROW) - Market size and forecast 2023-2028 ($ million)
- Exhibits87: Chart on Rest of World (ROW) - Year-over-year growth 2023-2028 (%)
- Exhibits88: Data Table on Rest of World (ROW) - Year-over-year growth 2023-2028 (%)
- Exhibits89: Chart on US - Market size and forecast 2023-2028 ($ million)
- Exhibits90: Data Table on US - Market size and forecast 2023-2028 ($ million)
- Exhibits91: Chart on US - Year-over-year growth 2023-2028 (%)
- Exhibits92: Data Table on US - Year-over-year growth 2023-2028 (%)
- Exhibits93: Chart on China - Market size and forecast 2023-2028 ($ million)
- Exhibits94: Data Table on China - Market size and forecast 2023-2028 ($ million)
- Exhibits95: Chart on China - Year-over-year growth 2023-2028 (%)
- Exhibits96: Data Table on China - Year-over-year growth 2023-2028 (%)
- Exhibits97: Chart on Germany - Market size and forecast 2023-2028 ($ million)
- Exhibits98: Data Table on Germany - Market size and forecast 2023-2028 ($ million)
- Exhibits99: Chart on Germany - Year-over-year growth 2023-2028 (%)
- Exhibits100: Data Table on Germany - Year-over-year growth 2023-2028 (%)
- Exhibits101: Chart on UK - Market size and forecast 2023-2028 ($ million)
- Exhibits102: Data Table on UK - Market size and forecast 2023-2028 ($ million)
- Exhibits103: Chart on UK - Year-over-year growth 2023-2028 (%)
- Exhibits104: Data Table on UK - Year-over-year growth 2023-2028 (%)
- Exhibits105: Chart on Japan - Market size and forecast 2023-2028 ($ million)
- Exhibits106: Data Table on Japan - Market size and forecast 2023-2028 ($ million)
- Exhibits107: Chart on Japan - Year-over-year growth 2023-2028 (%)
- Exhibits108: Data Table on Japan - Year-over-year growth 2023-2028 (%)
- Exhibits109: Market opportunity By Geographical Landscape ($ million)
- Exhibits110: Data Tables on Market opportunity By Geographical Landscape ($ million)
- Exhibits111: Impact of drivers and challenges in 2023 and 2028
- Exhibits112: Overview on criticality of inputs and factors of differentiation
- Exhibits113: Overview on factors of disruption
- Exhibits114: Impact of key risks on business
- Exhibits115: Companies covered
- Exhibits116: Matrix on companies position and classification
- Exhibits117: Becton Dickinson and Co. - Overview
- Exhibits118: Becton Dickinson and Co. - Business segments
- Exhibits119: Becton Dickinson and Co. - Key news
- Exhibits120: Becton Dickinson and Co. - Key offerings
- Exhibits121: Becton Dickinson and Co. - Segment focus
- Exhibits122: Bio Rad Laboratories Inc. - Overview
- Exhibits123: Bio Rad Laboratories Inc. - Business segments
- Exhibits124: Bio Rad Laboratories Inc. - Key news
- Exhibits125: Bio Rad Laboratories Inc. - Key offerings
- Exhibits126: Bio Rad Laboratories Inc. - Segment focus
- Exhibits127: Bulldog-Bio Inc. - Overview
- Exhibits128: Bulldog-Bio Inc. - Product / Service
- Exhibits129: Bulldog-Bio Inc. - Key offerings
- Exhibits130: Cell Microsystems Inc. - Overview
- Exhibits131: Cell Microsystems Inc. - Product / Service
- Exhibits132: Cell Microsystems Inc. - Key offerings
- Exhibits133: Cytonome ST LLC - Overview
- Exhibits134: Cytonome ST LLC - Product / Service
- Exhibits135: Cytonome ST LLC - Key offerings
- Exhibits136: Danaher Corp. - Overview
- Exhibits137: Danaher Corp. - Business segments
- Exhibits138: Danaher Corp. - Key news
- Exhibits139: Danaher Corp. - Key offerings
- Exhibits140: Danaher Corp. - Segment focus
- Exhibits141: Miltenyi Biotec B.V. and Co. KG - Overview
- Exhibits142: Miltenyi Biotec B.V. and Co. KG - Product / Service
- Exhibits143: Miltenyi Biotec B.V. and Co. KG - Key news
- Exhibits144: Miltenyi Biotec B.V. and Co. KG - Key offerings
- Exhibits145: Namocell Inc. - Overview
- Exhibits146: Namocell Inc. - Product / Service
- Exhibits147: Namocell Inc. - Key offerings
- Exhibits148: NanoCellect Biomedical Inc. - Overview
- Exhibits149: NanoCellect Biomedical Inc. - Product / Service
- Exhibits150: NanoCellect Biomedical Inc. - Key offerings
- Exhibits151: On-Chip Biotechnologies Co. Ltd. - Overview
- Exhibits152: On-Chip Biotechnologies Co. Ltd. - Product / Service
- Exhibits153: On-Chip Biotechnologies Co. Ltd. - Key offerings
- Exhibits154: Sony Group Corp. - Overview
- Exhibits155: Sony Group Corp. - Business segments
- Exhibits156: Sony Group Corp. - Key news
- Exhibits157: Sony Group Corp. - Key offerings
- Exhibits158: Sony Group Corp. - Segment focus
- Exhibits159: STEMCELL Technologies Inc. - Overview
- Exhibits160: STEMCELL Technologies Inc. - Product / Service
- Exhibits161: STEMCELL Technologies Inc. - Key offerings
- Exhibits162: Terumo Corp. - Overview
- Exhibits163: Terumo Corp. - Business segments
- Exhibits164: Terumo Corp. - Key news
- Exhibits165: Terumo Corp. - Key offerings
- Exhibits166: Terumo Corp. - Segment focus
- Exhibits167: Thermo Fisher Scientific Inc. - Overview
- Exhibits168: Thermo Fisher Scientific Inc. - Business segments
- Exhibits169: Thermo Fisher Scientific Inc. - Key news
- Exhibits170: Thermo Fisher Scientific Inc. - Key offerings
- Exhibits171: Thermo Fisher Scientific Inc. - Segment focus
- Exhibits172: Union Biometrica Inc. - Overview
- Exhibits173: Union Biometrica Inc. - Product / Service
- Exhibits174: Union Biometrica Inc. - Key offerings
- Exhibits175: Inclusions checklist
- Exhibits176: Exclusions checklist
- Exhibits177: Currency conversion rates for US$
- Exhibits178: Research methodology
- Exhibits179: Information sources
- Exhibits180: Data validation
- Exhibits181: Validation techniques employed for market sizing
- Exhibits182: Data synthesis
- Exhibits183: 360 degree market analysis
- Exhibits184: List of abbreviations
The cell sorting market is forecasted to grow by USD 142.9 mn during 2023-2028, accelerating at a CAGR of 8.09% during the forecast period. The report on the cell sorting market provides a holistic analysis, market size and forecast, trends, growth drivers, and challenges, as well as vendor analysis covering around 25 vendors.
The report offers an up-to-date analysis regarding the current market scenario, the latest trends and drivers, and the overall market environment. The market is driven by increasing prevalence of chronic diseases, rise in demand for clinical diagnosis, and increasing funding for cell-based research.
Technavio's cell sorting market is segmented as below:
| Market Scope | |
|---|---|
| Base Year | 2024 |
| End Year | 2028 |
| Series Year | 2024-2028 |
| Growth Momentum | Accelerate |
| YOY 2024 | 7.32% |
| CAGR | 8.09% |
| Incremental Value | $142.9mn |
By End-user
- Pharmaceutical and biotechnology companies
- Hospitals and clinical testing laboratories
- Others
By Technology
- Fluorescence-based droplet cell sorting
- Magnetic-activated cell sorting
- Micro-electromechanical systems
By Geographical Landscape
- North America
- Europe
- Asia
- Rest of World (ROW)
This study identifies the growing adoption of genetic engineering in forensic research as one of the prime reasons driving the cell sorting market growth during the next few years. Also, technological advancements in global cell sorting market and rising demand for high-throughput cell sorting will lead to sizable demand in the market.
The report on the cell sorting market covers the following areas:
- Cell sorting market sizing
- Cell sorting market forecast
- Cell sorting market industry analysis
The robust vendor analysis is designed to help clients improve their market position, and in line with this, this report provides a detailed analysis of several leading cell sorting market vendors that include Becton Dickinson and Co., Bio Rad Laboratories Inc., Bulldog-Bio Inc., Cell Microsystems Inc., Cytonome ST LLC, Danaher Corp., Guandong Benice Intelligent Equipment Co.Ltd., Miltenyi Biotec B.V. and Co. KG, Molecular Device LLC, Namocell Inc., NanoCellect Biomedical Inc., On-Chip Biotechnologies Co. Ltd., Semco Infratech Pvt. Ltd., Sony Group Corp., STEMCELL Technologies Inc., Terumo Corp., Thermo Fisher Scientific Inc., Union Biometrica Inc., Xiamen Tmax Battery Equipments Ltd., and Xiamen WinAck Battery Technology Co.. Also, the cell sorting market analysis report includes information on upcoming trends and challenges that will influence market growth. This is to help companies strategize and leverage all forthcoming growth opportunities.
The study was conducted using an objective combination of primary and secondary information including inputs from key participants in the industry. The report contains a comprehensive market and vendor landscape in addition to an analysis of the key vendors.
The publisher presents a detailed picture of the market by the way of study, synthesis, and summation of data from multiple sources by an analysis of key parameters such as profit, pricing, competition, and promotions. It presents various market facets by identifying the key industry influencers. The data presented is comprehensive, reliable, and a result of extensive research - both primary and secondary. The market research reports provide a complete competitive landscape and an in-depth vendor selection methodology and analysis using qualitative and quantitative research to forecast the accurate market growth.
Table of Contents
1 Executive Summary
- 1.1 Market overview
- Executive Summary - Chart on Market Overview
- Executive Summary - Data Table on Market Overview
- Executive Summary - Chart on Global Market Characteristics
- Executive Summary - Chart on Market By Geographical Landscape
- Executive Summary - Chart on Market Segmentation by End-user
- Executive Summary - Chart on Market Segmentation by Technology
- Executive Summary - Chart on Incremental Growth
- Executive Summary - Data Table on Incremental Growth
- Executive Summary - Chart on Company Market Positioning
2 Market Landscape
- 2.1 Market ecosystem
- Parent Market
- Data Table on - Parent Market
- 2.2 Market characteristics
- Market characteristics analysis
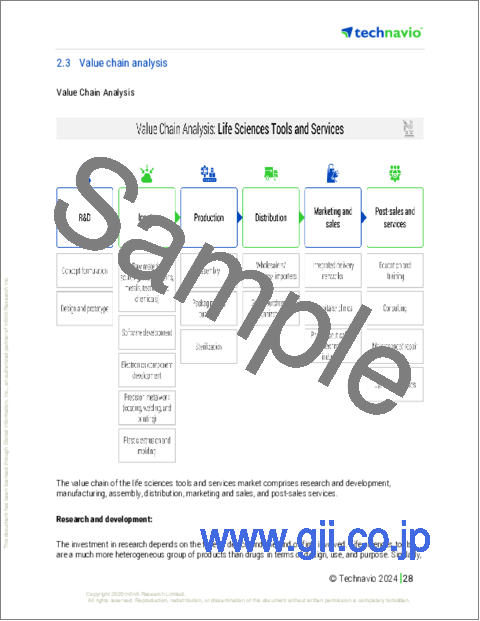
- 2.3 Value chain analysis
- Value Chain Analysis
3 Market Sizing
- 3.1 Market definition
- Offerings of companies included in the market definition
- 3.2 Market segment analysis
- Market segments
- 3.3 Market size 2023
- 3.4 Market outlook: Forecast for 2023-2028
- Chart on Global - Market size and forecast 2023-2028 ($ million)
- Data Table on Global - Market size and forecast 2023-2028 ($ million)
- Chart on Global Market: Year-over-year growth 2023-2028 (%)
- Data Table on Global Market: Year-over-year growth 2023-2028 (%)
4 Historic Market Size
- 4.1 Global Cell Sorting Market 2018 - 2022
- Historic Market Size - Data Table on Global Cell Sorting Market 2018 - 2022 ($ million)
- 4.2 End-user segment analysis 2018 - 2022
- Historic Market Size - End-user Segment 2018 - 2022 ($ million)
- 4.3 Technology segment analysis 2018 - 2022
- Historic Market Size - Technology Segment 2018 - 2022 ($ million)
- 4.4 Geography segment analysis 2018 - 2022
- Historic Market Size - Geography Segment 2018 - 2022 ($ million)
- 4.5 Country segment analysis 2018 - 2022
- Historic Market Size - Country Segment 2018 - 2022 ($ million)
5 Five Forces Analysis
- 5.1 Five forces summary
- Five forces analysis - Comparison between 2023 and 2028
- 5.2 Bargaining power of buyers
- Bargaining power of buyers - Impact of key factors 2023 and 2028
- 5.3 Bargaining power of suppliers
- Bargaining power of suppliers - Impact of key factors in 2023 and 2028
- 5.4 Threat of new entrants
- Threat of new entrants - Impact of key factors in 2023 and 2028
- 5.5 Threat of substitutes
- Threat of substitutes - Impact of key factors in 2023 and 2028
- 5.6 Threat of rivalry
- Threat of rivalry - Impact of key factors in 2023 and 2028
- 5.7 Market condition
- Chart on Market condition - Five forces 2023 and 2028
6 Market Segmentation by End-user
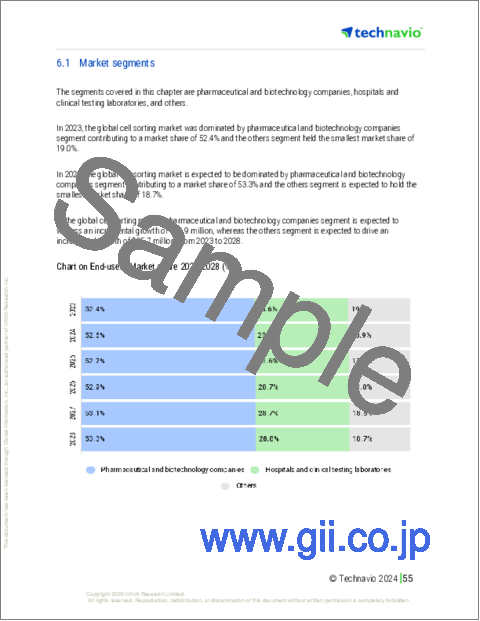
- 6.1 Market segments
- Chart on End-user - Market share 2023-2028 (%)
- Data Table on End-user - Market share 2023-2028 (%)
- 6.2 Comparison by End-user
- Chart on Comparison by End-user
- Data Table on Comparison by End-user
- 6.3 Pharmaceutical and biotechnology companies - Market size and forecast 2023-2028
- Chart on Pharmaceutical and biotechnology companies - Market size and forecast 2023-2028 ($ million)
- Data Table on Pharmaceutical and biotechnology companies - Market size and forecast 2023-2028 ($ million)
- Chart on Pharmaceutical and biotechnology companies - Year-over-year growth 2023-2028 (%)
- Data Table on Pharmaceutical and biotechnology companies - Year-over-year growth 2023-2028 (%)
- 6.4 Hospitals and clinical testing laboratories - Market size and forecast 2023-2028
- Chart on Hospitals and clinical testing laboratories - Market size and forecast 2023-2028 ($ million)
- Data Table on Hospitals and clinical testing laboratories - Market size and forecast 2023-2028 ($ million)
- Chart on Hospitals and clinical testing laboratories - Year-over-year growth 2023-2028 (%)
- Data Table on Hospitals and clinical testing laboratories - Year-over-year growth 2023-2028 (%)
- 6.5 Others - Market size and forecast 2023-2028
- Chart on Others - Market size and forecast 2023-2028 ($ million)
- Data Table on Others - Market size and forecast 2023-2028 ($ million)
- Chart on Others - Year-over-year growth 2023-2028 (%)
- Data Table on Others - Year-over-year growth 2023-2028 (%)
- 6.6 Market opportunity by End-user
- Market opportunity by End-user ($ million)
- Data Table on Market opportunity by End-user ($ million)
7 Market Segmentation by Technology
- 7.1 Market segments
- Chart on Technology - Market share 2023-2028 (%)
- Data Table on Technology - Market share 2023-2028 (%)
- 7.2 Comparison by Technology
- Chart on Comparison by Technology
- Data Table on Comparison by Technology
- 7.3 Fluorescence-based droplet cell sorting - Market size and forecast 2023-2028
- Chart on Fluorescence-based droplet cell sorting - Market size and forecast 2023-2028 ($ million)
- Data Table on Fluorescence-based droplet cell sorting - Market size and forecast 2023-2028 ($ million)
- Chart on Fluorescence-based droplet cell sorting - Year-over-year growth 2023-2028 (%)
- Data Table on Fluorescence-based droplet cell sorting - Year-over-year growth 2023-2028 (%)
- 7.4 Magnetic-activated cell sorting - Market size and forecast 2023-2028
- Chart on Magnetic-activated cell sorting - Market size and forecast 2023-2028 ($ million)
- Data Table on Magnetic-activated cell sorting - Market size and forecast 2023-2028 ($ million)
- Chart on Magnetic-activated cell sorting - Year-over-year growth 2023-2028 (%)
- Data Table on Magnetic-activated cell sorting - Year-over-year growth 2023-2028 (%)
- 7.5 Micro-electromechanical systems - Market size and forecast 2023-2028
- Chart on Micro-electromechanical systems - Market size and forecast 2023-2028 ($ million)
- Data Table on Micro-electromechanical systems - Market size and forecast 2023-2028 ($ million)
- Chart on Micro-electromechanical systems - Year-over-year growth 2023-2028 (%)
- Data Table on Micro-electromechanical systems - Year-over-year growth 2023-2028 (%)
- 7.6 Market opportunity by Technology
- Market opportunity by Technology ($ million)
- Data Table on Market opportunity by Technology ($ million)
8 Customer Landscape
- 8.1 Customer landscape overview
- Analysis of price sensitivity, lifecycle, customer purchase basket, adoption rates, and purchase criteria
9 Geographic Landscape
- 9.1 Geographic segmentation
- Chart on Market share By Geographical Landscape 2023-2028 (%)
- Data Table on Market share By Geographical Landscape 2023-2028 (%)
- 9.2 Geographic comparison
- Chart on Geographic comparison
- Data Table on Geographic comparison
- 9.3 North America - Market size and forecast 2023-2028
- Chart on North America - Market size and forecast 2023-2028 ($ million)
- Data Table on North America - Market size and forecast 2023-2028 ($ million)
- Chart on North America - Year-over-year growth 2023-2028 (%)
- Data Table on North America - Year-over-year growth 2023-2028 (%)
- 9.4 Europe - Market size and forecast 2023-2028
- Chart on Europe - Market size and forecast 2023-2028 ($ million)
- Data Table on Europe - Market size and forecast 2023-2028 ($ million)
- Chart on Europe - Year-over-year growth 2023-2028 (%)
- Data Table on Europe - Year-over-year growth 2023-2028 (%)
- 9.5 Asia - Market size and forecast 2023-2028
- Chart on Asia - Market size and forecast 2023-2028 ($ million)
- Data Table on Asia - Market size and forecast 2023-2028 ($ million)
- Chart on Asia - Year-over-year growth 2023-2028 (%)
- Data Table on Asia - Year-over-year growth 2023-2028 (%)
- 9.6 Rest of World (ROW) - Market size and forecast 2023-2028
- Chart on Rest of World (ROW) - Market size and forecast 2023-2028 ($ million)
- Data Table on Rest of World (ROW) - Market size and forecast 2023-2028 ($ million)
- Chart on Rest of World (ROW) - Year-over-year growth 2023-2028 (%)
- Data Table on Rest of World (ROW) - Year-over-year growth 2023-2028 (%)
- 9.7 US - Market size and forecast 2023-2028
- Chart on US - Market size and forecast 2023-2028 ($ million)
- Data Table on US - Market size and forecast 2023-2028 ($ million)
- Chart on US - Year-over-year growth 2023-2028 (%)
- Data Table on US - Year-over-year growth 2023-2028 (%)
- 9.8 China - Market size and forecast 2023-2028
- Chart on China - Market size and forecast 2023-2028 ($ million)
- Data Table on China - Market size and forecast 2023-2028 ($ million)
- Chart on China - Year-over-year growth 2023-2028 (%)
- Data Table on China - Year-over-year growth 2023-2028 (%)
- 9.9 Germany - Market size and forecast 2023-2028
- Chart on Germany - Market size and forecast 2023-2028 ($ million)
- Data Table on Germany - Market size and forecast 2023-2028 ($ million)
- Chart on Germany - Year-over-year growth 2023-2028 (%)
- Data Table on Germany - Year-over-year growth 2023-2028 (%)
- 9.10 UK - Market size and forecast 2023-2028
- Chart on UK - Market size and forecast 2023-2028 ($ million)
- Data Table on UK - Market size and forecast 2023-2028 ($ million)
- Chart on UK - Year-over-year growth 2023-2028 (%)
- Data Table on UK - Year-over-year growth 2023-2028 (%)
- 9.11 Japan - Market size and forecast 2023-2028
- Chart on Japan - Market size and forecast 2023-2028 ($ million)
- Data Table on Japan - Market size and forecast 2023-2028 ($ million)
- Chart on Japan - Year-over-year growth 2023-2028 (%)
- Data Table on Japan - Year-over-year growth 2023-2028 (%)
- 9.12 Market opportunity By Geographical Landscape
- Market opportunity By Geographical Landscape ($ million)
- Data Tables on Market opportunity By Geographical Landscape ($ million)
10 Drivers, Challenges, and Opportunity/Restraints
- 10.1 Market drivers
- 10.2 Market challenges
- 10.3 Impact of drivers and challenges
- Impact of drivers and challenges in 2023 and 2028
- 10.4 Market opportunities/restraints
11 Competitive Landscape
- 11.1 Overview
- 11.2 Competitive Landscape
- Overview on criticality of inputs and factors of differentiation
- 11.3 Landscape disruption
- Overview on factors of disruption
- 11.4 Industry risks
- Impact of key risks on business
12 Competitive Analysis
- 12.1 Companies profiled
- Companies covered
- 12.2 Market positioning of companies
- Matrix on companies position and classification
- 12.3 Becton Dickinson and Co.
- Becton Dickinson and Co. - Overview
- Becton Dickinson and Co. - Business segments
- Becton Dickinson and Co. - Key news
- Becton Dickinson and Co. - Key offerings
- Becton Dickinson and Co. - Segment focus
- 12.4 Bio Rad Laboratories Inc.
- Bio Rad Laboratories Inc. - Overview
- Bio Rad Laboratories Inc. - Business segments
- Bio Rad Laboratories Inc. - Key news
- Bio Rad Laboratories Inc. - Key offerings
- Bio Rad Laboratories Inc. - Segment focus
- 12.5 Bulldog-Bio Inc.
- Bulldog-Bio Inc. - Overview
- Bulldog-Bio Inc. - Product / Service
- Bulldog-Bio Inc. - Key offerings
- 12.6 Cell Microsystems Inc.
- Cell Microsystems Inc. - Overview
- Cell Microsystems Inc. - Product / Service
- Cell Microsystems Inc. - Key offerings
- 12.7 Cytonome ST LLC
- Cytonome ST LLC - Overview
- Cytonome ST LLC - Product / Service
- Cytonome ST LLC - Key offerings
- 12.8 Danaher Corp.
- Danaher Corp. - Overview
- Danaher Corp. - Business segments
- Danaher Corp. - Key news
- Danaher Corp. - Key offerings
- Danaher Corp. - Segment focus
- 12.9 Miltenyi Biotec B.V. and Co. KG
- Miltenyi Biotec B.V. and Co. KG - Overview
- Miltenyi Biotec B.V. and Co. KG - Product / Service
- Miltenyi Biotec B.V. and Co. KG - Key news
- Miltenyi Biotec B.V. and Co. KG - Key offerings
- 12.10 Namocell Inc.
- Namocell Inc. - Overview
- Namocell Inc. - Product / Service
- Namocell Inc. - Key offerings
- 12.11 NanoCellect Biomedical Inc.
- NanoCellect Biomedical Inc. - Overview
- NanoCellect Biomedical Inc. - Product / Service
- NanoCellect Biomedical Inc. - Key offerings
- 12.12 On-Chip Biotechnologies Co. Ltd.
- On-Chip Biotechnologies Co. Ltd. - Overview
- On-Chip Biotechnologies Co. Ltd. - Product / Service
- On-Chip Biotechnologies Co. Ltd. - Key offerings
- 12.13 Sony Group Corp.
- Sony Group Corp. - Overview
- Sony Group Corp. - Business segments
- Sony Group Corp. - Key news
- Sony Group Corp. - Key offerings
- Sony Group Corp. - Segment focus
- 12.14 STEMCELL Technologies Inc.
- STEMCELL Technologies Inc. - Overview
- STEMCELL Technologies Inc. - Product / Service
- STEMCELL Technologies Inc. - Key offerings
- 12.15 Terumo Corp.
- Terumo Corp. - Overview
- Terumo Corp. - Business segments
- Terumo Corp. - Key news
- Terumo Corp. - Key offerings
- Terumo Corp. - Segment focus
- 12.16 Thermo Fisher Scientific Inc.
- Thermo Fisher Scientific Inc. - Overview
- Thermo Fisher Scientific Inc. - Business segments
- Thermo Fisher Scientific Inc. - Key news
- Thermo Fisher Scientific Inc. - Key offerings
- Thermo Fisher Scientific Inc. - Segment focus
- 12.17 Union Biometrica Inc.
- Union Biometrica Inc. - Overview
- Union Biometrica Inc. - Product / Service
- Union Biometrica Inc. - Key offerings
13 Appendix
- 13.1 Scope of the report
- 13.2 Inclusions and exclusions checklist
- Inclusions checklist
- Exclusions checklist
- 13.3 Currency conversion rates for US$
- Currency conversion rates for US$
- 13.4 Research methodology
- Research methodology
- 13.5 Data procurement
- Information sources
- 13.6 Data validation
- Data validation
- 13.7 Validation techniques employed for market sizing
- Validation techniques employed for market sizing
- 13.8 Data synthesis
- Data synthesis
- 13.9 360 degree market analysis
- 360 degree market analysis
- 13.10 List of abbreviations
- List of abbreviations

