|
|
市場調査レポート
商品コード
1558584
補償光学の世界市場、2024~2028年Global Adaptive Optics Market 2024-2028 |
||||||
|
|||||||
カスタマイズ可能
|
|||||||


| 補償光学の世界市場、2024~2028年 |
|
出版日: 2024年08月19日
発行: TechNavio
ページ情報: 英文 160 Pages
納期: 即納可能
|

全表示
- 概要
- 図表
- 目次
補償光学市場は2023~2028年に92億4,940万米ドル、予測期間中のCAGRは52.65%で成長すると予測されます。
当レポートでは、補償光学市場の全体的な分析、市場規模・予測、動向、成長促進要因、課題、約25のベンダーを網羅したベンダー分析などを掲載しています。
現在の市場シナリオ、最新動向と促進要因、市場環境全体に関する最新分析を提供しています。市場を牽引しているのは、補償光学による高速イメージングの提供、臨床アプリケーションにおける補償光学、天文学における研究開発活動の拡大です。
| 市場範囲 | |
|---|---|
| 基準年 | 2024年 |
| 終了年 | 2028年 |
| 予測期間 | 2024~2028年 |
| 成長モメンタム | 加速 |
| 前年比[2024年] | 37.36% |
| CAGR | 52.65% |
| 増分額 | 92億4,940万米ドル |
本調査では、今後数年間の補償光学市場成長を牽引する主要要因の1つとして、サーマルイメージングを搭載したナイトビジョンデバイスの出現を挙げています。また、凸レンズと凹レンズのアプリケーションの増加、カメラとそのレンズの販売拡大が市場の大きな需要につながります。
目次
第1章 エグゼクティブサマリー
- 市場概要
第2章 市場情勢
- 市場エコシステム
- 市場の特徴
- バリューチェーン分析
第3章 市場規模の評価
- 市場の定義
- 市場セグメント分析
- 市場規模 2023年
- 市場の展望 2023~2028年
第4章 市場規模実績
- 補償光学の世界市場 2018~2022年
- 用途別セグメント分析 2018~2022年
- 部品セグメント分析 2018~2022年
- 地域別セグメント分析 2018~2022年
- 国別セグメント分析 2018~2022年
第5章 ファイブフォース分析
- ファイブフォースの要約
- 買い手の交渉力
- 供給企業の交渉力
- 新規参入業者の脅威
- 代替品の脅威
- 競争の脅威
- 市況
第6章 市場セグメンテーション:用途別
- 市場セグメンテーション
- 比較:用途別
- 軍事と防衛:市場規模と予測 2023~2028年
- バイオメディカル:市場規模と予測 2023~2028年
- 工業と製造業:市場規模と予測 2023~2028年
- その他:市場規模と予測 2023~2028年
- 市場機会:用途別
第7章 市場セグメンテーション:部品別
- 市場セグメンテーション
- 比較:部品別
- 波面センサー:市場規模と予測 2023~2028年
- 波面変調器:市場規模と予測 2023~2028年
- 制御システム:市場規模と予測 2023~2028年
- 市場機会:部品別
第8章 顧客情勢
- 顧客情勢概要
第9章 地域別情勢
- 地域別セグメンテーション
- 比較:地域別
- 北米:市場規模と予測 2023~2028年
- アジア太平洋:市場規模と予測 2023~2028年
- 欧州:市場規模と予測 2023~2028年
- 南米:市場規模と予測 2023~2028年
- 中東・アフリカ:市場規模と予測 2023~2028年
- 米国:市場規模と予測 2023~2028年
- 中国:市場規模と予測 2023~2028年
- フランス:市場規模と予測 2023~2028年
- 日本:市場規模と予測 2023~2028年
- ドイツ:市場規模と予測 2023~2028年
- 市場機会:地域情勢別
第10章 促進要因・課題・機会・抑制要因
- 市場促進要因
- 市場課題
- 促進要因と課題の影響
- 市場の機会・抑制要因
第11章 競合情勢
- 概要
- 競合情勢
- 混乱の状況
- 業界のリスク
第12章 競合分析
- 企業プロファイル
- 企業の市場ポジショニング
- Adaptica Srl
- Alpao SAS
- Benchmark Electronics Inc.
- Boston Micromachines Corp.
- Flexible Optical BV
- Hamamatsu Photonics KK
- HOLOEYE Photonics AG
- Imagine Optic
- Iris Ao Inc.
- Northrop Grumman Corp.
- PHASICS SA
- Synopsys Inc.
- Teledyne Technologies Inc.
- Thorlabs Inc.
- Turn Ltd.
第13章 付録
Exhibits:
- Exhibits1: Executive Summary - Chart on Market Overview
- Exhibits2: Executive Summary - Data Table on Market Overview
- Exhibits3: Executive Summary - Chart on Global Market Characteristics
- Exhibits4: Executive Summary - Chart on Market By Geographical Landscape
- Exhibits5: Executive Summary - Chart on Market Segmentation by Application
- Exhibits6: Executive Summary - Chart on Market Segmentation by Component
- Exhibits7: Executive Summary - Chart on Incremental Growth
- Exhibits8: Executive Summary - Data Table on Incremental Growth
- Exhibits9: Executive Summary - Chart on Company Market Positioning
- Exhibits10: Parent Market
- Exhibits11: Data Table on - Parent Market
- Exhibits12: Market characteristics analysis
- Exhibits13: Value Chain Analysis
- Exhibits14: Offerings of companies included in the market definition
- Exhibits15: Market segments
- Exhibits16: Chart on Global - Market size and forecast 2023-2028 ($ million)
- Exhibits17: Data Table on Global - Market size and forecast 2023-2028 ($ million)
- Exhibits18: Chart on Global Market: Year-over-year growth 2023-2028 (%)
- Exhibits19: Data Table on Global Market: Year-over-year growth 2023-2028 (%)
- Exhibits20: Historic Market Size - Data Table on Global Adaptive Optics Market 2018 - 2022 ($ million)
- Exhibits21: Historic Market Size - Application Segment 2018 - 2022 ($ million)
- Exhibits22: Historic Market Size - Component Segment 2018 - 2022 ($ million)
- Exhibits23: Historic Market Size - Geography Segment 2018 - 2022 ($ million)
- Exhibits24: Historic Market Size - Country Segment 2018 - 2022 ($ million)
- Exhibits25: Five forces analysis - Comparison between 2023 and 2028
- Exhibits26: Bargaining power of buyers - Impact of key factors 2023 and 2028
- Exhibits27: Bargaining power of suppliers - Impact of key factors in 2023 and 2028
- Exhibits28: Threat of new entrants - Impact of key factors in 2023 and 2028
- Exhibits29: Threat of substitutes - Impact of key factors in 2023 and 2028
- Exhibits30: Threat of rivalry - Impact of key factors in 2023 and 2028
- Exhibits31: Chart on Market condition - Five forces 2023 and 2028
- Exhibits32: Chart on Application - Market share 2023-2028 (%)
- Exhibits33: Data Table on Application - Market share 2023-2028 (%)
- Exhibits34: Chart on Comparison by Application
- Exhibits35: Data Table on Comparison by Application
- Exhibits36: Chart on Military and defense - Market size and forecast 2023-2028 ($ million)
- Exhibits37: Data Table on Military and defense - Market size and forecast 2023-2028 ($ million)
- Exhibits38: Chart on Military and defense - Year-over-year growth 2023-2028 (%)
- Exhibits39: Data Table on Military and defense - Year-over-year growth 2023-2028 (%)
- Exhibits40: Chart on Biomedical - Market size and forecast 2023-2028 ($ million)
- Exhibits41: Data Table on Biomedical - Market size and forecast 2023-2028 ($ million)
- Exhibits42: Chart on Biomedical - Year-over-year growth 2023-2028 (%)
- Exhibits43: Data Table on Biomedical - Year-over-year growth 2023-2028 (%)
- Exhibits44: Chart on Industrial and manufacturing - Market size and forecast 2023-2028 ($ million)
- Exhibits45: Data Table on Industrial and manufacturing - Market size and forecast 2023-2028 ($ million)
- Exhibits46: Chart on Industrial and manufacturing - Year-over-year growth 2023-2028 (%)
- Exhibits47: Data Table on Industrial and manufacturing - Year-over-year growth 2023-2028 (%)
- Exhibits48: Chart on Others - Market size and forecast 2023-2028 ($ million)
- Exhibits49: Data Table on Others - Market size and forecast 2023-2028 ($ million)
- Exhibits50: Chart on Others - Year-over-year growth 2023-2028 (%)
- Exhibits51: Data Table on Others - Year-over-year growth 2023-2028 (%)
- Exhibits52: Market opportunity by Application ($ million)
- Exhibits53: Data Table on Market opportunity by Application ($ million)
- Exhibits54: Chart on Component - Market share 2023-2028 (%)
- Exhibits55: Data Table on Component - Market share 2023-2028 (%)
- Exhibits56: Chart on Comparison by Component
- Exhibits57: Data Table on Comparison by Component
- Exhibits58: Chart on Wavefront sensors - Market size and forecast 2023-2028 ($ million)
- Exhibits59: Data Table on Wavefront sensors - Market size and forecast 2023-2028 ($ million)
- Exhibits60: Chart on Wavefront sensors - Year-over-year growth 2023-2028 (%)
- Exhibits61: Data Table on Wavefront sensors - Year-over-year growth 2023-2028 (%)
- Exhibits62: Chart on Wavefront modulators - Market size and forecast 2023-2028 ($ million)
- Exhibits63: Data Table on Wavefront modulators - Market size and forecast 2023-2028 ($ million)
- Exhibits64: Chart on Wavefront modulators - Year-over-year growth 2023-2028 (%)
- Exhibits65: Data Table on Wavefront modulators - Year-over-year growth 2023-2028 (%)
- Exhibits66: Chart on Control system - Market size and forecast 2023-2028 ($ million)
- Exhibits67: Data Table on Control system - Market size and forecast 2023-2028 ($ million)
- Exhibits68: Chart on Control system - Year-over-year growth 2023-2028 (%)
- Exhibits69: Data Table on Control system - Year-over-year growth 2023-2028 (%)
- Exhibits70: Market opportunity by Component ($ million)
- Exhibits71: Data Table on Market opportunity by Component ($ million)
- Exhibits72: Analysis of price sensitivity, lifecycle, customer purchase basket, adoption rates, and purchase criteria
- Exhibits73: Chart on Market share By Geographical Landscape 2023-2028 (%)
- Exhibits74: Data Table on Market share By Geographical Landscape 2023-2028 (%)
- Exhibits75: Chart on Geographic comparison
- Exhibits76: Data Table on Geographic comparison
- Exhibits77: Chart on North America - Market size and forecast 2023-2028 ($ million)
- Exhibits78: Data Table on North America - Market size and forecast 2023-2028 ($ million)
- Exhibits79: Chart on North America - Year-over-year growth 2023-2028 (%)
- Exhibits80: Data Table on North America - Year-over-year growth 2023-2028 (%)
- Exhibits81: Chart on APAC - Market size and forecast 2023-2028 ($ million)
- Exhibits82: Data Table on APAC - Market size and forecast 2023-2028 ($ million)
- Exhibits83: Chart on APAC - Year-over-year growth 2023-2028 (%)
- Exhibits84: Data Table on APAC - Year-over-year growth 2023-2028 (%)
- Exhibits85: Chart on Europe - Market size and forecast 2023-2028 ($ million)
- Exhibits86: Data Table on Europe - Market size and forecast 2023-2028 ($ million)
- Exhibits87: Chart on Europe - Year-over-year growth 2023-2028 (%)
- Exhibits88: Data Table on Europe - Year-over-year growth 2023-2028 (%)
- Exhibits89: Chart on South America - Market size and forecast 2023-2028 ($ million)
- Exhibits90: Data Table on South America - Market size and forecast 2023-2028 ($ million)
- Exhibits91: Chart on South America - Year-over-year growth 2023-2028 (%)
- Exhibits92: Data Table on South America - Year-over-year growth 2023-2028 (%)
- Exhibits93: Chart on Middle East and Africa - Market size and forecast 2023-2028 ($ million)
- Exhibits94: Data Table on Middle East and Africa - Market size and forecast 2023-2028 ($ million)
- Exhibits95: Chart on Middle East and Africa - Year-over-year growth 2023-2028 (%)
- Exhibits96: Data Table on Middle East and Africa - Year-over-year growth 2023-2028 (%)
- Exhibits97: Chart on US - Market size and forecast 2023-2028 ($ million)
- Exhibits98: Data Table on US - Market size and forecast 2023-2028 ($ million)
- Exhibits99: Chart on US - Year-over-year growth 2023-2028 (%)
- Exhibits100: Data Table on US - Year-over-year growth 2023-2028 (%)
- Exhibits101: Chart on China - Market size and forecast 2023-2028 ($ million)
- Exhibits102: Data Table on China - Market size and forecast 2023-2028 ($ million)
- Exhibits103: Chart on China - Year-over-year growth 2023-2028 (%)
- Exhibits104: Data Table on China - Year-over-year growth 2023-2028 (%)
- Exhibits105: Chart on France - Market size and forecast 2023-2028 ($ million)
- Exhibits106: Data Table on France - Market size and forecast 2023-2028 ($ million)
- Exhibits107: Chart on France - Year-over-year growth 2023-2028 (%)
- Exhibits108: Data Table on France - Year-over-year growth 2023-2028 (%)
- Exhibits109: Chart on Japan - Market size and forecast 2023-2028 ($ million)
- Exhibits110: Data Table on Japan - Market size and forecast 2023-2028 ($ million)
- Exhibits111: Chart on Japan - Year-over-year growth 2023-2028 (%)
- Exhibits112: Data Table on Japan - Year-over-year growth 2023-2028 (%)
- Exhibits113: Chart on Germany - Market size and forecast 2023-2028 ($ million)
- Exhibits114: Data Table on Germany - Market size and forecast 2023-2028 ($ million)
- Exhibits115: Chart on Germany - Year-over-year growth 2023-2028 (%)
- Exhibits116: Data Table on Germany - Year-over-year growth 2023-2028 (%)
- Exhibits117: Market opportunity By Geographical Landscape ($ million)
- Exhibits118: Data Tables on Market opportunity By Geographical Landscape ($ million)
- Exhibits119: Impact of drivers and challenges in 2023 and 2028
- Exhibits120: Overview on criticality of inputs and factors of differentiation
- Exhibits121: Overview on factors of disruption
- Exhibits122: Impact of key risks on business
- Exhibits123: Companies covered
- Exhibits124: Matrix on companies position and classification
- Exhibits125: Adaptica Srl - Overview
- Exhibits126: Adaptica Srl - Product / Service
- Exhibits127: Adaptica Srl - Key offerings
- Exhibits128: Alpao SAS - Overview
- Exhibits129: Alpao SAS - Product / Service
- Exhibits130: Alpao SAS - Key offerings
- Exhibits131: Benchmark Electronics Inc. - Overview
- Exhibits132: Benchmark Electronics Inc. - Business segments
- Exhibits133: Benchmark Electronics Inc. - Key news
- Exhibits134: Benchmark Electronics Inc. - Key offerings
- Exhibits135: Benchmark Electronics Inc. - Segment focus
- Exhibits136: Boston Micromachines Corp. - Overview
- Exhibits137: Boston Micromachines Corp. - Product / Service
- Exhibits138: Boston Micromachines Corp. - Key offerings
- Exhibits139: Flexible Optical BV - Overview
- Exhibits140: Flexible Optical BV - Product / Service
- Exhibits141: Flexible Optical BV - Key offerings
- Exhibits142: Hamamatsu Photonics KK - Overview
- Exhibits143: Hamamatsu Photonics KK - Business segments
- Exhibits144: Hamamatsu Photonics KK - Key news
- Exhibits145: Hamamatsu Photonics KK - Key offerings
- Exhibits146: Hamamatsu Photonics KK - Segment focus
- Exhibits147: HOLOEYE Photonics AG - Overview
- Exhibits148: HOLOEYE Photonics AG - Product / Service
- Exhibits149: HOLOEYE Photonics AG - Key offerings
- Exhibits150: Imagine Optic - Overview
- Exhibits151: Imagine Optic - Product / Service
- Exhibits152: Imagine Optic - Key offerings
- Exhibits153: Iris Ao Inc. - Overview
- Exhibits154: Iris Ao Inc. - Product / Service
- Exhibits155: Iris Ao Inc. - Key offerings
- Exhibits156: Northrop Grumman Corp. - Overview
- Exhibits157: Northrop Grumman Corp. - Business segments
- Exhibits158: Northrop Grumman Corp. - Key news
- Exhibits159: Northrop Grumman Corp. - Key offerings
- Exhibits160: Northrop Grumman Corp. - Segment focus
- Exhibits161: PHASICS SA - Overview
- Exhibits162: PHASICS SA - Product / Service
- Exhibits163: PHASICS SA - Key offerings
- Exhibits164: Synopsys Inc. - Overview
- Exhibits165: Synopsys Inc. - Business segments
- Exhibits166: Synopsys Inc. - Key news
- Exhibits167: Synopsys Inc. - Key offerings
- Exhibits168: Synopsys Inc. - Segment focus
- Exhibits169: Teledyne Technologies Inc. - Overview
- Exhibits170: Teledyne Technologies Inc. - Business segments
- Exhibits171: Teledyne Technologies Inc. - Key news
- Exhibits172: Teledyne Technologies Inc. - Key offerings
- Exhibits173: Teledyne Technologies Inc. - Segment focus
- Exhibits174: Thorlabs Inc. - Overview
- Exhibits175: Thorlabs Inc. - Product / Service
- Exhibits176: Thorlabs Inc. - Key offerings
- Exhibits177: Turn Ltd. - Overview
- Exhibits178: Turn Ltd. - Product / Service
- Exhibits179: Turn Ltd. - Key offerings
- Exhibits180: Inclusions checklist
- Exhibits181: Exclusions checklist
- Exhibits182: Currency conversion rates for US$
- Exhibits183: Research methodology
- Exhibits184: Information sources
- Exhibits185: Data validation
- Exhibits186: Validation techniques employed for market sizing
- Exhibits187: Data synthesis
- Exhibits188: 360 degree market analysis
- Exhibits189: List of abbreviations
The adaptive optics market is forecasted to grow by USD 9249.4 mn during 2023-2028, accelerating at a CAGR of 52.65% during the forecast period. The report on the adaptive optics market provides a holistic analysis, market size and forecast, trends, growth drivers, and challenges, as well as vendor analysis covering around 25 vendors.
The report offers an up-to-date analysis regarding the current market scenario, the latest trends and drivers, and the overall market environment. The market is driven by adaptive optics provide high-speed imaging, adaptive optics in clinical applications, and expanding research and development activities in astronomy.
Technavio's adaptive optics market is segmented as below:
| Market Scope | |
|---|---|
| Base Year | 2024 |
| End Year | 2028 |
| Series Year | 2024-2028 |
| Growth Momentum | Accelerate |
| YOY 2024 | 37.36% |
| CAGR | 52.65% |
| Incremental Value | $9249.4 mn |
By Application
- Military and defense
- Biomedical
- Industrial and manufacturing
- Others
By Component
- Wavefront sensors
- Wavefront modulators
- Control system
By Geographical Landscape
- North America
- APAC
- Europe
- South America
- Middle East and Africa
This study identifies the emergence of night vision devices with thermal imaging as one of the prime reasons driving the adaptive optics market growth during the next few years. Also, rise in application of convex and concave lenses and growing sales of cameras and their lenses will lead to sizable demand in the market.
The report on the adaptive optics market covers the following areas:
- Adaptive optics market sizing
- Adaptive optics market forecast
- Adaptive optics market industry analysis
The robust vendor analysis is designed to help clients improve their market position, and in line with this, this report provides a detailed analysis of several leading adaptive optics market vendors that include Active Optical Systems LLC, Adaptica Srl, Alpao SAS, Baker Adaptive Optics, Benchmark Electronics Inc., Boston Micromachines Corp., Edmund Optics Inc., Electro Optic Systems Pty Ltd., Flexible Optical BV, Hamamatsu Photonics KK, HOLOEYE Photonics AG, Imagine Eyes, Imagine Optic, Iris Ao Inc., Northrop Grumman Corp., PHASICS SA, Synopsys Inc., Teledyne Technologies Inc., Thorlabs Inc., and Turn Ltd.. Also, the adaptive optics market analysis report includes information on upcoming trends and challenges that will influence market growth. This is to help companies strategize and leverage all forthcoming growth opportunities.
The study was conducted using an objective combination of primary and secondary information including inputs from key participants in the industry. The report contains a comprehensive market and vendor landscape in addition to an analysis of the key vendors.
The publisher presents a detailed picture of the market by the way of study, synthesis, and summation of data from multiple sources by an analysis of key parameters such as profit, pricing, competition, and promotions. It presents various market facets by identifying the key industry influencers. The data presented is comprehensive, reliable, and a result of extensive research - both primary and secondary. The market research reports provide a complete competitive landscape and an in-depth vendor selection methodology and analysis using qualitative and quantitative research to forecast the accurate market growth.
Table of Contents
1 Executive Summary
- 1.1 Market overview
- Executive Summary - Chart on Market Overview
- Executive Summary - Data Table on Market Overview
- Executive Summary - Chart on Global Market Characteristics
- Executive Summary - Chart on Market By Geographical Landscape
- Executive Summary - Chart on Market Segmentation by Application
- Executive Summary - Chart on Market Segmentation by Component
- Executive Summary - Chart on Incremental Growth
- Executive Summary - Data Table on Incremental Growth
- Executive Summary - Chart on Company Market Positioning
2 Market Landscape
- 2.1 Market ecosystem
- Parent Market
- Data Table on - Parent Market
- 2.2 Market characteristics
- Market characteristics analysis
- 2.3 Value chain analysis
- Value Chain Analysis
3 Market Sizing
- 3.1 Market definition
- Offerings of companies included in the market definition
- 3.2 Market segment analysis
- Market segments
- 3.3 Market size 2023
- 3.4 Market outlook: Forecast for 2023-2028
- Chart on Global - Market size and forecast 2023-2028 ($ million)
- Data Table on Global - Market size and forecast 2023-2028 ($ million)
- Chart on Global Market: Year-over-year growth 2023-2028 (%)
- Data Table on Global Market: Year-over-year growth 2023-2028 (%)
4 Historic Market Size
- 4.1 Global Adaptive Optics Market 2018 - 2022
- Historic Market Size - Data Table on Global Adaptive Optics Market 2018 - 2022 ($ million)
- 4.2 Application segment analysis 2018 - 2022
- Historic Market Size - Application Segment 2018 - 2022 ($ million)
- 4.3 Component segment analysis 2018 - 2022
- Historic Market Size - Component Segment 2018 - 2022 ($ million)
- 4.4 Geography segment analysis 2018 - 2022
- Historic Market Size - Geography Segment 2018 - 2022 ($ million)
- 4.5 Country segment analysis 2018 - 2022
- Historic Market Size - Country Segment 2018 - 2022 ($ million)
5 Five Forces Analysis
- 5.1 Five forces summary
- Five forces analysis - Comparison between 2023 and 2028
- 5.2 Bargaining power of buyers
- Bargaining power of buyers - Impact of key factors 2023 and 2028
- 5.3 Bargaining power of suppliers
- Bargaining power of suppliers - Impact of key factors in 2023 and 2028
- 5.4 Threat of new entrants
- Threat of new entrants - Impact of key factors in 2023 and 2028
- 5.5 Threat of substitutes
- Threat of substitutes - Impact of key factors in 2023 and 2028
- 5.6 Threat of rivalry
- Threat of rivalry - Impact of key factors in 2023 and 2028
- 5.7 Market condition
- Chart on Market condition - Five forces 2023 and 2028
6 Market Segmentation by Application
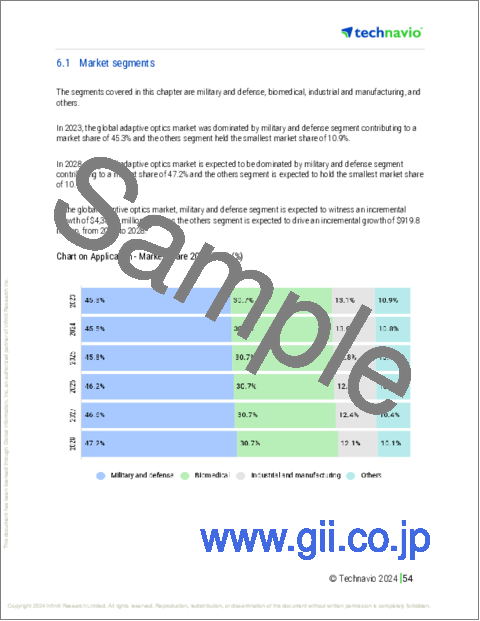
- 6.1 Market segments
- Chart on Application - Market share 2023-2028 (%)
- Data Table on Application - Market share 2023-2028 (%)
- 6.2 Comparison by Application
- Chart on Comparison by Application
- Data Table on Comparison by Application
- 6.3 Military and defense - Market size and forecast 2023-2028
- Chart on Military and defense - Market size and forecast 2023-2028 ($ million)
- Data Table on Military and defense - Market size and forecast 2023-2028 ($ million)
- Chart on Military and defense - Year-over-year growth 2023-2028 (%)
- Data Table on Military and defense - Year-over-year growth 2023-2028 (%)
- 6.4 Biomedical - Market size and forecast 2023-2028
- Chart on Biomedical - Market size and forecast 2023-2028 ($ million)
- Data Table on Biomedical - Market size and forecast 2023-2028 ($ million)
- Chart on Biomedical - Year-over-year growth 2023-2028 (%)
- Data Table on Biomedical - Year-over-year growth 2023-2028 (%)
- 6.5 Industrial and manufacturing - Market size and forecast 2023-2028
- Chart on Industrial and manufacturing - Market size and forecast 2023-2028 ($ million)
- Data Table on Industrial and manufacturing - Market size and forecast 2023-2028 ($ million)
- Chart on Industrial and manufacturing - Year-over-year growth 2023-2028 (%)
- Data Table on Industrial and manufacturing - Year-over-year growth 2023-2028 (%)
- 6.6 Others - Market size and forecast 2023-2028
- Chart on Others - Market size and forecast 2023-2028 ($ million)
- Data Table on Others - Market size and forecast 2023-2028 ($ million)
- Chart on Others - Year-over-year growth 2023-2028 (%)
- Data Table on Others - Year-over-year growth 2023-2028 (%)
- 6.7 Market opportunity by Application
- Market opportunity by Application ($ million)
- Data Table on Market opportunity by Application ($ million)
7 Market Segmentation by Component
- 7.1 Market segments
- Chart on Component - Market share 2023-2028 (%)
- Data Table on Component - Market share 2023-2028 (%)
- 7.2 Comparison by Component
- Chart on Comparison by Component
- Data Table on Comparison by Component
- 7.3 Wavefront sensors - Market size and forecast 2023-2028
- Chart on Wavefront sensors - Market size and forecast 2023-2028 ($ million)
- Data Table on Wavefront sensors - Market size and forecast 2023-2028 ($ million)
- Chart on Wavefront sensors - Year-over-year growth 2023-2028 (%)
- Data Table on Wavefront sensors - Year-over-year growth 2023-2028 (%)
- 7.4 Wavefront modulators - Market size and forecast 2023-2028
- Chart on Wavefront modulators - Market size and forecast 2023-2028 ($ million)
- Data Table on Wavefront modulators - Market size and forecast 2023-2028 ($ million)
- Chart on Wavefront modulators - Year-over-year growth 2023-2028 (%)
- Data Table on Wavefront modulators - Year-over-year growth 2023-2028 (%)
- 7.5 Control system - Market size and forecast 2023-2028
- Chart on Control system - Market size and forecast 2023-2028 ($ million)
- Data Table on Control system - Market size and forecast 2023-2028 ($ million)
- Chart on Control system - Year-over-year growth 2023-2028 (%)
- Data Table on Control system - Year-over-year growth 2023-2028 (%)
- 7.6 Market opportunity by Component
- Market opportunity by Component ($ million)
- Data Table on Market opportunity by Component ($ million)
8 Customer Landscape
- 8.1 Customer landscape overview
- Analysis of price sensitivity, lifecycle, customer purchase basket, adoption rates, and purchase criteria
9 Geographic Landscape
- 9.1 Geographic segmentation
- Chart on Market share By Geographical Landscape 2023-2028 (%)
- Data Table on Market share By Geographical Landscape 2023-2028 (%)
- 9.2 Geographic comparison
- Chart on Geographic comparison
- Data Table on Geographic comparison
- 9.3 North America - Market size and forecast 2023-2028
- Chart on North America - Market size and forecast 2023-2028 ($ million)
- Data Table on North America - Market size and forecast 2023-2028 ($ million)
- Chart on North America - Year-over-year growth 2023-2028 (%)
- Data Table on North America - Year-over-year growth 2023-2028 (%)
- 9.4 APAC - Market size and forecast 2023-2028
- Chart on APAC - Market size and forecast 2023-2028 ($ million)
- Data Table on APAC - Market size and forecast 2023-2028 ($ million)
- Chart on APAC - Year-over-year growth 2023-2028 (%)
- Data Table on APAC - Year-over-year growth 2023-2028 (%)
- 9.5 Europe - Market size and forecast 2023-2028
- Chart on Europe - Market size and forecast 2023-2028 ($ million)
- Data Table on Europe - Market size and forecast 2023-2028 ($ million)
- Chart on Europe - Year-over-year growth 2023-2028 (%)
- Data Table on Europe - Year-over-year growth 2023-2028 (%)
- 9.6 South America - Market size and forecast 2023-2028
- Chart on South America - Market size and forecast 2023-2028 ($ million)
- Data Table on South America - Market size and forecast 2023-2028 ($ million)
- Chart on South America - Year-over-year growth 2023-2028 (%)
- Data Table on South America - Year-over-year growth 2023-2028 (%)
- 9.7 Middle East and Africa - Market size and forecast 2023-2028
- Chart on Middle East and Africa - Market size and forecast 2023-2028 ($ million)
- Data Table on Middle East and Africa - Market size and forecast 2023-2028 ($ million)
- Chart on Middle East and Africa - Year-over-year growth 2023-2028 (%)
- Data Table on Middle East and Africa - Year-over-year growth 2023-2028 (%)
- 9.8 US - Market size and forecast 2023-2028
- Chart on US - Market size and forecast 2023-2028 ($ million)
- Data Table on US - Market size and forecast 2023-2028 ($ million)
- Chart on US - Year-over-year growth 2023-2028 (%)
- Data Table on US - Year-over-year growth 2023-2028 (%)
- 9.9 China - Market size and forecast 2023-2028
- Chart on China - Market size and forecast 2023-2028 ($ million)
- Data Table on China - Market size and forecast 2023-2028 ($ million)
- Chart on China - Year-over-year growth 2023-2028 (%)
- Data Table on China - Year-over-year growth 2023-2028 (%)
- 9.10 France - Market size and forecast 2023-2028
- Chart on France - Market size and forecast 2023-2028 ($ million)
- Data Table on France - Market size and forecast 2023-2028 ($ million)
- Chart on France - Year-over-year growth 2023-2028 (%)
- Data Table on France - Year-over-year growth 2023-2028 (%)
- 9.11 Japan - Market size and forecast 2023-2028
- Chart on Japan - Market size and forecast 2023-2028 ($ million)
- Data Table on Japan - Market size and forecast 2023-2028 ($ million)
- Chart on Japan - Year-over-year growth 2023-2028 (%)
- Data Table on Japan - Year-over-year growth 2023-2028 (%)
- 9.12 Germany - Market size and forecast 2023-2028
- Chart on Germany - Market size and forecast 2023-2028 ($ million)
- Data Table on Germany - Market size and forecast 2023-2028 ($ million)
- Chart on Germany - Year-over-year growth 2023-2028 (%)
- Data Table on Germany - Year-over-year growth 2023-2028 (%)
- 9.13 Market opportunity By Geographical Landscape
- Market opportunity By Geographical Landscape ($ million)
- Data Tables on Market opportunity By Geographical Landscape ($ million)
10 Drivers, Challenges, and Opportunity/Restraints
- 10.1 Market drivers
- 10.2 Market challenges
- 10.3 Impact of drivers and challenges
- Impact of drivers and challenges in 2023 and 2028
- 10.4 Market opportunities/restraints
11 Competitive Landscape
- 11.1 Overview
- 11.2 Competitive Landscape
- Overview on criticality of inputs and factors of differentiation
- 11.3 Landscape disruption
- Overview on factors of disruption
- 11.4 Industry risks
- Impact of key risks on business
12 Competitive Analysis
- 12.1 Companies profiled
- Companies covered
- 12.2 Market positioning of companies
- Matrix on companies position and classification
- 12.3 Adaptica Srl
- Adaptica Srl - Overview
- Adaptica Srl - Product / Service
- Adaptica Srl - Key offerings
- 12.4 Alpao SAS
- Alpao SAS - Overview
- Alpao SAS - Product / Service
- Alpao SAS - Key offerings
- 12.5 Benchmark Electronics Inc.
- Benchmark Electronics Inc. - Overview
- Benchmark Electronics Inc. - Business segments
- Benchmark Electronics Inc. - Key news
- Benchmark Electronics Inc. - Key offerings
- Benchmark Electronics Inc. - Segment focus
- 12.6 Boston Micromachines Corp.
- Boston Micromachines Corp. - Overview
- Boston Micromachines Corp. - Product / Service
- Boston Micromachines Corp. - Key offerings
- 12.7 Flexible Optical BV
- Flexible Optical BV - Overview
- Flexible Optical BV - Product / Service
- Flexible Optical BV - Key offerings
- 12.8 Hamamatsu Photonics KK
- Hamamatsu Photonics KK - Overview
- Hamamatsu Photonics KK - Business segments
- Hamamatsu Photonics KK - Key news
- Hamamatsu Photonics KK - Key offerings
- Hamamatsu Photonics KK - Segment focus
- 12.9 HOLOEYE Photonics AG
- HOLOEYE Photonics AG - Overview
- HOLOEYE Photonics AG - Product / Service
- HOLOEYE Photonics AG - Key offerings
- 12.10 Imagine Optic
- Imagine Optic - Overview
- Imagine Optic - Product / Service
- Imagine Optic - Key offerings
- 12.11 Iris Ao Inc.
- Iris Ao Inc. - Overview
- Iris Ao Inc. - Product / Service
- Iris Ao Inc. - Key offerings
- 12.12 Northrop Grumman Corp.
- Northrop Grumman Corp. - Overview
- Northrop Grumman Corp. - Business segments
- Northrop Grumman Corp. - Key news
- Northrop Grumman Corp. - Key offerings
- Northrop Grumman Corp. - Segment focus
- 12.13 PHASICS SA
- PHASICS SA - Overview
- PHASICS SA - Product / Service
- PHASICS SA - Key offerings
- 12.14 Synopsys Inc.
- Synopsys Inc. - Overview
- Synopsys Inc. - Business segments
- Synopsys Inc. - Key news
- Synopsys Inc. - Key offerings
- Synopsys Inc. - Segment focus
- 12.15 Teledyne Technologies Inc.
- Teledyne Technologies Inc. - Overview
- Teledyne Technologies Inc. - Business segments
- Teledyne Technologies Inc. - Key news
- Teledyne Technologies Inc. - Key offerings
- Teledyne Technologies Inc. - Segment focus
- 12.16 Thorlabs Inc.
- Thorlabs Inc. - Overview
- Thorlabs Inc. - Product / Service
- Thorlabs Inc. - Key offerings
- 12.17 Turn Ltd.
- Turn Ltd. - Overview
- Turn Ltd. - Product / Service
- Turn Ltd. - Key offerings
13 Appendix
- 13.1 Scope of the report
- 13.2 Inclusions and exclusions checklist
- Inclusions checklist
- Exclusions checklist
- 13.3 Currency conversion rates for US$
- Currency conversion rates for US$
- 13.4 Research methodology
- Research methodology
- 13.5 Data procurement
- Information sources
- 13.6 Data validation
- Data validation
- 13.7 Validation techniques employed for market sizing
- Validation techniques employed for market sizing
- 13.8 Data synthesis
- Data synthesis
- 13.9 360 degree market analysis
- 360 degree market analysis
- 13.10 List of abbreviations
- List of abbreviations

