|
|
市場調査レポート
商品コード
1653082
皮膚科学の世界市場 2025~2029年Global Dermatology Market 2025-2029 |
||||||

|
|||||||
カスタマイズ可能
|
|||||||

| 皮膚科学の世界市場 2025~2029年 |
|
出版日: 2025年01月31日
発行: TechNavio
ページ情報: 英文 188 Pages
納期: 即納可能
|

全表示
- 概要
- 目次
皮膚科学市場は、2024~2029年にかけて191億7,240万米ドル、予測期間中のCAGRは12.8%で成長すると予測されています。
当レポートでは、皮膚科学市場の全体的な分析、市場規模・予測、動向、成長促進要因、課題、約25のベンダーを網羅したベンダー分析などを掲載しています。
現在の市場シナリオ、最新動向と促進要因、市場環境全体に関する最新分析を提供しています。皮膚疾患の有病率の増加、皮膚科学機器の技術進歩、高齢化人口の増加などが市場を牽引しています。
| 市場範囲 | |
|---|---|
| 基準年 | 2025年 |
| 終了年 | 2029年 |
| 予測期間 | 2025~2029年 |
| 成長モメンタム | 加速 |
| 前年比[2025年] | 11.6% |
| CAGR | 12.8% |
| 増分額 | 191億7,240万米ドル |
本調査は、産業の主要参加者からのインプットを含め、一次情報と二次情報を客観的に組み合わせて実施しました。レポートには、主要企業の分析に加え、包括的な市場規模データ、地域別分析によるセグメント、ベンダー情勢が含まれています。レポートには過去データと予測データがあります。
本調査では、今後数年間の皮膚科学市場の成長を促進する主要理由の1つとして、テレ皮膚科学の普及が増加していることを挙げています。また、パーソナライズされた皮膚科学治療とデバイス、皮膚科学における人工知能と機械学習の統合は、市場の大きな需要につながると考えられます。
目次
第1章 エグゼクティブサマリー
- 市場概要
第2章 Technavio分析
- 価格・ライフサイクル・顧客購入バスケット・採用率・購入基準の分析
- インプットの重要性と差別化の要因
- 混乱の要因
- 促進要因と課題の影響
第3章 市場情勢
- 市場エコシステム
- 市場の特徴
- バリューチェーン分析
第4章 市場規模
- 市場の定義
- 市場セグメント分析
- 市場規模 2024年
- 市場の展望 2024~2029年
第5章 市場規模実績
- 皮膚科学の世界市場 2019~2023年
- 用途別セグメント分析 2019~2023年
- エンドユーザー別セグメント分析 2019~2023年
- 地域別セグメント分析 2019~2023年
- 国別セグメント分析 2019~2023年
第6章 定性分析
- AIの影響:皮膚科学の世界市場
第7章 ファイブフォース分析
- ファイブフォースの要約
- 買い手の交渉力
- 供給企業の交渉力
- 新規参入業者の脅威
- 代替品の脅威
- 競争の脅威
- 市況
第8章 市場セグメンテーション:用途別
- 市場セグメント
- 比較:用途別
- ニキビ:市場規模と予測 2024~2029年
- 乾癬:市場規模と予測 2024~2029年
- 皮膚炎:市場規模と予測 2024~2029年
- 皮膚がん:市場規模と予測 2024~2029年
- その他:市場規模と予測 2024~2029年
- 市場機会:用途別
第9章 市場セグメンテーション:エンドユーザー別
- 市場セグメント
- 比較:エンドユーザー別
- 皮膚科:市場規模と予測 2024~2029年
- 病院:市場規模と予測 2024~2029年
- その他:市場規模と予測 2024~2029年
- 市場機会:エンドユーザー別
第10章 顧客情勢
- 顧客情勢概要
第11章 地域別情勢
- 地域別セグメンテーション
- 比較:地域別
- 北米:市場規模と予測 2024~2029年
- 欧州:市場規模と予測 2024~2029年
- アジア:市場規模と予測 2024~2029年
- その他:市場規模と予測 2024~2029年
- 米国:市場規模と予測 2024~2029年
- フィンランド:市場規模と予測 2024~2029年
- 中国:市場規模と予測 2024~2029年
- カナダ:市場規模と予測 2024~2029年
- インド:市場規模と予測 2024~2029年
- 日本:市場規模と予測 2024~2029年
- ドイツ:市場規模と予測 2024~2029年
- 韓国:市場規模と予測 2024~2029年
- 英国:市場規模と予測 2024~2029年
- フランス:市場規模と予測 2024~2029年
- 地域情勢による市場機会
第12章 促進要因・課題・機会・抑制要因
- 市場促進要因
- 市場課題
- 促進要因と課題の影響
- 市場機会・抑制要因
第13章 競合情勢
- 概要
- 競合情勢
- 混乱の状況
- 産業のリスク
第14章 競合分析
- 企業プロファイル
- 企業ランキング指数
- 企業の市場ポジショニング
- Aesthetic Group
- Alma Lasers Ltd.
- Bioglint Derma Care
- Bruker Corp.
- Candela Corp.
- Canfield Scientific Inc.
- Cutera Inc.
- Cynosure LLC
- DermLite LLC
- Fourrts India Laboratories Pvt. Ltd.
- Genesis Biosystems Inc.
- HEINE Optotechnik GmbH and Co. KG
- Image Derm Inc.
- Lumenis Be Ltd.
- Solta Medical
第15章 付録
The dermatology market is forecasted to grow by USD 19172.4 million during 2024-2029, accelerating at a CAGR of 12.8% during the forecast period. The report on the dermatology market provides a holistic analysis, market size and forecast, trends, growth drivers, and challenges, as well as vendor analysis covering around 25 vendors.
The report offers an up-to-date analysis regarding the current market scenario, the latest trends and drivers, and the overall market environment. The market is driven by increasing prevalence of skin disorders, technological advancements in dermatology devices, and growing aging population.
| Market Scope | |
|---|---|
| Base Year | 2025 |
| End Year | 2029 |
| Series Year | 2025-2029 |
| Growth Momentum | Accelerate |
| YOY 2025 | 11.6% |
| CAGR | 12.8% |
| Incremental Value | $19172.4 mn |
The study was conducted using an objective combination of primary and secondary information including inputs from key participants in the industry. The report contains a comprehensive market size data, segment with regional analysis and vendor landscape in addition to an analysis of the key companies. Reports have historic and forecast data.
Technavio's dermatology market is segmented as below:
By Application
- Acne
- Psoriasis
- Dermatitis
- Skin cancer
- Others
By End-user
- Skin clinics
- Hospitals
- Others
By Geographical Landscape
- North America
- Europe
- Asia
- Rest of World (ROW)
This study identifies the increasing prevalence of tele dermatology as one of the prime reasons driving the dermatology market growth during the next few years. Also, personalized dermatology treatments and devices and integration of artificial intelligence and machine learning in dermatology will lead to sizable demand in the market.
The report on the dermatology market covers the following areas:
- Dermatology Market sizing
- Dermatology Market forecast
- Dermatology Market industry analysis
The robust vendor analysis is designed to help clients improve their market position, and in line with this, this report provides a detailed analysis of several leading dermatology market vendors that include Aesthetic Group, Alma Lasers Ltd., Biofrontera AG, Bioglint Derma Care, Bruker Corp., Candela Corp., Canfield Scientific Inc., Cutera Inc., Cynosure LLC, Dermatology and Co., DermLite LLC, Ernst Pharmacia TM, Fourrts India Laboratories Pvt. Ltd., Genesis Biosystems Inc., HEINE Optotechnik GmbH and Co. KG, Image Derm Inc., LEO Pharma AS, Lumenis Be Ltd., Novotech Health Holdings, and Solta Medical. Also, the dermatology market analysis report includes information on upcoming trends and challenges that will influence market growth. This is to help companies strategize and leverage all forthcoming growth opportunities.
The publisher presents a detailed picture of the market by the way of study, synthesis, and summation of data from multiple sources by an analysis of key parameters such as profit, pricing, competition, and promotions. It presents various market facets by identifying the key industry influencers. The data presented is comprehensive, reliable, and a result of extensive primary and secondary research. The market research reports provide a complete competitive landscape and an in-depth vendor selection methodology and analysis using qualitative and quantitative research to forecast accurate market growth.
Table of Contents
1 Executive Summary
- 1.1 Market overview
- Executive Summary - Chart on Market Overview
- Executive Summary - Data Table on Market Overview
- Executive Summary - Chart on Global Market Characteristics
- Executive Summary - Chart on Market By Geographical Landscape
- Executive Summary - Chart on Market Segmentation by Application
- Executive Summary - Chart on Market Segmentation by End-user
- Executive Summary - Chart on Incremental Growth
- Executive Summary - Data Table on Incremental Growth
- Executive Summary - Chart on Company Market Positioning
2 Technavio Analysis
- 2.1 Analysis of price sensitivity, lifecycle, customer purchase basket, adoption rates, and purchase criteria
- Analysis of price sensitivity, lifecycle, customer purchase basket, adoption rates, and purchase criteria
- 2.2 Criticality of inputs and Factors of differentiation
- Overview on criticality of inputs and factors of differentiation
- 2.3 Factors of disruption
- Overview on factors of disruption
- 2.4 Impact of drivers and challenges
- Impact of drivers and challenges in 2024 and 2029
3 Market Landscape
- 3.1 Market ecosystem
- Parent Market
- Data Table on - Parent Market
- 3.2 Market characteristics
- Market characteristics analysis
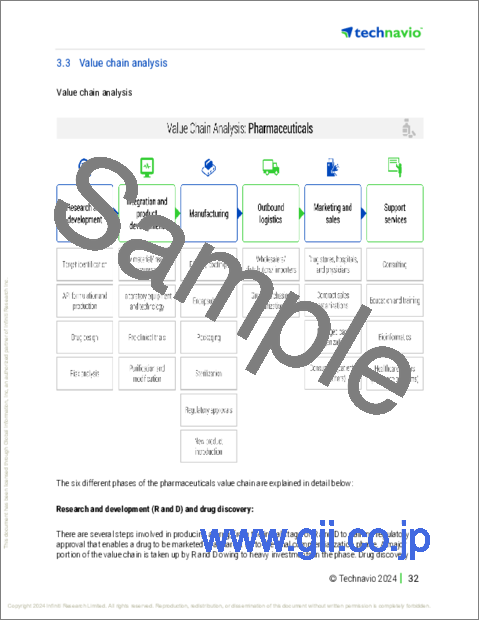
- 3.3 Value chain analysis
- Value chain analysis
4 Market Sizing
- 4.1 Market definition
- Offerings of companies included in the market definition
- 4.2 Market segment analysis
- Market segments
- 4.3 Market size 2024
- 4.4 Market outlook: Forecast for 2024-2029
- Chart on Global - Market size and forecast 2024-2029 ($ million)
- Data Table on Global - Market size and forecast 2024-2029 ($ million)
- Chart on Global Market: Year-over-year growth 2024-2029 (%)
- Data Table on Global Market: Year-over-year growth 2024-2029 (%)
5 Historic Market Size
- 5.1 Global Dermatology Market 2019 - 2023
- Historic Market Size - Data Table on Global Dermatology Market 2019 - 2023 ($ million)
- 5.2 Application segment analysis 2019 - 2023
- Historic Market Size - Application Segment 2019 - 2023 ($ million)
- 5.3 End-user segment analysis 2019 - 2023
- Historic Market Size - End-user Segment 2019 - 2023 ($ million)
- 5.4 Geography segment analysis 2019 - 2023
- Historic Market Size - Geography Segment 2019 - 2023 ($ million)
- 5.5 Country segment analysis 2019 - 2023
- Historic Market Size - Country Segment 2019 - 2023 ($ million)
6 Qualitative Analysis
- 6.1 The AI Impact on Global Dermatology Market
7 Five Forces Analysis
- 7.1 Five forces summary
- Five forces analysis - Comparison between 2024 and 2029
- 7.2 Bargaining power of buyers
- Bargaining power of buyers - Impact of key factors 2024 and 2029
- 7.3 Bargaining power of suppliers
- Bargaining power of suppliers - Impact of key factors in 2024 and 2029
- 7.4 Threat of new entrants
- Threat of new entrants - Impact of key factors in 2024 and 2029
- 7.5 Threat of substitutes
- Threat of substitutes - Impact of key factors in 2024 and 2029
- 7.6 Threat of rivalry
- Threat of rivalry - Impact of key factors in 2024 and 2029
- 7.7 Market condition
- Chart on Market condition - Five forces 2024 and 2029
8 Market Segmentation by Application
- 8.1 Market segments
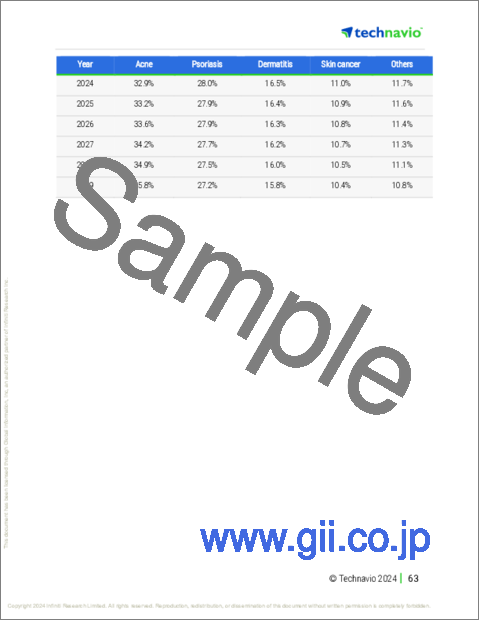
- Chart on Application - Market share 2024-2029 (%)
- Data Table on Application - Market share 2024-2029 (%)
- 8.2 Comparison by Application
- Chart on Comparison by Application
- Data Table on Comparison by Application
- 8.3 Acne - Market size and forecast 2024-2029
- Chart on Acne - Market size and forecast 2024-2029 ($ million)
- Data Table on Acne - Market size and forecast 2024-2029 ($ million)
- Chart on Acne - Year-over-year growth 2024-2029 (%)
- Data Table on Acne - Year-over-year growth 2024-2029 (%)
- 8.4 Psoriasis - Market size and forecast 2024-2029
- Chart on Psoriasis - Market size and forecast 2024-2029 ($ million)
- Data Table on Psoriasis - Market size and forecast 2024-2029 ($ million)
- Chart on Psoriasis - Year-over-year growth 2024-2029 (%)
- Data Table on Psoriasis - Year-over-year growth 2024-2029 (%)
- 8.5 Dermatitis - Market size and forecast 2024-2029
- Chart on Dermatitis - Market size and forecast 2024-2029 ($ million)
- Data Table on Dermatitis - Market size and forecast 2024-2029 ($ million)
- Chart on Dermatitis - Year-over-year growth 2024-2029 (%)
- Data Table on Dermatitis - Year-over-year growth 2024-2029 (%)
- 8.6 Skin cancer - Market size and forecast 2024-2029
- Chart on Skin cancer - Market size and forecast 2024-2029 ($ million)
- Data Table on Skin cancer - Market size and forecast 2024-2029 ($ million)
- Chart on Skin cancer - Year-over-year growth 2024-2029 (%)
- Data Table on Skin cancer - Year-over-year growth 2024-2029 (%)
- 8.7 Others - Market size and forecast 2024-2029
- Chart on Others - Market size and forecast 2024-2029 ($ million)
- Data Table on Others - Market size and forecast 2024-2029 ($ million)
- Chart on Others - Year-over-year growth 2024-2029 (%)
- Data Table on Others - Year-over-year growth 2024-2029 (%)
- 8.8 Market opportunity by Application
- Market opportunity by Application ($ million)
- Data Table on Market opportunity by Application ($ million)
9 Market Segmentation by End-user
- 9.1 Market segments
- Chart on End-user - Market share 2024-2029 (%)
- Data Table on End-user - Market share 2024-2029 (%)
- 9.2 Comparison by End-user
- Chart on Comparison by End-user
- Data Table on Comparison by End-user
- 9.3 Skin clinics - Market size and forecast 2024-2029
- Chart on Skin clinics - Market size and forecast 2024-2029 ($ million)
- Data Table on Skin clinics - Market size and forecast 2024-2029 ($ million)
- Chart on Skin clinics - Year-over-year growth 2024-2029 (%)
- Data Table on Skin clinics - Year-over-year growth 2024-2029 (%)
- 9.4 Hospitals - Market size and forecast 2024-2029
- Chart on Hospitals - Market size and forecast 2024-2029 ($ million)
- Data Table on Hospitals - Market size and forecast 2024-2029 ($ million)
- Chart on Hospitals - Year-over-year growth 2024-2029 (%)
- Data Table on Hospitals - Year-over-year growth 2024-2029 (%)
- 9.5 Others - Market size and forecast 2024-2029
- Chart on Others - Market size and forecast 2024-2029 ($ million)
- Data Table on Others - Market size and forecast 2024-2029 ($ million)
- Chart on Others - Year-over-year growth 2024-2029 (%)
- Data Table on Others - Year-over-year growth 2024-2029 (%)
- 9.6 Market opportunity by End-user
- Market opportunity by End-user ($ million)
- Data Table on Market opportunity by End-user ($ million)
10 Customer Landscape
- 10.1 Customer landscape overview
- Analysis of price sensitivity, lifecycle, customer purchase basket, adoption rates, and purchase criteria
11 Geographic Landscape
- 11.1 Geographic segmentation
- Chart on Market share By Geographical Landscape 2024-2029 (%)
- Data Table on Market share By Geographical Landscape 2024-2029 (%)
- 11.2 Geographic comparison
- Chart on Geographic comparison
- Data Table on Geographic comparison
- 11.3 North America - Market size and forecast 2024-2029
- Chart on North America - Market size and forecast 2024-2029 ($ million)
- Data Table on North America - Market size and forecast 2024-2029 ($ million)
- Chart on North America - Year-over-year growth 2024-2029 (%)
- Data Table on North America - Year-over-year growth 2024-2029 (%)
- 11.4 Europe - Market size and forecast 2024-2029
- Chart on Europe - Market size and forecast 2024-2029 ($ million)
- Data Table on Europe - Market size and forecast 2024-2029 ($ million)
- Chart on Europe - Year-over-year growth 2024-2029 (%)
- Data Table on Europe - Year-over-year growth 2024-2029 (%)
- 11.5 Asia - Market size and forecast 2024-2029
- Chart on Asia - Market size and forecast 2024-2029 ($ million)
- Data Table on Asia - Market size and forecast 2024-2029 ($ million)
- Chart on Asia - Year-over-year growth 2024-2029 (%)
- Data Table on Asia - Year-over-year growth 2024-2029 (%)
- 11.6 Rest of World (ROW) - Market size and forecast 2024-2029
- Chart on Rest of World (ROW) - Market size and forecast 2024-2029 ($ million)
- Data Table on Rest of World (ROW) - Market size and forecast 2024-2029 ($ million)
- Chart on Rest of World (ROW) - Year-over-year growth 2024-2029 (%)
- Data Table on Rest of World (ROW) - Year-over-year growth 2024-2029 (%)
- 11.7 US - Market size and forecast 2024-2029
- Chart on US - Market size and forecast 2024-2029 ($ million)
- Data Table on US - Market size and forecast 2024-2029 ($ million)
- Chart on US - Year-over-year growth 2024-2029 (%)
- Data Table on US - Year-over-year growth 2024-2029 (%)
- 11.8 Finland - Market size and forecast 2024-2029
- Chart on Finland - Market size and forecast 2024-2029 ($ million)
- Data Table on Finland - Market size and forecast 2024-2029 ($ million)
- Chart on Finland - Year-over-year growth 2024-2029 (%)
- Data Table on Finland - Year-over-year growth 2024-2029 (%)
- 11.9 China - Market size and forecast 2024-2029
- Chart on China - Market size and forecast 2024-2029 ($ million)
- Data Table on China - Market size and forecast 2024-2029 ($ million)
- Chart on China - Year-over-year growth 2024-2029 (%)
- Data Table on China - Year-over-year growth 2024-2029 (%)
- 11.10 Canada - Market size and forecast 2024-2029
- Chart on Canada - Market size and forecast 2024-2029 ($ million)
- Data Table on Canada - Market size and forecast 2024-2029 ($ million)
- Chart on Canada - Year-over-year growth 2024-2029 (%)
- Data Table on Canada - Year-over-year growth 2024-2029 (%)
- 11.11 India - Market size and forecast 2024-2029
- Chart on India - Market size and forecast 2024-2029 ($ million)
- Data Table on India - Market size and forecast 2024-2029 ($ million)
- Chart on India - Year-over-year growth 2024-2029 (%)
- Data Table on India - Year-over-year growth 2024-2029 (%)
- 11.12 Japan - Market size and forecast 2024-2029
- Chart on Japan - Market size and forecast 2024-2029 ($ million)
- Data Table on Japan - Market size and forecast 2024-2029 ($ million)
- Chart on Japan - Year-over-year growth 2024-2029 (%)
- Data Table on Japan - Year-over-year growth 2024-2029 (%)
- 11.13 Germany - Market size and forecast 2024-2029
- Chart on Germany - Market size and forecast 2024-2029 ($ million)
- Data Table on Germany - Market size and forecast 2024-2029 ($ million)
- Chart on Germany - Year-over-year growth 2024-2029 (%)
- Data Table on Germany - Year-over-year growth 2024-2029 (%)
- 11.14 South Korea - Market size and forecast 2024-2029
- Chart on South Korea - Market size and forecast 2024-2029 ($ million)
- Data Table on South Korea - Market size and forecast 2024-2029 ($ million)
- Chart on South Korea - Year-over-year growth 2024-2029 (%)
- Data Table on South Korea - Year-over-year growth 2024-2029 (%)
- 11.15 UK - Market size and forecast 2024-2029
- Chart on UK - Market size and forecast 2024-2029 ($ million)
- Data Table on UK - Market size and forecast 2024-2029 ($ million)
- Chart on UK - Year-over-year growth 2024-2029 (%)
- Data Table on UK - Year-over-year growth 2024-2029 (%)
- 11.16 France - Market size and forecast 2024-2029
- Chart on France - Market size and forecast 2024-2029 ($ million)
- Data Table on France - Market size and forecast 2024-2029 ($ million)
- Chart on France - Year-over-year growth 2024-2029 (%)
- Data Table on France - Year-over-year growth 2024-2029 (%)
- 11.17 Market opportunity By Geographical Landscape
- Market opportunity By Geographical Landscape ($ million)
- Data Tables on Market opportunity By Geographical Landscape ($ million)
12 Drivers, Challenges, and Opportunity/Restraints
- 12.1 Market drivers
- 12.2 Market challenges
- 12.3 Impact of drivers and challenges
- Impact of drivers and challenges in 2024 and 2029
- 12.4 Market opportunities/restraints
13 Competitive Landscape
- 13.1 Overview
- 13.2 Competitive Landscape
- Overview on criticality of inputs and factors of differentiation
- 13.3 Landscape disruption
- Overview on factors of disruption
- 13.4 Industry risks
- Impact of key risks on business
14 Competitive Analysis
- 14.1 Companies profiled
- Companies covered
- 14.2 Company ranking index
- Company ranking index
- 14.3 Market positioning of companies
- Matrix on companies position and classification
- 14.4 Aesthetic Group
- Aesthetic Group - Overview
- Aesthetic Group - Product / Service
- Aesthetic Group - Key offerings
- SWOT
- 14.5 Alma Lasers Ltd.
- Alma Lasers Ltd. - Overview
- Alma Lasers Ltd. - Product / Service
- Alma Lasers Ltd. - Key offerings
- SWOT
- 14.6 Bioglint Derma Care
- Bioglint Derma Care - Overview
- Bioglint Derma Care - Product / Service
- Bioglint Derma Care - Key offerings
- SWOT
- 14.7 Bruker Corp.
- Bruker Corp. - Overview
- Bruker Corp. - Business segments
- Bruker Corp. - Key news
- Bruker Corp. - Key offerings
- Bruker Corp. - Segment focus
- SWOT
- 14.8 Candela Corp.
- Candela Corp. - Overview
- Candela Corp. - Product / Service
- Candela Corp. - Key offerings
- SWOT
- 14.9 Canfield Scientific Inc.
- Canfield Scientific Inc. - Overview
- Canfield Scientific Inc. - Product / Service
- Canfield Scientific Inc. - Key offerings
- SWOT
- 14.10 Cutera Inc.
- Cutera Inc. - Overview
- Cutera Inc. - Product / Service
- Cutera Inc. - Key news
- Cutera Inc. - Key offerings
- SWOT
- 14.11 Cynosure LLC
- Cynosure LLC - Overview
- Cynosure LLC - Product / Service
- Cynosure LLC - Key offerings
- SWOT
- 14.12 DermLite LLC
- DermLite LLC - Overview
- DermLite LLC - Product / Service
- DermLite LLC - Key offerings
- SWOT
- 14.13 Fourrts India Laboratories Pvt. Ltd.
- Fourrts India Laboratories Pvt. Ltd. - Overview
- Fourrts India Laboratories Pvt. Ltd. - Product / Service
- Fourrts India Laboratories Pvt. Ltd. - Key offerings
- SWOT
- 14.14 Genesis Biosystems Inc.
- Genesis Biosystems Inc. - Overview
- Genesis Biosystems Inc. - Product / Service
- Genesis Biosystems Inc. - Key offerings
- SWOT
- 14.15 HEINE Optotechnik GmbH and Co. KG
- HEINE Optotechnik GmbH and Co. KG - Overview
- HEINE Optotechnik GmbH and Co. KG - Product / Service
- HEINE Optotechnik GmbH and Co. KG - Key offerings
- SWOT
- 14.16 Image Derm Inc.
- Image Derm Inc. - Overview
- Image Derm Inc. - Product / Service
- Image Derm Inc. - Key offerings
- SWOT
- 14.17 Lumenis Be Ltd.
- Lumenis Be Ltd. - Overview
- Lumenis Be Ltd. - Product / Service
- Lumenis Be Ltd. - Key offerings
- SWOT
- 14.18 Solta Medical
- Solta Medical - Overview
- Solta Medical - Product / Service
- Solta Medical - Key offerings
- SWOT
15 Appendix
- 15.1 Scope of the report
- 15.2 Inclusions and exclusions checklist
- Inclusions checklist
- Exclusions checklist
- 15.3 Currency conversion rates for US$
- Currency conversion rates for US$
- 15.4 Research methodology
- Research methodology
- 15.5 Data procurement
- Information sources
- 15.6 Data validation
- Data validation
- 15.7 Validation techniques employed for market sizing
- Validation techniques employed for market sizing
- 15.8 Data synthesis
- Data synthesis
- 15.9 360 degree market analysis
- 360 degree market analysis
- 15.10 List of abbreviations
- List of abbreviations

