|
|
市場調査レポート
商品コード
1719425
ソーシャルロボットの世界市場 2025~2029年Global Social Robots Market 2025-2029 |
||||||

|
|||||||
カスタマイズ可能
|
|||||||


| ソーシャルロボットの世界市場 2025~2029年 |
|
出版日: 2025年04月22日
発行: TechNavio
ページ情報: 英文 243 Pages
納期: 即納可能
|

全表示
- 概要
- 図表
- 目次
ソーシャルロボット市場は2024-2029年に203億5,880万米ドル、予測期間中のCAGRは43.5%で成長すると予測されています。
当レポートでは、ソーシャルロボット市場の全体的な分析、市場規模・予測、動向、成長促進要因、課題、約25のベンダーを網羅したベンダー分析などを掲載しています。
現在の市場シナリオ、最新動向と促進要因、市場環境全体に関する最新分析を提供しています。ソーシャルロボットの技術進歩、先進的なソーシャルロボットの市場開拓に対する政府支援の増加、従来のセキュリティ手法よりもロボットが好まれることなどが市場を牽引しています。
| 市場範囲 | |
|---|---|
| 基準年 | 2025 |
| 終了年 | 2029 |
| 予測期間 | 2025-2029 |
| 成長モメンタム | 加速 |
| 前年比2025年 | 33.5% |
| CAGR | 43.5% |
| 増分額 | 203億5,880万米ドル |
本調査は、業界の主要参加者からのインプットを含め、一次情報と二次情報を客観的に組み合わせて実施しました。レポートには、主要企業の分析に加え、包括的な市場規模データ、地域分析によるセグメント、ベンダー情勢が含まれています。レポートには過去データと予測データがあります。
本調査では、今後数年間におけるソーシャルロボット市場の成長を促進する主な要因の1つとして、バッテリー寿命の向上への注目が高まっていることを挙げています。また、ホスピタリティ産業でのソーシャルロボット採用数の増加や、ロボットへのIoT統合は、市場の大きな需要につながるでしょう。
目次
第1章 エグゼクティブサマリー
- 市場概要
第2章 Technavio分析
- 価格・ライフサイクル・顧客購入バスケット・採用率・購入基準の分析
- インプットの重要性と差別化の要因
- 混乱の要因
- 促進要因と課題の影響
第3章 市場情勢
- 市場エコシステム
- 市場の特徴
- バリューチェーン分析
第4章 市場規模
- 市場の定義
- 市場セグメント分析
- 市場規模 2024
- 市場の見通し 2024-2029
第5章 市場規模実績
- ソーシャルロボットの世界市場 2019-2023
- コンポーネント別セグメント分析 2019-2023
- エンドユーザー別セグメント分析 2019-2023
- 技術別セグメント分析 2019-2023
- モビリティ別タイプセグメント分析 2019-2023
- 地域別セグメント分析 2019-2023
- 国別セグメント分析 2019-2023
第6章 定性分析
- AIの影響:ソーシャルロボットの世界市場
第7章 ファイブフォース分析
- ファイブフォースの要約
- 買い手の交渉力
- 供給企業の交渉力
- 新規参入業者の脅威
- 代替品の脅威
- 競争の脅威
- 市況
第8章 市場セグメンテーション:コンポーネント別
- 市場セグメント
- 比較:コンポーネント別
- ハードウェア:市場規模と予測 2024-2029
- ソフトウェア:市場規模と予測 2024-2029
- サービス:市場規模と予測 2024-2029
- 市場機会:コンポーネント別
第9章 市場セグメンテーション:エンドユーザー別
- 市場セグメント
- 比較:エンドユーザー別
- ヘルスケア:市場規模と予測 2024-2029
- メディアとエンターテイメント:市場規模と予測 2024-2029
- 教育:市場規模と予測 2024-2029
- 小売り:市場規模と予測 2024-2029
- その他:市場規模と予測 2024-2029
- 市場機会:エンドユーザー別
第10章 市場セグメンテーション:技術別
- 市場セグメント
- 比較:技術別
- 機械学習:市場規模と予測 2024-2029
- コンピュータービジョン:市場規模と予測 2024-2029
- コンテキスト認識:市場規模と予測 2024-2029
- 自然言語処理:市場規模と予測 2024-2029
- 市場機会:技術別
第11章 市場セグメンテーション:モビリティタイプ別
- 市場セグメント
- 比較:モビリティタイプ別
- 移動ロボット:市場規模と予測 2024-2029
- 固定ロボット:市場規模と予測 2024-2029
- 市場機会:モビリティタイプ別
第12章 顧客情勢
- 顧客情勢の概要
第13章 地域別情勢
- 地域別セグメンテーション
- 地域別比較
- アジア太平洋:市場規模と予測 2024-2029
- 北米:市場規模と予測 2024-2029
- 欧州:市場規模と予測 2024-2029
- 中東・アフリカ:市場規模と予測 2024-2029
- 南米:市場規模と予測 2024-2029
- 米国:市場規模と予測 2024-2029
- 中国:市場規模と予測 2024-2029
- 英国:市場規模と予測 2024-2029
- 日本:市場規模と予測 2024-2029
- カナダ:市場規模と予測 2024-2029
- インド:市場規模と予測 2024-2029
- ドイツ:市場規模と予測 2024-2029
- 韓国:市場規模と予測 2024-2029
- フランス:市場規模と予測 2024-2029
- オーストラリア:市場規模と予測 2024-2029
- 市場機会:地域情勢別
第14章 促進要因・課題・機会・抑制要因
- 市場促進要因
- 市場の課題
- 促進要因と課題の影響
- 市場の機会・抑制要因
第15章 競合情勢
- 概要
- 競合情勢
- 混乱の状況
- 業界のリスク
第16章 競合分析
- 企業プロファイル
- 企業ランキング指数
- 企業の市場ポジショニング
- Aethon Inc.
- Aldebaran
- BLUE FROG ROBOTICS SAS
- Boston Dynamics Inc.
- Diligent Robotics Inc.
- Engineered Arts Ltd.
- Furhat Robotics AB
- Hitachi Ltd.
- Knightscope Inc.
- MOVIA Robotics Inc.
- PAL Robotics
- Relay Robotics Inc.
- Toyota Motor Corp.
- UBTECH Robotics Inc.
- Yukai Engineering Inc.
第17章 付録
Exhibits:
- Exhibits1: Executive Summary - Chart on Market Overview
- Exhibits2: Executive Summary - Data Table on Market Overview
- Exhibits3: Executive Summary - Chart on Global Market Characteristics
- Exhibits4: Executive Summary - Chart on Market By Geographical Landscape
- Exhibits5: Executive Summary - Chart on Market Segmentation by Component
- Exhibits6: Executive Summary - Chart on Market Segmentation by End-user
- Exhibits7: Executive Summary - Chart on Market Segmentation by Technology
- Exhibits8: Executive Summary - Chart on Market Segmentation by Mobility Type
- Exhibits9: Executive Summary - Chart on Incremental Growth
- Exhibits10: Executive Summary - Data Table on Incremental Growth
- Exhibits11: Executive Summary - Chart on Company Market Positioning
- Exhibits12: Analysis of price sensitivity, lifecycle, customer purchase basket, adoption rates, and purchase criteria
- Exhibits13: Overview on criticality of inputs and factors of differentiation
- Exhibits14: Overview on factors of disruption
- Exhibits15: Impact of drivers and challenges in 2024 and 2029
- Exhibits16: Parent Market
- Exhibits17: Data Table on - Parent Market
- Exhibits18: Market characteristics analysis
- Exhibits19: Value chain analysis
- Exhibits20: Offerings of companies included in the market definition
- Exhibits21: Market segments
- Exhibits22: Chart on Global - Market size and forecast 2024-2029 ($ million)
- Exhibits23: Data Table on Global - Market size and forecast 2024-2029 ($ million)
- Exhibits24: Chart on Global Market: Year-over-year growth 2024-2029 (%)
- Exhibits25: Data Table on Global Market: Year-over-year growth 2024-2029 (%)
- Exhibits26: Historic Market Size - Data Table on Global Social Robots Market 2019 - 2023 ($ million)
- Exhibits27: Historic Market Size - Component Segment 2019 - 2023 ($ million)
- Exhibits28: Historic Market Size - End-user Segment 2019 - 2023 ($ million)
- Exhibits29: Historic Market Size - Technology Segment 2019 - 2023 ($ million)
- Exhibits30: Historic Market Size - Mobility Type Segment 2019 - 2023 ($ million)
- Exhibits31: Historic Market Size - Geography Segment 2019 - 2023 ($ million)
- Exhibits32: Historic Market Size - Country Segment 2019 - 2023 ($ million)
- Exhibits33: Five forces analysis - Comparison between 2024 and 2029
- Exhibits34: Bargaining power of buyers - Impact of key factors 2024 and 2029
- Exhibits35: Bargaining power of suppliers - Impact of key factors in 2024 and 2029
- Exhibits36: Threat of new entrants - Impact of key factors in 2024 and 2029
- Exhibits37: Threat of substitutes - Impact of key factors in 2024 and 2029
- Exhibits38: Threat of rivalry - Impact of key factors in 2024 and 2029
- Exhibits39: Chart on Market condition - Five forces 2024 and 2029
- Exhibits40: Chart on Component - Market share 2024-2029 (%)
- Exhibits41: Data Table on Component - Market share 2024-2029 (%)
- Exhibits42: Chart on Comparison by Component
- Exhibits43: Data Table on Comparison by Component
- Exhibits44: Chart on Hardware - Market size and forecast 2024-2029 ($ million)
- Exhibits45: Data Table on Hardware - Market size and forecast 2024-2029 ($ million)
- Exhibits46: Chart on Hardware - Year-over-year growth 2024-2029 (%)
- Exhibits47: Data Table on Hardware - Year-over-year growth 2024-2029 (%)
- Exhibits48: Chart on Software - Market size and forecast 2024-2029 ($ million)
- Exhibits49: Data Table on Software - Market size and forecast 2024-2029 ($ million)
- Exhibits50: Chart on Software - Year-over-year growth 2024-2029 (%)
- Exhibits51: Data Table on Software - Year-over-year growth 2024-2029 (%)
- Exhibits52: Chart on Services - Market size and forecast 2024-2029 ($ million)
- Exhibits53: Data Table on Services - Market size and forecast 2024-2029 ($ million)
- Exhibits54: Chart on Services - Year-over-year growth 2024-2029 (%)
- Exhibits55: Data Table on Services - Year-over-year growth 2024-2029 (%)
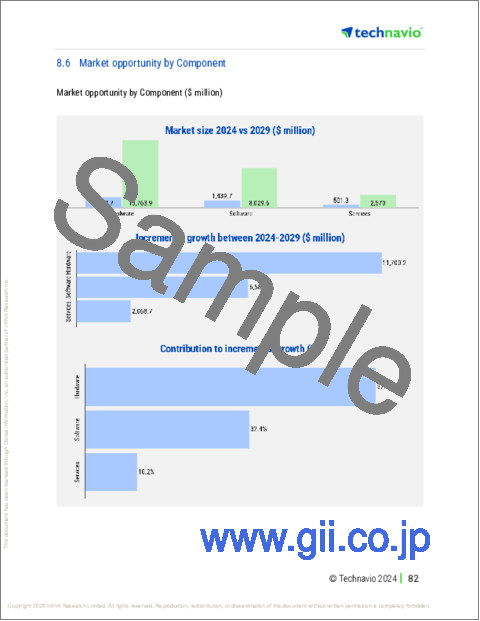
- Exhibits56: Market opportunity by Component ($ million)
- Exhibits57: Data Table on Market opportunity by Component ($ million)
- Exhibits58: Chart on End-user - Market share 2024-2029 (%)
- Exhibits59: Data Table on End-user - Market share 2024-2029 (%)
- Exhibits60: Chart on Comparison by End-user
- Exhibits61: Data Table on Comparison by End-user
- Exhibits62: Chart on Healthcare - Market size and forecast 2024-2029 ($ million)
- Exhibits63: Data Table on Healthcare - Market size and forecast 2024-2029 ($ million)
- Exhibits64: Chart on Healthcare - Year-over-year growth 2024-2029 (%)
- Exhibits65: Data Table on Healthcare - Year-over-year growth 2024-2029 (%)
- Exhibits66: Chart on Media and entertainment - Market size and forecast 2024-2029 ($ million)
- Exhibits67: Data Table on Media and entertainment - Market size and forecast 2024-2029 ($ million)
- Exhibits68: Chart on Media and entertainment - Year-over-year growth 2024-2029 (%)
- Exhibits69: Data Table on Media and entertainment - Year-over-year growth 2024-2029 (%)
- Exhibits70: Chart on Education - Market size and forecast 2024-2029 ($ million)
- Exhibits71: Data Table on Education - Market size and forecast 2024-2029 ($ million)
- Exhibits72: Chart on Education - Year-over-year growth 2024-2029 (%)
- Exhibits73: Data Table on Education - Year-over-year growth 2024-2029 (%)
- Exhibits74: Chart on Retail - Market size and forecast 2024-2029 ($ million)
- Exhibits75: Data Table on Retail - Market size and forecast 2024-2029 ($ million)
- Exhibits76: Chart on Retail - Year-over-year growth 2024-2029 (%)
- Exhibits77: Data Table on Retail - Year-over-year growth 2024-2029 (%)
- Exhibits78: Chart on Others - Market size and forecast 2024-2029 ($ million)
- Exhibits79: Data Table on Others - Market size and forecast 2024-2029 ($ million)
- Exhibits80: Chart on Others - Year-over-year growth 2024-2029 (%)
- Exhibits81: Data Table on Others - Year-over-year growth 2024-2029 (%)
- Exhibits82: Market opportunity by End-user ($ million)
- Exhibits83: Data Table on Market opportunity by End-user ($ million)
- Exhibits84: Chart on Technology - Market share 2024-2029 (%)
- Exhibits85: Data Table on Technology - Market share 2024-2029 (%)
- Exhibits86: Chart on Comparison by Technology
- Exhibits87: Data Table on Comparison by Technology
- Exhibits88: Chart on Machine learning - Market size and forecast 2024-2029 ($ million)
- Exhibits89: Data Table on Machine learning - Market size and forecast 2024-2029 ($ million)
- Exhibits90: Chart on Machine learning - Year-over-year growth 2024-2029 (%)
- Exhibits91: Data Table on Machine learning - Year-over-year growth 2024-2029 (%)
- Exhibits92: Chart on Computer vision - Market size and forecast 2024-2029 ($ million)
- Exhibits93: Data Table on Computer vision - Market size and forecast 2024-2029 ($ million)
- Exhibits94: Chart on Computer vision - Year-over-year growth 2024-2029 (%)
- Exhibits95: Data Table on Computer vision - Year-over-year growth 2024-2029 (%)
- Exhibits96: Chart on Context awareness - Market size and forecast 2024-2029 ($ million)
- Exhibits97: Data Table on Context awareness - Market size and forecast 2024-2029 ($ million)
- Exhibits98: Chart on Context awareness - Year-over-year growth 2024-2029 (%)
- Exhibits99: Data Table on Context awareness - Year-over-year growth 2024-2029 (%)
- Exhibits100: Chart on Natural language processing - Market size and forecast 2024-2029 ($ million)
- Exhibits101: Data Table on Natural language processing - Market size and forecast 2024-2029 ($ million)
- Exhibits102: Chart on Natural language processing - Year-over-year growth 2024-2029 (%)
- Exhibits103: Data Table on Natural language processing - Year-over-year growth 2024-2029 (%)
- Exhibits104: Market opportunity by Technology ($ million)
- Exhibits105: Data Table on Market opportunity by Technology ($ million)
- Exhibits106: Chart on Mobility Type - Market share 2024-2029 (%)
- Exhibits107: Data Table on Mobility Type - Market share 2024-2029 (%)
- Exhibits108: Chart on Comparison by Mobility Type
- Exhibits109: Data Table on Comparison by Mobility Type
- Exhibits110: Chart on Mobile robots - Market size and forecast 2024-2029 ($ million)
- Exhibits111: Data Table on Mobile robots - Market size and forecast 2024-2029 ($ million)
- Exhibits112: Chart on Mobile robots - Year-over-year growth 2024-2029 (%)
- Exhibits113: Data Table on Mobile robots - Year-over-year growth 2024-2029 (%)
- Exhibits114: Chart on Fixed robots - Market size and forecast 2024-2029 ($ million)
- Exhibits115: Data Table on Fixed robots - Market size and forecast 2024-2029 ($ million)
- Exhibits116: Chart on Fixed robots - Year-over-year growth 2024-2029 (%)
- Exhibits117: Data Table on Fixed robots - Year-over-year growth 2024-2029 (%)
- Exhibits118: Market opportunity by Mobility Type ($ million)
- Exhibits119: Data Table on Market opportunity by Mobility Type ($ million)
- Exhibits120: Analysis of price sensitivity, lifecycle, customer purchase basket, adoption rates, and purchase criteria
- Exhibits121: Chart on Market share By Geographical Landscape 2024-2029 (%)
- Exhibits122: Data Table on Market share By Geographical Landscape 2024-2029 (%)
- Exhibits123: Chart on Geographic comparison
- Exhibits124: Data Table on Geographic comparison
- Exhibits125: Chart on APAC - Market size and forecast 2024-2029 ($ million)
- Exhibits126: Data Table on APAC - Market size and forecast 2024-2029 ($ million)
- Exhibits127: Chart on APAC - Year-over-year growth 2024-2029 (%)
- Exhibits128: Data Table on APAC - Year-over-year growth 2024-2029 (%)
- Exhibits129: Chart on North America - Market size and forecast 2024-2029 ($ million)
- Exhibits130: Data Table on North America - Market size and forecast 2024-2029 ($ million)
- Exhibits131: Chart on North America - Year-over-year growth 2024-2029 (%)
- Exhibits132: Data Table on North America - Year-over-year growth 2024-2029 (%)
- Exhibits133: Chart on Europe - Market size and forecast 2024-2029 ($ million)
- Exhibits134: Data Table on Europe - Market size and forecast 2024-2029 ($ million)
- Exhibits135: Chart on Europe - Year-over-year growth 2024-2029 (%)
- Exhibits136: Data Table on Europe - Year-over-year growth 2024-2029 (%)
- Exhibits137: Chart on Middle East and Africa - Market size and forecast 2024-2029 ($ million)
- Exhibits138: Data Table on Middle East and Africa - Market size and forecast 2024-2029 ($ million)
- Exhibits139: Chart on Middle East and Africa - Year-over-year growth 2024-2029 (%)
- Exhibits140: Data Table on Middle East and Africa - Year-over-year growth 2024-2029 (%)
- Exhibits141: Chart on South America - Market size and forecast 2024-2029 ($ million)
- Exhibits142: Data Table on South America - Market size and forecast 2024-2029 ($ million)
- Exhibits143: Chart on South America - Year-over-year growth 2024-2029 (%)
- Exhibits144: Data Table on South America - Year-over-year growth 2024-2029 (%)
- Exhibits145: Chart on US - Market size and forecast 2024-2029 ($ million)
- Exhibits146: Data Table on US - Market size and forecast 2024-2029 ($ million)
- Exhibits147: Chart on US - Year-over-year growth 2024-2029 (%)
- Exhibits148: Data Table on US - Year-over-year growth 2024-2029 (%)
- Exhibits149: Chart on China - Market size and forecast 2024-2029 ($ million)
- Exhibits150: Data Table on China - Market size and forecast 2024-2029 ($ million)
- Exhibits151: Chart on China - Year-over-year growth 2024-2029 (%)
- Exhibits152: Data Table on China - Year-over-year growth 2024-2029 (%)
- Exhibits153: Chart on UK - Market size and forecast 2024-2029 ($ million)
- Exhibits154: Data Table on UK - Market size and forecast 2024-2029 ($ million)
- Exhibits155: Chart on UK - Year-over-year growth 2024-2029 (%)
- Exhibits156: Data Table on UK - Year-over-year growth 2024-2029 (%)
- Exhibits157: Chart on Japan - Market size and forecast 2024-2029 ($ million)
- Exhibits158: Data Table on Japan - Market size and forecast 2024-2029 ($ million)
- Exhibits159: Chart on Japan - Year-over-year growth 2024-2029 (%)
- Exhibits160: Data Table on Japan - Year-over-year growth 2024-2029 (%)
- Exhibits161: Chart on Canada - Market size and forecast 2024-2029 ($ million)
- Exhibits162: Data Table on Canada - Market size and forecast 2024-2029 ($ million)
- Exhibits163: Chart on Canada - Year-over-year growth 2024-2029 (%)
- Exhibits164: Data Table on Canada - Year-over-year growth 2024-2029 (%)
- Exhibits165: Chart on India - Market size and forecast 2024-2029 ($ million)
- Exhibits166: Data Table on India - Market size and forecast 2024-2029 ($ million)
- Exhibits167: Chart on India - Year-over-year growth 2024-2029 (%)
- Exhibits168: Data Table on India - Year-over-year growth 2024-2029 (%)
- Exhibits169: Chart on Germany - Market size and forecast 2024-2029 ($ million)
- Exhibits170: Data Table on Germany - Market size and forecast 2024-2029 ($ million)
- Exhibits171: Chart on Germany - Year-over-year growth 2024-2029 (%)
- Exhibits172: Data Table on Germany - Year-over-year growth 2024-2029 (%)
- Exhibits173: Chart on South Korea - Market size and forecast 2024-2029 ($ million)
- Exhibits174: Data Table on South Korea - Market size and forecast 2024-2029 ($ million)
- Exhibits175: Chart on South Korea - Year-over-year growth 2024-2029 (%)
- Exhibits176: Data Table on South Korea - Year-over-year growth 2024-2029 (%)
- Exhibits177: Chart on France - Market size and forecast 2024-2029 ($ million)
- Exhibits178: Data Table on France - Market size and forecast 2024-2029 ($ million)
- Exhibits179: Chart on France - Year-over-year growth 2024-2029 (%)
- Exhibits180: Data Table on France - Year-over-year growth 2024-2029 (%)
- Exhibits181: Chart on Australia - Market size and forecast 2024-2029 ($ million)
- Exhibits182: Data Table on Australia - Market size and forecast 2024-2029 ($ million)
- Exhibits183: Chart on Australia - Year-over-year growth 2024-2029 (%)
- Exhibits184: Data Table on Australia - Year-over-year growth 2024-2029 (%)
- Exhibits185: Market opportunity By Geographical Landscape ($ million)
- Exhibits186: Data Tables on Market opportunity By Geographical Landscape ($ million)
- Exhibits187: Impact of drivers and challenges in 2024 and 2029
- Exhibits188: Overview on criticality of inputs and factors of differentiation
- Exhibits189: Overview on factors of disruption
- Exhibits190: Impact of key risks on business
- Exhibits191: Companies covered
- Exhibits192: Company ranking index
- Exhibits193: Matrix on companies position and classification
- Exhibits194: Aethon Inc. - Overview
- Exhibits195: Aethon Inc. - Product / Service
- Exhibits196: Aethon Inc. - Key offerings
- Exhibits197: SWOT
- Exhibits198: Aldebaran - Overview
- Exhibits199: Aldebaran - Product / Service
- Exhibits200: Aldebaran - Key offerings
- Exhibits201: SWOT
- Exhibits202: BLUE FROG ROBOTICS SAS - Overview
- Exhibits203: BLUE FROG ROBOTICS SAS - Product / Service
- Exhibits204: BLUE FROG ROBOTICS SAS - Key offerings
- Exhibits205: SWOT
- Exhibits206: Boston Dynamics Inc. - Overview
- Exhibits207: Boston Dynamics Inc. - Product / Service
- Exhibits208: Boston Dynamics Inc. - Key offerings
- Exhibits209: SWOT
- Exhibits210: Diligent Robotics Inc. - Overview
- Exhibits211: Diligent Robotics Inc. - Product / Service
- Exhibits212: Diligent Robotics Inc. - Key offerings
- Exhibits213: SWOT
- Exhibits214: Engineered Arts Ltd. - Overview
- Exhibits215: Engineered Arts Ltd. - Product / Service
- Exhibits216: Engineered Arts Ltd. - Key offerings
- Exhibits217: SWOT
- Exhibits218: Furhat Robotics AB - Overview
- Exhibits219: Furhat Robotics AB - Product / Service
- Exhibits220: Furhat Robotics AB - Key offerings
- Exhibits221: SWOT
- Exhibits222: Hitachi Ltd. - Overview
- Exhibits223: Hitachi Ltd. - Business segments
- Exhibits224: Hitachi Ltd. - Key news
- Exhibits225: Hitachi Ltd. - Key offerings
- Exhibits226: Hitachi Ltd. - Segment focus
- Exhibits227: SWOT
- Exhibits228: Knightscope Inc. - Overview
- Exhibits229: Knightscope Inc. - Product / Service
- Exhibits230: Knightscope Inc. - Key news
- Exhibits231: Knightscope Inc. - Key offerings
- Exhibits232: SWOT
- Exhibits233: MOVIA Robotics Inc. - Overview
- Exhibits234: MOVIA Robotics Inc. - Product / Service
- Exhibits235: MOVIA Robotics Inc. - Key offerings
- Exhibits236: SWOT
- Exhibits237: PAL Robotics - Overview
- Exhibits238: PAL Robotics - Product / Service
- Exhibits239: PAL Robotics - Key offerings
- Exhibits240: SWOT
- Exhibits241: Relay Robotics Inc. - Overview
- Exhibits242: Relay Robotics Inc. - Product / Service
- Exhibits243: Relay Robotics Inc. - Key offerings
- Exhibits244: SWOT
- Exhibits245: Toyota Motor Corp. - Overview
- Exhibits246: Toyota Motor Corp. - Business segments
- Exhibits247: Toyota Motor Corp. - Key news
- Exhibits248: Toyota Motor Corp. - Key offerings
- Exhibits249: Toyota Motor Corp. - Segment focus
- Exhibits250: SWOT
- Exhibits251: UBTECH Robotics Inc. - Overview
- Exhibits252: UBTECH Robotics Inc. - Product / Service
- Exhibits253: UBTECH Robotics Inc. - Key news
- Exhibits254: UBTECH Robotics Inc. - Key offerings
- Exhibits255: SWOT
- Exhibits256: Yukai Engineering Inc. - Overview
- Exhibits257: Yukai Engineering Inc. - Product / Service
- Exhibits258: Yukai Engineering Inc. - Key offerings
- Exhibits259: SWOT
- Exhibits260: Inclusions checklist
- Exhibits261: Exclusions checklist
- Exhibits262: Currency conversion rates for US$
- Exhibits263: Research methodology
- Exhibits264: Information sources
- Exhibits265: Data validation
- Exhibits266: Validation techniques employed for market sizing
- Exhibits267: Data synthesis
- Exhibits268: 360 degree market analysis
- Exhibits269: List of abbreviations
The social robots market is forecasted to grow by USD 20358.8 mn during 2024-2029, accelerating at a CAGR of 43.5% during the forecast period. The report on the social robots market provides a holistic analysis, market size and forecast, trends, growth drivers, and challenges, as well as vendor analysis covering around 25 vendors.
The report offers an up-to-date analysis regarding the current market scenario, the latest trends and drivers, and the overall market environment. The market is driven by technological advances in social robots, increasing government support for development of advanced social robots, and preference for robots over traditional security methods.
| Market Scope | |
|---|---|
| Base Year | 2025 |
| End Year | 2029 |
| Series Year | 2025-2029 |
| Growth Momentum | Accelerate |
| YOY 2025 | 33.5% |
| CAGR | 43.5% |
| Incremental Value | $20358.8 mn |
The study was conducted using an objective combination of primary and secondary information including inputs from key participants in the industry. The report contains a comprehensive market size data, segment with regional analysis and vendor landscape in addition to an analysis of the key companies. Reports have historic and forecast data.
Technavio's social robots market is segmented as below:
By Component
- Hardware
- Software
- Services
By End-user
- Healthcare
- Media and entertainment
- Education
- Retail
- Others
By Technology
- Machine learning
- Computer vision
- Context awareness
- Natural language processing
By Mobility Type
- Mobile robots
- Fixed robots
By Geographical Landscape
- APAC
- North America
- Europe
- Middle East and Africa
- South America
This study identifies the increasing focus on enhancing battery life as one of the prime reasons driving the social robots market growth during the next few years. Also, rising number adoption of social robots in hospitality industry and iot integration in robots will lead to sizable demand in the market.
The report on the social robots market covers the following areas:
- Social Robots Market sizing
- Social Robots Market forecast
- Social Robots Market industry analysis
The robust vendor analysis is designed to help clients improve their market position, and in line with this, this report provides a detailed analysis of several leading social robots market vendors that include Aethon Inc., Aldebaran, BLUE FROG ROBOTICS SAS, Boston Dynamics Inc., Diligent Robotics Inc., Engineered Arts Ltd., Furhat Robotics AB, Haapie SAS, Hitachi Ltd., Intuition Robotics Ltd., Knightscope Inc., Kompai Robotics, MOVIA Robotics Inc., Moxie Robot, Navel robotics GmbH, PAL Robotics, Relay Robotics Inc., Toyota Motor Corp., UBTECH Robotics Inc., and Yukai Engineering Inc.. Also, the social robots market analysis report includes information on upcoming trends and challenges that will influence market growth. This is to help companies strategize and leverage all forthcoming growth opportunities.
The publisher presents a detailed picture of the market by the way of study, synthesis, and summation of data from multiple sources by an analysis of key parameters such as profit, pricing, competition, and promotions. It presents various market facets by identifying the key industry influencers. The data presented is comprehensive, reliable, and a result of extensive primary and secondary research. The market research reports provide a complete competitive landscape and an in-depth vendor selection methodology and analysis using qualitative and quantitative research to forecast accurate market growth.
Table of Contents
1 Executive Summary
- 1.1 Market overview
- Executive Summary - Chart on Market Overview
- Executive Summary - Data Table on Market Overview
- Executive Summary - Chart on Global Market Characteristics
- Executive Summary - Chart on Market By Geographical Landscape
- Executive Summary - Chart on Market Segmentation by Component
- Executive Summary - Chart on Market Segmentation by End-user
- Executive Summary - Chart on Market Segmentation by Technology
- Executive Summary - Chart on Market Segmentation by Mobility Type
- Executive Summary - Chart on Incremental Growth
- Executive Summary - Data Table on Incremental Growth
- Executive Summary - Chart on Company Market Positioning
2 Technavio Analysis
- 2.1 Analysis of price sensitivity, lifecycle, customer purchase basket, adoption rates, and purchase criteria
- Analysis of price sensitivity, lifecycle, customer purchase basket, adoption rates, and purchase criteria
- 2.2 Criticality of inputs and Factors of differentiation
- Overview on criticality of inputs and factors of differentiation
- 2.3 Factors of disruption
- Overview on factors of disruption
- 2.4 Impact of drivers and challenges
- Impact of drivers and challenges in 2024 and 2029
3 Market Landscape
- 3.1 Market ecosystem
- Parent Market
- Data Table on - Parent Market
- 3.2 Market characteristics
- Market characteristics analysis
- 3.3 Value chain analysis
- Value chain analysis
4 Market Sizing
- 4.1 Market definition
- Offerings of companies included in the market definition
- 4.2 Market segment analysis
- Market segments
- 4.3 Market size 2024
- 4.4 Market outlook: Forecast for 2024-2029
- Chart on Global - Market size and forecast 2024-2029 ($ million)
- Data Table on Global - Market size and forecast 2024-2029 ($ million)
- Chart on Global Market: Year-over-year growth 2024-2029 (%)
- Data Table on Global Market: Year-over-year growth 2024-2029 (%)
5 Historic Market Size
- 5.1 Global Social Robots Market 2019 - 2023
- Historic Market Size - Data Table on Global Social Robots Market 2019 - 2023 ($ million)
- 5.2 Component segment analysis 2019 - 2023
- Historic Market Size - Component Segment 2019 - 2023 ($ million)
- 5.3 End-user segment analysis 2019 - 2023
- Historic Market Size - End-user Segment 2019 - 2023 ($ million)
- 5.4 Technology segment analysis 2019 - 2023
- Historic Market Size - Technology Segment 2019 - 2023 ($ million)
- 5.5 Mobility Type segment analysis 2019 - 2023
- Historic Market Size - Mobility Type Segment 2019 - 2023 ($ million)
- 5.6 Geography segment analysis 2019 - 2023
- Historic Market Size - Geography Segment 2019 - 2023 ($ million)
- 5.7 Country segment analysis 2019 - 2023
- Historic Market Size - Country Segment 2019 - 2023 ($ million)
6 Qualitative Analysis
- 6.1 Impact of AI on Global Social Robots Market
7 Five Forces Analysis
- 7.1 Five forces summary
- Five forces analysis - Comparison between 2024 and 2029
- 7.2 Bargaining power of buyers
- Bargaining power of buyers - Impact of key factors 2024 and 2029
- 7.3 Bargaining power of suppliers
- Bargaining power of suppliers - Impact of key factors in 2024 and 2029
- 7.4 Threat of new entrants
- Threat of new entrants - Impact of key factors in 2024 and 2029
- 7.5 Threat of substitutes
- Threat of substitutes - Impact of key factors in 2024 and 2029
- 7.6 Threat of rivalry
- Threat of rivalry - Impact of key factors in 2024 and 2029
- 7.7 Market condition
- Chart on Market condition - Five forces 2024 and 2029
8 Market Segmentation by Component
- 8.1 Market segments
- Chart on Component - Market share 2024-2029 (%)
- Data Table on Component - Market share 2024-2029 (%)
- 8.2 Comparison by Component
- Chart on Comparison by Component
- Data Table on Comparison by Component
- 8.3 Hardware - Market size and forecast 2024-2029
- Chart on Hardware - Market size and forecast 2024-2029 ($ million)
- Data Table on Hardware - Market size and forecast 2024-2029 ($ million)
- Chart on Hardware - Year-over-year growth 2024-2029 (%)
- Data Table on Hardware - Year-over-year growth 2024-2029 (%)
- 8.4 Software - Market size and forecast 2024-2029
- Chart on Software - Market size and forecast 2024-2029 ($ million)
- Data Table on Software - Market size and forecast 2024-2029 ($ million)
- Chart on Software - Year-over-year growth 2024-2029 (%)
- Data Table on Software - Year-over-year growth 2024-2029 (%)
- 8.5 Services - Market size and forecast 2024-2029
- Chart on Services - Market size and forecast 2024-2029 ($ million)
- Data Table on Services - Market size and forecast 2024-2029 ($ million)
- Chart on Services - Year-over-year growth 2024-2029 (%)
- Data Table on Services - Year-over-year growth 2024-2029 (%)
- 8.6 Market opportunity by Component
- Market opportunity by Component ($ million)
- Data Table on Market opportunity by Component ($ million)
9 Market Segmentation by End-user
- 9.1 Market segments
- Chart on End-user - Market share 2024-2029 (%)
- Data Table on End-user - Market share 2024-2029 (%)
- 9.2 Comparison by End-user
- Chart on Comparison by End-user
- Data Table on Comparison by End-user
- 9.3 Healthcare - Market size and forecast 2024-2029
- Chart on Healthcare - Market size and forecast 2024-2029 ($ million)
- Data Table on Healthcare - Market size and forecast 2024-2029 ($ million)
- Chart on Healthcare - Year-over-year growth 2024-2029 (%)
- Data Table on Healthcare - Year-over-year growth 2024-2029 (%)
- 9.4 Media and entertainment - Market size and forecast 2024-2029
- Chart on Media and entertainment - Market size and forecast 2024-2029 ($ million)
- Data Table on Media and entertainment - Market size and forecast 2024-2029 ($ million)
- Chart on Media and entertainment - Year-over-year growth 2024-2029 (%)
- Data Table on Media and entertainment - Year-over-year growth 2024-2029 (%)
- 9.5 Education - Market size and forecast 2024-2029
- Chart on Education - Market size and forecast 2024-2029 ($ million)
- Data Table on Education - Market size and forecast 2024-2029 ($ million)
- Chart on Education - Year-over-year growth 2024-2029 (%)
- Data Table on Education - Year-over-year growth 2024-2029 (%)
- 9.6 Retail - Market size and forecast 2024-2029
- Chart on Retail - Market size and forecast 2024-2029 ($ million)
- Data Table on Retail - Market size and forecast 2024-2029 ($ million)
- Chart on Retail - Year-over-year growth 2024-2029 (%)
- Data Table on Retail - Year-over-year growth 2024-2029 (%)
- 9.7 Others - Market size and forecast 2024-2029
- Chart on Others - Market size and forecast 2024-2029 ($ million)
- Data Table on Others - Market size and forecast 2024-2029 ($ million)
- Chart on Others - Year-over-year growth 2024-2029 (%)
- Data Table on Others - Year-over-year growth 2024-2029 (%)
- 9.8 Market opportunity by End-user
- Market opportunity by End-user ($ million)
- Data Table on Market opportunity by End-user ($ million)
10 Market Segmentation by Technology
- 10.1 Market segments
- Chart on Technology - Market share 2024-2029 (%)
- Data Table on Technology - Market share 2024-2029 (%)
- 10.2 Comparison by Technology
- Chart on Comparison by Technology
- Data Table on Comparison by Technology
- 10.3 Machine learning - Market size and forecast 2024-2029
- Chart on Machine learning - Market size and forecast 2024-2029 ($ million)
- Data Table on Machine learning - Market size and forecast 2024-2029 ($ million)
- Chart on Machine learning - Year-over-year growth 2024-2029 (%)
- Data Table on Machine learning - Year-over-year growth 2024-2029 (%)
- 10.4 Computer vision - Market size and forecast 2024-2029
- Chart on Computer vision - Market size and forecast 2024-2029 ($ million)
- Data Table on Computer vision - Market size and forecast 2024-2029 ($ million)
- Chart on Computer vision - Year-over-year growth 2024-2029 (%)
- Data Table on Computer vision - Year-over-year growth 2024-2029 (%)
- 10.5 Context awareness - Market size and forecast 2024-2029
- Chart on Context awareness - Market size and forecast 2024-2029 ($ million)
- Data Table on Context awareness - Market size and forecast 2024-2029 ($ million)
- Chart on Context awareness - Year-over-year growth 2024-2029 (%)
- Data Table on Context awareness - Year-over-year growth 2024-2029 (%)
- 10.6 Natural language processing - Market size and forecast 2024-2029
- Chart on Natural language processing - Market size and forecast 2024-2029 ($ million)
- Data Table on Natural language processing - Market size and forecast 2024-2029 ($ million)
- Chart on Natural language processing - Year-over-year growth 2024-2029 (%)
- Data Table on Natural language processing - Year-over-year growth 2024-2029 (%)
- 10.7 Market opportunity by Technology
- Market opportunity by Technology ($ million)
- Data Table on Market opportunity by Technology ($ million)
11 Market Segmentation by Mobility Type
- 11.1 Market segments
- Chart on Mobility Type - Market share 2024-2029 (%)
- Data Table on Mobility Type - Market share 2024-2029 (%)
- 11.2 Comparison by Mobility Type
- Chart on Comparison by Mobility Type
- Data Table on Comparison by Mobility Type
- 11.3 Mobile robots - Market size and forecast 2024-2029
- Chart on Mobile robots - Market size and forecast 2024-2029 ($ million)
- Data Table on Mobile robots - Market size and forecast 2024-2029 ($ million)
- Chart on Mobile robots - Year-over-year growth 2024-2029 (%)
- Data Table on Mobile robots - Year-over-year growth 2024-2029 (%)
- 11.4 Fixed robots - Market size and forecast 2024-2029
- Chart on Fixed robots - Market size and forecast 2024-2029 ($ million)
- Data Table on Fixed robots - Market size and forecast 2024-2029 ($ million)
- Chart on Fixed robots - Year-over-year growth 2024-2029 (%)
- Data Table on Fixed robots - Year-over-year growth 2024-2029 (%)
- 11.5 Market opportunity by Mobility Type
- Market opportunity by Mobility Type ($ million)
- Data Table on Market opportunity by Mobility Type ($ million)
12 Customer Landscape
- 12.1 Customer landscape overview
- Analysis of price sensitivity, lifecycle, customer purchase basket, adoption rates, and purchase criteria
13 Geographic Landscape
- 13.1 Geographic segmentation
- Chart on Market share By Geographical Landscape 2024-2029 (%)
- Data Table on Market share By Geographical Landscape 2024-2029 (%)
- 13.2 Geographic comparison
- Chart on Geographic comparison
- Data Table on Geographic comparison
- 13.3 APAC - Market size and forecast 2024-2029
- Chart on APAC - Market size and forecast 2024-2029 ($ million)
- Data Table on APAC - Market size and forecast 2024-2029 ($ million)
- Chart on APAC - Year-over-year growth 2024-2029 (%)
- Data Table on APAC - Year-over-year growth 2024-2029 (%)
- 13.4 North America - Market size and forecast 2024-2029
- Chart on North America - Market size and forecast 2024-2029 ($ million)
- Data Table on North America - Market size and forecast 2024-2029 ($ million)
- Chart on North America - Year-over-year growth 2024-2029 (%)
- Data Table on North America - Year-over-year growth 2024-2029 (%)
- 13.5 Europe - Market size and forecast 2024-2029
- Chart on Europe - Market size and forecast 2024-2029 ($ million)
- Data Table on Europe - Market size and forecast 2024-2029 ($ million)
- Chart on Europe - Year-over-year growth 2024-2029 (%)
- Data Table on Europe - Year-over-year growth 2024-2029 (%)
- 13.6 Middle East and Africa - Market size and forecast 2024-2029
- Chart on Middle East and Africa - Market size and forecast 2024-2029 ($ million)
- Data Table on Middle East and Africa - Market size and forecast 2024-2029 ($ million)
- Chart on Middle East and Africa - Year-over-year growth 2024-2029 (%)
- Data Table on Middle East and Africa - Year-over-year growth 2024-2029 (%)
- 13.7 South America - Market size and forecast 2024-2029
- Chart on South America - Market size and forecast 2024-2029 ($ million)
- Data Table on South America - Market size and forecast 2024-2029 ($ million)
- Chart on South America - Year-over-year growth 2024-2029 (%)
- Data Table on South America - Year-over-year growth 2024-2029 (%)
- 13.8 US - Market size and forecast 2024-2029
- Chart on US - Market size and forecast 2024-2029 ($ million)
- Data Table on US - Market size and forecast 2024-2029 ($ million)
- Chart on US - Year-over-year growth 2024-2029 (%)
- Data Table on US - Year-over-year growth 2024-2029 (%)
- 13.9 China - Market size and forecast 2024-2029
- Chart on China - Market size and forecast 2024-2029 ($ million)
- Data Table on China - Market size and forecast 2024-2029 ($ million)
- Chart on China - Year-over-year growth 2024-2029 (%)
- Data Table on China - Year-over-year growth 2024-2029 (%)
- 13.10 UK - Market size and forecast 2024-2029
- Chart on UK - Market size and forecast 2024-2029 ($ million)
- Data Table on UK - Market size and forecast 2024-2029 ($ million)
- Chart on UK - Year-over-year growth 2024-2029 (%)
- Data Table on UK - Year-over-year growth 2024-2029 (%)
- 13.11 Japan - Market size and forecast 2024-2029
- Chart on Japan - Market size and forecast 2024-2029 ($ million)
- Data Table on Japan - Market size and forecast 2024-2029 ($ million)
- Chart on Japan - Year-over-year growth 2024-2029 (%)
- Data Table on Japan - Year-over-year growth 2024-2029 (%)
- 13.12 Canada - Market size and forecast 2024-2029
- Chart on Canada - Market size and forecast 2024-2029 ($ million)
- Data Table on Canada - Market size and forecast 2024-2029 ($ million)
- Chart on Canada - Year-over-year growth 2024-2029 (%)
- Data Table on Canada - Year-over-year growth 2024-2029 (%)
- 13.13 India - Market size and forecast 2024-2029
- Chart on India - Market size and forecast 2024-2029 ($ million)
- Data Table on India - Market size and forecast 2024-2029 ($ million)
- Chart on India - Year-over-year growth 2024-2029 (%)
- Data Table on India - Year-over-year growth 2024-2029 (%)
- 13.14 Germany - Market size and forecast 2024-2029
- Chart on Germany - Market size and forecast 2024-2029 ($ million)
- Data Table on Germany - Market size and forecast 2024-2029 ($ million)
- Chart on Germany - Year-over-year growth 2024-2029 (%)
- Data Table on Germany - Year-over-year growth 2024-2029 (%)
- 13.15 South Korea - Market size and forecast 2024-2029
- Chart on South Korea - Market size and forecast 2024-2029 ($ million)
- Data Table on South Korea - Market size and forecast 2024-2029 ($ million)
- Chart on South Korea - Year-over-year growth 2024-2029 (%)
- Data Table on South Korea - Year-over-year growth 2024-2029 (%)
- 13.16 France - Market size and forecast 2024-2029
- Chart on France - Market size and forecast 2024-2029 ($ million)
- Data Table on France - Market size and forecast 2024-2029 ($ million)
- Chart on France - Year-over-year growth 2024-2029 (%)
- Data Table on France - Year-over-year growth 2024-2029 (%)
- 13.17 Australia - Market size and forecast 2024-2029
- Chart on Australia - Market size and forecast 2024-2029 ($ million)
- Data Table on Australia - Market size and forecast 2024-2029 ($ million)
- Chart on Australia - Year-over-year growth 2024-2029 (%)
- Data Table on Australia - Year-over-year growth 2024-2029 (%)
- 13.18 Market opportunity By Geographical Landscape
- Market opportunity By Geographical Landscape ($ million)
- Data Tables on Market opportunity By Geographical Landscape ($ million)
14 Drivers, Challenges, and Opportunity/Restraints
- 14.1 Market drivers
- 14.2 Market challenges
- 14.3 Impact of drivers and challenges
- Impact of drivers and challenges in 2024 and 2029
- 14.4 Market opportunities/restraints
15 Competitive Landscape
- 15.1 Overview
- 15.2 Competitive Landscape
- Overview on criticality of inputs and factors of differentiation
- 15.3 Landscape disruption
- Overview on factors of disruption
- 15.4 Industry risks
- Impact of key risks on business
16 Competitive Analysis
- 16.1 Companies profiled
- Companies covered
- 16.2 Company ranking index
- Company ranking index
- 16.3 Market positioning of companies
- Matrix on companies position and classification
- 16.4 Aethon Inc.
- Aethon Inc. - Overview
- Aethon Inc. - Product / Service
- Aethon Inc. - Key offerings
- SWOT
- 16.5 Aldebaran
- Aldebaran - Overview
- Aldebaran - Product / Service
- Aldebaran - Key offerings
- SWOT
- 16.6 BLUE FROG ROBOTICS SAS
- BLUE FROG ROBOTICS SAS - Overview
- BLUE FROG ROBOTICS SAS - Product / Service
- BLUE FROG ROBOTICS SAS - Key offerings
- SWOT
- 16.7 Boston Dynamics Inc.
- Boston Dynamics Inc. - Overview
- Boston Dynamics Inc. - Product / Service
- Boston Dynamics Inc. - Key offerings
- SWOT
- 16.8 Diligent Robotics Inc.
- Diligent Robotics Inc. - Overview
- Diligent Robotics Inc. - Product / Service
- Diligent Robotics Inc. - Key offerings
- SWOT
- 16.9 Engineered Arts Ltd.
- Engineered Arts Ltd. - Overview
- Engineered Arts Ltd. - Product / Service
- Engineered Arts Ltd. - Key offerings
- SWOT
- 16.10 Furhat Robotics AB
- Furhat Robotics AB - Overview
- Furhat Robotics AB - Product / Service
- Furhat Robotics AB - Key offerings
- SWOT
- 16.11 Hitachi Ltd.
- Hitachi Ltd. - Overview
- Hitachi Ltd. - Business segments
- Hitachi Ltd. - Key news
- Hitachi Ltd. - Key offerings
- Hitachi Ltd. - Segment focus
- SWOT
- 16.12 Knightscope Inc.
- Knightscope Inc. - Overview
- Knightscope Inc. - Product / Service
- Knightscope Inc. - Key news
- Knightscope Inc. - Key offerings
- SWOT
- 16.13 MOVIA Robotics Inc.
- MOVIA Robotics Inc. - Overview
- MOVIA Robotics Inc. - Product / Service
- MOVIA Robotics Inc. - Key offerings
- SWOT
- 16.14 PAL Robotics
- PAL Robotics - Overview
- PAL Robotics - Product / Service
- PAL Robotics - Key offerings
- SWOT
- 16.15 Relay Robotics Inc.
- Relay Robotics Inc. - Overview
- Relay Robotics Inc. - Product / Service
- Relay Robotics Inc. - Key offerings
- SWOT
- 16.16 Toyota Motor Corp.
- Toyota Motor Corp. - Overview
- Toyota Motor Corp. - Business segments
- Toyota Motor Corp. - Key news
- Toyota Motor Corp. - Key offerings
- Toyota Motor Corp. - Segment focus
- SWOT
- 16.17 UBTECH Robotics Inc.
- UBTECH Robotics Inc. - Overview
- UBTECH Robotics Inc. - Product / Service
- UBTECH Robotics Inc. - Key news
- UBTECH Robotics Inc. - Key offerings
- SWOT
- 16.18 Yukai Engineering Inc.
- Yukai Engineering Inc. - Overview
- Yukai Engineering Inc. - Product / Service
- Yukai Engineering Inc. - Key offerings
- SWOT
17 Appendix
- 17.1 Scope of the report
- 17.2 Inclusions and exclusions checklist
- Inclusions checklist
- Exclusions checklist
- 17.3 Currency conversion rates for US$
- Currency conversion rates for US$
- 17.4 Research methodology
- Research methodology
- 17.5 Data procurement
- Information sources
- 17.6 Data validation
- Data validation
- 17.7 Validation techniques employed for market sizing
- Validation techniques employed for market sizing
- 17.8 Data synthesis
- Data synthesis
- 17.9 360 degree market analysis
- 360 degree market analysis
- 17.10 List of abbreviations
- List of abbreviations

