|
|
市場調査レポート
商品コード
1525113
酒精強化ワインの世界市場 2024-2028Global fortified wine market 2024-2028 |
||||||
|
|||||||
カスタマイズ可能
|
|||||||

| 酒精強化ワインの世界市場 2024-2028 |
|
出版日: 2024年07月09日
発行: TechNavio
ページ情報: 英文 152 Pages
納期: 即納可能
|

全表示
- 概要
- 図表
- 目次
酒精強化ワイン市場は2023-2028年に43億8,150万米ドル、予測期間中のCAGRは4.36%で成長すると予測されます。
当レポートでは、酒精強化ワイン市場の全体的な分析、市場規模・予測、動向、成長促進要因、課題、約25のベンダーを網羅したベンダー分析などを掲載しています。
現在の市場シナリオ、最新動向と促進要因、市場環境全体に関する最新分析を提供しています。市場は、ワイン消費率の上昇、プレミアムワインへの嗜好の高まり、希少ワインやコレクターズワインへの需要の高まりによって牽引されています。
| 市場範囲 | |
|---|---|
| 基準年 | 2024 |
| 終了年 | 2028 |
| 予測期間 | 2024-2028 |
| 成長モメンタム | 加速 |
| 前年比2024年 | 4.11% |
| CAGR | 4.36% |
| 増分額 | 43億8,150万米ドル |
本調査では、今後数年間の酒精強化ワイン市場の成長を牽引する主な要因の1つとして、オンライン・ワイン・オークションおよび販売プラットフォームの人気の高まりを挙げています。また、プライベートブランドやミレニアル世代の人口が世界的に増加していることも、市場の大きな需要につながると思われます。
目次
第1章 エグゼクティブサマリー
- 市場概要
第2章 市場情勢
- 市場エコシステム
- 市場の特徴
- バリューチェーン分析
第3章 市場規模の評価
- 市場の定義
- 市場セグメント分析
- 市場規模 2023
- 市場の見通し 2023-2028
第4章 市場規模実績
- 世界酒精強化ワイン市場 2018-2022
- 製品タイプ別セグメント分析 2018-2022
- 流通チャネル別セグメント分析 2018-2022
- 地域別セグメント分析 2018-2022
- 国別セグメント分析 2018-2022
第5章 ファイブフォース分析
- ファイブフォースの要約
- 買い手の交渉力
- 供給企業の交渉力
- 新規参入業者の脅威
- 代替品の脅威
- 競争の脅威
- 市況
第6章 市場セグメンテーション:製品タイプ別
- 市場セグメンテーション
- 比較:製品タイプ別
- シェリー:市場規模と予測 2023-2028
- ポート:市場規模と予測 2023-2028
- ベルモット:市場規模と予測 2023-2028
- その他:市場規模と予測 2023-2028
- 市場機会:製品タイプ別
第7章 市場セグメンテーション:流通チャネル別
- 市場セグメンテーション
- 比較:流通チャネル別
- オフトレード:市場規模と予測 2023-2028
- オントレード:市場規模と予測 2023-2028
- 市場機会:流通チャネル別
第8章 顧客情勢
- 顧客情勢の概要
第9章 地域別情勢
- 地域別セグメンテーション
- 地域別比較
- 欧州:市場規模と予測 2023-2028
- 北米:市場規模と予測 2023-2028
- アジア太平洋:市場規模と予測 2023-2028
- 南米:市場規模と予測 2023-2028
- 中東・アフリカ:市場規模と予測 2023-2028
- 米国:市場規模と予測 2023-2028
- フランス:市場規模と予測 2023-2028
- イタリア:市場規模と予測 2023-2028
- ドイツ:市場規模と予測 2023-2028
- 英国:市場規模と予測 2023-2028
- 市場機会:地域情勢別
第10章 促進要因・課題・機会・抑制要因
- 市場促進要因
- 市場の課題
- 促進要因と課題の影響
- 市場の機会・抑制要因
第11章 競合情勢
- 概要
- 競合情勢
- 混乱の状況
- 業界のリスク
第12章 競合分析
- 企業プロファイル
- 企業の市場ポジショニング
- Anchor Brewers and Distillers LLC
- Bacardi Ltd.
- Campari Group
- Contratto srl
- DOWS Port
- E. and J. Gallo Winery
- Fonseca Port Wine
- Fratelli Gancia and C. SpA
- Precept Wine
- Ramos Pinto
- Rhys and Rylee LLC
- SOGEVINUS FINE WINES SA
- Symington Family Estates Vinhos S.A.
- Taylors Port
- Vinbros and Co.
第13章 付録
Exhibits:
- Exhibits1: Executive Summary - Chart on Market Overview
- Exhibits2: Executive Summary - Data Table on Market Overview
- Exhibits3: Executive Summary - Chart on Global Market Characteristics
- Exhibits4: Executive Summary - Chart on Market By Geographical Landscape
- Exhibits5: Executive Summary - Chart on Market Segmentation by Product Type
- Exhibits6: Executive Summary - Chart on Market Segmentation by Distribution Channel
- Exhibits7: Executive Summary - Chart on Incremental Growth
- Exhibits8: Executive Summary - Data Table on Incremental Growth
- Exhibits9: Executive Summary - Chart on Company Market Positioning
- Exhibits10: Parent Market
- Exhibits11: Data Table on - Parent Market
- Exhibits12: Market characteristics analysis
- Exhibits13: Value Chain Analysis
- Exhibits14: Offerings of companies included in the market definition
- Exhibits15: Market segments
- Exhibits16: Chart on Global - Market size and forecast 2023-2028 ($ million)
- Exhibits17: Data Table on Global - Market size and forecast 2023-2028 ($ million)
- Exhibits18: Chart on Global Market: Year-over-year growth 2023-2028 (%)
- Exhibits19: Data Table on Global Market: Year-over-year growth 2023-2028 (%)
- Exhibits20: Historic Market Size - Data Table on Global Fortified Wine Market 2018 - 2022 ($ million)
- Exhibits21: Historic Market Size - Product Type Segment 2018 - 2022 ($ million)
- Exhibits22: Historic Market Size - Distribution Channel Segment 2018 - 2022 ($ million)
- Exhibits23: Historic Market Size - Geography Segment 2018 - 2022 ($ million)
- Exhibits24: Historic Market Size - Country Segment 2018 - 2022 ($ million)
- Exhibits25: Five forces analysis - Comparison between 2023 and 2028
- Exhibits26: Bargaining power of buyers - Impact of key factors 2023 and 2028
- Exhibits27: Bargaining power of suppliers - Impact of key factors in 2023 and 2028
- Exhibits28: Threat of new entrants - Impact of key factors in 2023 and 2028
- Exhibits29: Threat of substitutes - Impact of key factors in 2023 and 2028
- Exhibits30: Threat of rivalry - Impact of key factors in 2023 and 2028
- Exhibits31: Chart on Market condition - Five forces 2023 and 2028
- Exhibits32: Chart on Product Type - Market share 2023-2028 (%)
- Exhibits33: Data Table on Product Type - Market share 2023-2028 (%)
- Exhibits34: Chart on Comparison by Product Type
- Exhibits35: Data Table on Comparison by Product Type
- Exhibits36: Chart on Sherry - Market size and forecast 2023-2028 ($ million)
- Exhibits37: Data Table on Sherry - Market size and forecast 2023-2028 ($ million)
- Exhibits38: Chart on Sherry - Year-over-year growth 2023-2028 (%)
- Exhibits39: Data Table on Sherry - Year-over-year growth 2023-2028 (%)
- Exhibits40: Chart on Port - Market size and forecast 2023-2028 ($ million)
- Exhibits41: Data Table on Port - Market size and forecast 2023-2028 ($ million)
- Exhibits42: Chart on Port - Year-over-year growth 2023-2028 (%)
- Exhibits43: Data Table on Port - Year-over-year growth 2023-2028 (%)
- Exhibits44: Chart on Vermouth - Market size and forecast 2023-2028 ($ million)
- Exhibits45: Data Table on Vermouth - Market size and forecast 2023-2028 ($ million)
- Exhibits46: Chart on Vermouth - Year-over-year growth 2023-2028 (%)
- Exhibits47: Data Table on Vermouth - Year-over-year growth 2023-2028 (%)
- Exhibits48: Chart on Others - Market size and forecast 2023-2028 ($ million)
- Exhibits49: Data Table on Others - Market size and forecast 2023-2028 ($ million)
- Exhibits50: Chart on Others - Year-over-year growth 2023-2028 (%)
- Exhibits51: Data Table on Others - Year-over-year growth 2023-2028 (%)
- Exhibits52: Market opportunity by Product Type ($ million)
- Exhibits53: Data Table on Market opportunity by Product Type ($ million)
- Exhibits54: Chart on Distribution Channel - Market share 2023-2028 (%)
- Exhibits55: Data Table on Distribution Channel - Market share 2023-2028 (%)
- Exhibits56: Chart on Comparison by Distribution Channel
- Exhibits57: Data Table on Comparison by Distribution Channel
- Exhibits58: Chart on Off-trade - Market size and forecast 2023-2028 ($ million)
- Exhibits59: Data Table on Off-trade - Market size and forecast 2023-2028 ($ million)
- Exhibits60: Chart on Off-trade - Year-over-year growth 2023-2028 (%)
- Exhibits61: Data Table on Off-trade - Year-over-year growth 2023-2028 (%)
- Exhibits62: Chart on On-trade - Market size and forecast 2023-2028 ($ million)
- Exhibits63: Data Table on On-trade - Market size and forecast 2023-2028 ($ million)
- Exhibits64: Chart on On-trade - Year-over-year growth 2023-2028 (%)
- Exhibits65: Data Table on On-trade - Year-over-year growth 2023-2028 (%)
- Exhibits66: Market opportunity by Distribution Channel ($ million)
- Exhibits67: Data Table on Market opportunity by Distribution Channel ($ million)
- Exhibits68: Analysis of price sensitivity, lifecycle, customer purchase basket, adoption rates, and purchase criteria
- Exhibits69: Chart on Market share By Geographical Landscape 2023-2028 (%)
- Exhibits70: Data Table on Market share By Geographical Landscape 2023-2028 (%)
- Exhibits71: Chart on Geographic comparison
- Exhibits72: Data Table on Geographic comparison
- Exhibits73: Chart on Europe - Market size and forecast 2023-2028 ($ million)
- Exhibits74: Data Table on Europe - Market size and forecast 2023-2028 ($ million)
- Exhibits75: Chart on Europe - Year-over-year growth 2023-2028 (%)
- Exhibits76: Data Table on Europe - Year-over-year growth 2023-2028 (%)
- Exhibits77: Chart on North America - Market size and forecast 2023-2028 ($ million)
- Exhibits78: Data Table on North America - Market size and forecast 2023-2028 ($ million)
- Exhibits79: Chart on North America - Year-over-year growth 2023-2028 (%)
- Exhibits80: Data Table on North America - Year-over-year growth 2023-2028 (%)
- Exhibits81: Chart on APAC - Market size and forecast 2023-2028 ($ million)
- Exhibits82: Data Table on APAC - Market size and forecast 2023-2028 ($ million)
- Exhibits83: Chart on APAC - Year-over-year growth 2023-2028 (%)
- Exhibits84: Data Table on APAC - Year-over-year growth 2023-2028 (%)
- Exhibits85: Chart on South America - Market size and forecast 2023-2028 ($ million)
- Exhibits86: Data Table on South America - Market size and forecast 2023-2028 ($ million)
- Exhibits87: Chart on South America - Year-over-year growth 2023-2028 (%)
- Exhibits88: Data Table on South America - Year-over-year growth 2023-2028 (%)
- Exhibits89: Chart on Middle East and Africa - Market size and forecast 2023-2028 ($ million)
- Exhibits90: Data Table on Middle East and Africa - Market size and forecast 2023-2028 ($ million)
- Exhibits91: Chart on Middle East and Africa - Year-over-year growth 2023-2028 (%)
- Exhibits92: Data Table on Middle East and Africa - Year-over-year growth 2023-2028 (%)
- Exhibits93: Chart on US - Market size and forecast 2023-2028 ($ million)
- Exhibits94: Data Table on US - Market size and forecast 2023-2028 ($ million)
- Exhibits95: Chart on US - Year-over-year growth 2023-2028 (%)
- Exhibits96: Data Table on US - Year-over-year growth 2023-2028 (%)
- Exhibits97: Chart on France - Market size and forecast 2023-2028 ($ million)
- Exhibits98: Data Table on France - Market size and forecast 2023-2028 ($ million)
- Exhibits99: Chart on France - Year-over-year growth 2023-2028 (%)
- Exhibits100: Data Table on France - Year-over-year growth 2023-2028 (%)
- Exhibits101: Chart on Italy - Market size and forecast 2023-2028 ($ million)
- Exhibits102: Data Table on Italy - Market size and forecast 2023-2028 ($ million)
- Exhibits103: Chart on Italy - Year-over-year growth 2023-2028 (%)
- Exhibits104: Data Table on Italy - Year-over-year growth 2023-2028 (%)
- Exhibits105: Chart on Germany - Market size and forecast 2023-2028 ($ million)
- Exhibits106: Data Table on Germany - Market size and forecast 2023-2028 ($ million)
- Exhibits107: Chart on Germany - Year-over-year growth 2023-2028 (%)
- Exhibits108: Data Table on Germany - Year-over-year growth 2023-2028 (%)
- Exhibits109: Chart on UK - Market size and forecast 2023-2028 ($ million)
- Exhibits110: Data Table on UK - Market size and forecast 2023-2028 ($ million)
- Exhibits111: Chart on UK - Year-over-year growth 2023-2028 (%)
- Exhibits112: Data Table on UK - Year-over-year growth 2023-2028 (%)
- Exhibits113: Market opportunity By Geographical Landscape ($ million)
- Exhibits114: Data Tables on Market opportunity By Geographical Landscape ($ million)
- Exhibits115: Impact of drivers and challenges in 2023 and 2028
- Exhibits116: Overview on criticality of inputs and factors of differentiation
- Exhibits117: Overview on factors of disruption
- Exhibits118: Impact of key risks on business
- Exhibits119: Companies covered
- Exhibits120: Matrix on companies position and classification
- Exhibits121: Anchor Brewers and Distillers LLC - Overview
- Exhibits122: Anchor Brewers and Distillers LLC - Product / Service
- Exhibits123: Anchor Brewers and Distillers LLC - Key offerings
- Exhibits124: Bacardi Ltd. - Overview
- Exhibits125: Bacardi Ltd. - Product / Service
- Exhibits126: Bacardi Ltd. - Key news
- Exhibits127: Bacardi Ltd. - Key offerings
- Exhibits128: Campari Group - Overview
- Exhibits129: Campari Group - Business segments
- Exhibits130: Campari Group - Key offerings
- Exhibits131: Campari Group - Segment focus
- Exhibits132: Contratto srl - Overview
- Exhibits133: Contratto srl - Product / Service
- Exhibits134: Contratto srl - Key offerings
- Exhibits135: DOWS Port - Overview
- Exhibits136: DOWS Port - Product / Service
- Exhibits137: DOWS Port - Key offerings
- Exhibits138: E. and J. Gallo Winery - Overview
- Exhibits139: E. and J. Gallo Winery - Product / Service
- Exhibits140: E. and J. Gallo Winery - Key offerings
- Exhibits141: Fonseca Port Wine - Overview
- Exhibits142: Fonseca Port Wine - Product / Service
- Exhibits143: Fonseca Port Wine - Key offerings
- Exhibits144: Fratelli Gancia and C. SpA - Overview
- Exhibits145: Fratelli Gancia and C. SpA - Product / Service
- Exhibits146: Fratelli Gancia and C. SpA - Key offerings
- Exhibits147: Precept Wine - Overview
- Exhibits148: Precept Wine - Product / Service
- Exhibits149: Precept Wine - Key offerings
- Exhibits150: Ramos Pinto - Overview
- Exhibits151: Ramos Pinto - Product / Service
- Exhibits152: Ramos Pinto - Key offerings
- Exhibits153: Rhys and Rylee LLC - Overview
- Exhibits154: Rhys and Rylee LLC - Product / Service
- Exhibits155: Rhys and Rylee LLC - Key offerings
- Exhibits156: SOGEVINUS FINE WINES SA - Overview
- Exhibits157: SOGEVINUS FINE WINES SA - Product / Service
- Exhibits158: SOGEVINUS FINE WINES SA - Key offerings
- Exhibits159: Symington Family Estates Vinhos S.A. - Overview
- Exhibits160: Symington Family Estates Vinhos S.A. - Product / Service
- Exhibits161: Symington Family Estates Vinhos S.A. - Key offerings
- Exhibits162: Taylors Port - Overview
- Exhibits163: Taylors Port - Product / Service
- Exhibits164: Taylors Port - Key offerings
- Exhibits165: Vinbros and Co. - Overview
- Exhibits166: Vinbros and Co. - Product / Service
- Exhibits167: Vinbros and Co. - Key offerings
- Exhibits168: Inclusions checklist
- Exhibits169: Exclusions checklist
- Exhibits170: Currency conversion rates for US$
- Exhibits171: Research methodology
- Exhibits172: Information sources
- Exhibits173: Data validation
- Exhibits174: Validation techniques employed for market sizing
- Exhibits175: Data synthesis
- Exhibits176: 360 degree market analysis
- Exhibits177: List of abbreviations
The fortified wine market is forecasted to grow by USD 4381.5 mn during 2023-2028, accelerating at a CAGR of 4.36% during the forecast period. The report on the fortified wine market provides a holistic analysis, market size and forecast, trends, growth drivers, and challenges, as well as vendor analysis covering around 25 vendors.
The report offers an up-to-date analysis regarding the current market scenario, the latest trends and drivers, and the overall market environment. The market is driven by rising consumption rate of wine consumption, increasing preference for premium wines, and growing demand for rare and collectible wines.
Technavio's fortified wine market is segmented as below:
| Market Scope | |
|---|---|
| Base Year | 2024 |
| End Year | 2028 |
| Series Year | 2024-2028 |
| Growth Momentum | Accelerate |
| YOY 2024 | 4.11% |
| CAGR | 4.36% |
| Incremental Value | $4381.5mn |
By Product Type
- Sherry
- Port
- Vermouth
- Others
By Distribution Channel
- Off-trade
- On-trade
By Geographical Landscape
- Europe
- North America
- APAC
- South America
- Middle East and Africa
This study identifies the growing popularity of online wine auctions and sales platforms as one of the prime reasons driving the fortified wine market growth during the next few years. Also, increasing prominence of private-label brands and rising population of millennials worldwide will lead to sizable demand in the market.
The report on the fortified wine market covers the following areas:
- Fortified wine market sizing
- Fortified wine market forecast
- Fortified wine market industry analysis
The robust vendor analysis is designed to help clients improve their market position, and in line with this, this report provides a detailed analysis of several leading fortified wine market vendors that include Anchor Brewers and Distillers LLC, Bacardi Ltd., Campari Group, Contratto srl, DOWS Port, E. and J. Gallo Winery, Emilio Lustau S.A., Fonseca Port Wine, Fratelli Gancia and C. SpA, Mazurans Vineyards Ltd., Precept Wine, Ramos Pinto, Rhys and Rylee LLC, SOGEVINUS FINE WINES SA, Sogrape SGPS SA, Symington Family Estates Vinhos S.A., Taylors Port, The Great Wine Co., Vinbros and Co., and Vinimark Trading Pty Ltd.. Also, the fortified wine market analysis report includes information on upcoming trends and challenges that will influence market growth. This is to help companies strategize and leverage all forthcoming growth opportunities.
The study was conducted using an objective combination of primary and secondary information including inputs from key participants in the industry. The report contains a comprehensive market and vendor landscape in addition to an analysis of the key vendors.
The publisher presents a detailed picture of the market by the way of study, synthesis, and summation of data from multiple sources by an analysis of key parameters such as profit, pricing, competition, and promotions. It presents various market facets by identifying the key industry influencers. The data presented is comprehensive, reliable, and a result of extensive research - both primary and secondary. The market research reports provide a complete competitive landscape and an in-depth vendor selection methodology and analysis using qualitative and quantitative research to forecast the accurate market growth.
Table of Contents
1 Executive Summary
- 1.1 Market overview
- Executive Summary - Chart on Market Overview
- Executive Summary - Data Table on Market Overview
- Executive Summary - Chart on Global Market Characteristics
- Executive Summary - Chart on Market By Geographical Landscape
- Executive Summary - Chart on Market Segmentation by Product Type
- Executive Summary - Chart on Market Segmentation by Distribution Channel
- Executive Summary - Chart on Incremental Growth
- Executive Summary - Data Table on Incremental Growth
- Executive Summary - Chart on Company Market Positioning
2 Market Landscape
- 2.1 Market ecosystem
- Parent Market
- Data Table on - Parent Market
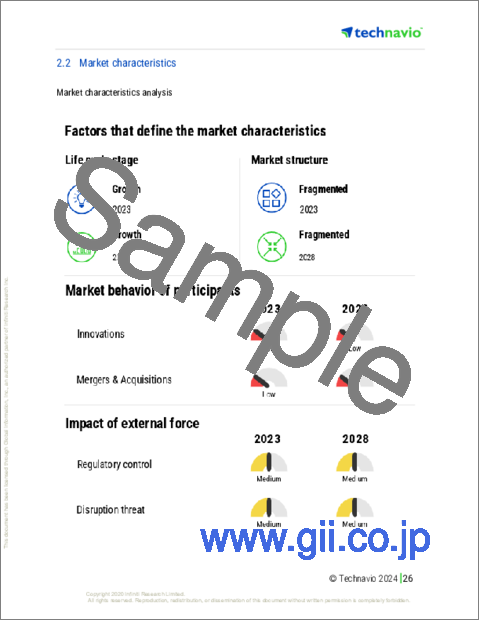
- 2.2 Market characteristics
- Market characteristics analysis
- 2.3 Value chain analysis
- Value Chain Analysis
3 Market Sizing
- 3.1 Market definition
- Offerings of companies included in the market definition
- 3.2 Market segment analysis
- Market segments
- 3.3 Market size 2023
- 3.4 Market outlook: Forecast for 2023-2028
- Chart on Global - Market size and forecast 2023-2028 ($ million)
- Data Table on Global - Market size and forecast 2023-2028 ($ million)
- Chart on Global Market: Year-over-year growth 2023-2028 (%)
- Data Table on Global Market: Year-over-year growth 2023-2028 (%)
4 Historic Market Size
- 4.1 Global Fortified Wine Market 2018 - 2022
- Historic Market Size - Data Table on Global Fortified Wine Market 2018 - 2022 ($ million)
- 4.2 Product Type segment analysis 2018 - 2022
- Historic Market Size - Product Type Segment 2018 - 2022 ($ million)
- 4.3 Distribution Channel segment analysis 2018 - 2022
- Historic Market Size - Distribution Channel Segment 2018 - 2022 ($ million)
- 4.4 Geography segment analysis 2018 - 2022
- Historic Market Size - Geography Segment 2018 - 2022 ($ million)
- 4.5 Country segment analysis 2018 - 2022
- Historic Market Size - Country Segment 2018 - 2022 ($ million)
5 Five Forces Analysis
- 5.1 Five forces summary
- Five forces analysis - Comparison between 2023 and 2028
- 5.2 Bargaining power of buyers
- Bargaining power of buyers - Impact of key factors 2023 and 2028
- 5.3 Bargaining power of suppliers
- Bargaining power of suppliers - Impact of key factors in 2023 and 2028
- 5.4 Threat of new entrants
- Threat of new entrants - Impact of key factors in 2023 and 2028
- 5.5 Threat of substitutes
- Threat of substitutes - Impact of key factors in 2023 and 2028
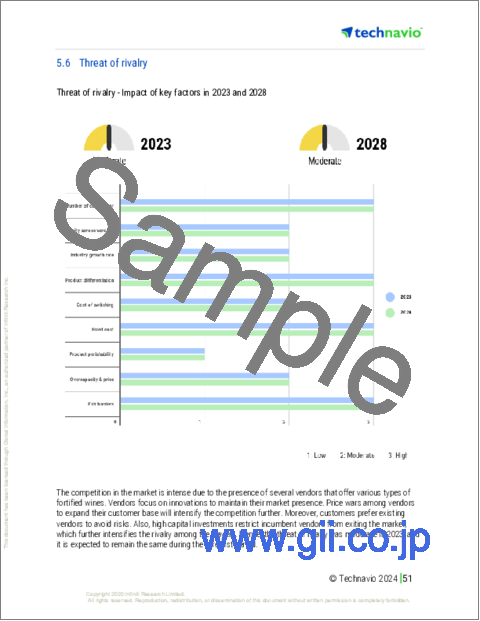
- 5.6 Threat of rivalry
- Threat of rivalry - Impact of key factors in 2023 and 2028
- 5.7 Market condition
- Chart on Market condition - Five forces 2023 and 2028
6 Market Segmentation by Product Type
- 6.1 Market segments
- Chart on Product Type - Market share 2023-2028 (%)
- Data Table on Product Type - Market share 2023-2028 (%)
- 6.2 Comparison by Product Type
- Chart on Comparison by Product Type
- Data Table on Comparison by Product Type
- 6.3 Sherry - Market size and forecast 2023-2028
- Chart on Sherry - Market size and forecast 2023-2028 ($ million)
- Data Table on Sherry - Market size and forecast 2023-2028 ($ million)
- Chart on Sherry - Year-over-year growth 2023-2028 (%)
- Data Table on Sherry - Year-over-year growth 2023-2028 (%)
- 6.4 Port - Market size and forecast 2023-2028
- Chart on Port - Market size and forecast 2023-2028 ($ million)
- Data Table on Port - Market size and forecast 2023-2028 ($ million)
- Chart on Port - Year-over-year growth 2023-2028 (%)
- Data Table on Port - Year-over-year growth 2023-2028 (%)
- 6.5 Vermouth - Market size and forecast 2023-2028
- Chart on Vermouth - Market size and forecast 2023-2028 ($ million)
- Data Table on Vermouth - Market size and forecast 2023-2028 ($ million)
- Chart on Vermouth - Year-over-year growth 2023-2028 (%)
- Data Table on Vermouth - Year-over-year growth 2023-2028 (%)
- 6.6 Others - Market size and forecast 2023-2028
- Chart on Others - Market size and forecast 2023-2028 ($ million)
- Data Table on Others - Market size and forecast 2023-2028 ($ million)
- Chart on Others - Year-over-year growth 2023-2028 (%)
- Data Table on Others - Year-over-year growth 2023-2028 (%)
- 6.7 Market opportunity by Product Type
- Market opportunity by Product Type ($ million)
- Data Table on Market opportunity by Product Type ($ million)
7 Market Segmentation by Distribution Channel
- 7.1 Market segments
- Chart on Distribution Channel - Market share 2023-2028 (%)
- Data Table on Distribution Channel - Market share 2023-2028 (%)
- 7.2 Comparison by Distribution Channel
- Chart on Comparison by Distribution Channel
- Data Table on Comparison by Distribution Channel
- 7.3 Off-trade - Market size and forecast 2023-2028
- Chart on Off-trade - Market size and forecast 2023-2028 ($ million)
- Data Table on Off-trade - Market size and forecast 2023-2028 ($ million)
- Chart on Off-trade - Year-over-year growth 2023-2028 (%)
- Data Table on Off-trade - Year-over-year growth 2023-2028 (%)
- 7.4 On-trade - Market size and forecast 2023-2028
- Chart on On-trade - Market size and forecast 2023-2028 ($ million)
- Data Table on On-trade - Market size and forecast 2023-2028 ($ million)
- Chart on On-trade - Year-over-year growth 2023-2028 (%)
- Data Table on On-trade - Year-over-year growth 2023-2028 (%)
- 7.5 Market opportunity by Distribution Channel
- Market opportunity by Distribution Channel ($ million)
- Data Table on Market opportunity by Distribution Channel ($ million)
8 Customer Landscape
- 8.1 Customer landscape overview
- Analysis of price sensitivity, lifecycle, customer purchase basket, adoption rates, and purchase criteria
9 Geographic Landscape
- 9.1 Geographic segmentation
- Chart on Market share By Geographical Landscape 2023-2028 (%)
- Data Table on Market share By Geographical Landscape 2023-2028 (%)
- 9.2 Geographic comparison
- Chart on Geographic comparison
- Data Table on Geographic comparison
- 9.3 Europe - Market size and forecast 2023-2028
- Chart on Europe - Market size and forecast 2023-2028 ($ million)
- Data Table on Europe - Market size and forecast 2023-2028 ($ million)
- Chart on Europe - Year-over-year growth 2023-2028 (%)
- Data Table on Europe - Year-over-year growth 2023-2028 (%)
- 9.4 North America - Market size and forecast 2023-2028
- Chart on North America - Market size and forecast 2023-2028 ($ million)
- Data Table on North America - Market size and forecast 2023-2028 ($ million)
- Chart on North America - Year-over-year growth 2023-2028 (%)
- Data Table on North America - Year-over-year growth 2023-2028 (%)
- 9.5 APAC - Market size and forecast 2023-2028
- Chart on APAC - Market size and forecast 2023-2028 ($ million)
- Data Table on APAC - Market size and forecast 2023-2028 ($ million)
- Chart on APAC - Year-over-year growth 2023-2028 (%)
- Data Table on APAC - Year-over-year growth 2023-2028 (%)
- 9.6 South America - Market size and forecast 2023-2028
- Chart on South America - Market size and forecast 2023-2028 ($ million)
- Data Table on South America - Market size and forecast 2023-2028 ($ million)
- Chart on South America - Year-over-year growth 2023-2028 (%)
- Data Table on South America - Year-over-year growth 2023-2028 (%)
- 9.7 Middle East and Africa - Market size and forecast 2023-2028
- Chart on Middle East and Africa - Market size and forecast 2023-2028 ($ million)
- Data Table on Middle East and Africa - Market size and forecast 2023-2028 ($ million)
- Chart on Middle East and Africa - Year-over-year growth 2023-2028 (%)
- Data Table on Middle East and Africa - Year-over-year growth 2023-2028 (%)
- 9.8 US - Market size and forecast 2023-2028
- Chart on US - Market size and forecast 2023-2028 ($ million)
- Data Table on US - Market size and forecast 2023-2028 ($ million)
- Chart on US - Year-over-year growth 2023-2028 (%)
- Data Table on US - Year-over-year growth 2023-2028 (%)
- 9.9 France - Market size and forecast 2023-2028
- Chart on France - Market size and forecast 2023-2028 ($ million)
- Data Table on France - Market size and forecast 2023-2028 ($ million)
- Chart on France - Year-over-year growth 2023-2028 (%)
- Data Table on France - Year-over-year growth 2023-2028 (%)
- 9.10 Italy - Market size and forecast 2023-2028
- Chart on Italy - Market size and forecast 2023-2028 ($ million)
- Data Table on Italy - Market size and forecast 2023-2028 ($ million)
- Chart on Italy - Year-over-year growth 2023-2028 (%)
- Data Table on Italy - Year-over-year growth 2023-2028 (%)
- 9.11 Germany - Market size and forecast 2023-2028
- Chart on Germany - Market size and forecast 2023-2028 ($ million)
- Data Table on Germany - Market size and forecast 2023-2028 ($ million)
- Chart on Germany - Year-over-year growth 2023-2028 (%)
- Data Table on Germany - Year-over-year growth 2023-2028 (%)
- 9.12 UK - Market size and forecast 2023-2028
- Chart on UK - Market size and forecast 2023-2028 ($ million)
- Data Table on UK - Market size and forecast 2023-2028 ($ million)
- Chart on UK - Year-over-year growth 2023-2028 (%)
- Data Table on UK - Year-over-year growth 2023-2028 (%)
- 9.13 Market opportunity By Geographical Landscape
- Market opportunity By Geographical Landscape ($ million)
- Data Tables on Market opportunity By Geographical Landscape ($ million)
10 Drivers, Challenges, and Opportunity/Restraints
- 10.1 Market drivers
- 10.2 Market challenges
- 10.3 Impact of drivers and challenges
- Impact of drivers and challenges in 2023 and 2028
- 10.4 Market opportunities/restraints
11 Competitive Landscape
- 11.1 Overview
- 11.2 Competitive Landscape
- Overview on criticality of inputs and factors of differentiation
- 11.3 Landscape disruption
- Overview on factors of disruption
- 11.4 Industry risks
- Impact of key risks on business
12 Competitive Analysis
- 12.1 Companies profiled
- Companies covered
- 12.2 Market positioning of companies
- Matrix on companies position and classification
- 12.3 Anchor Brewers and Distillers LLC
- Anchor Brewers and Distillers LLC - Overview
- Anchor Brewers and Distillers LLC - Product / Service
- Anchor Brewers and Distillers LLC - Key offerings
- 12.4 Bacardi Ltd.
- Bacardi Ltd. - Overview
- Bacardi Ltd. - Product / Service
- Bacardi Ltd. - Key news
- Bacardi Ltd. - Key offerings
- 12.5 Campari Group
- Campari Group - Overview
- Campari Group - Business segments
- Campari Group - Key offerings
- Campari Group - Segment focus
- 12.6 Contratto srl
- Contratto srl - Overview
- Contratto srl - Product / Service
- Contratto srl - Key offerings
- 12.7 DOWS Port
- DOWS Port - Overview
- DOWS Port - Product / Service
- DOWS Port - Key offerings
- 12.8 E. and J. Gallo Winery
- E. and J. Gallo Winery - Overview
- E. and J. Gallo Winery - Product / Service
- E. and J. Gallo Winery - Key offerings
- 12.9 Fonseca Port Wine
- Fonseca Port Wine - Overview
- Fonseca Port Wine - Product / Service
- Fonseca Port Wine - Key offerings
- 12.10 Fratelli Gancia and C. SpA
- Fratelli Gancia and C. SpA - Overview
- Fratelli Gancia and C. SpA - Product / Service
- Fratelli Gancia and C. SpA - Key offerings
- 12.11 Precept Wine
- Precept Wine - Overview
- Precept Wine - Product / Service
- Precept Wine - Key offerings
- 12.12 Ramos Pinto
- Ramos Pinto - Overview
- Ramos Pinto - Product / Service
- Ramos Pinto - Key offerings
- 12.13 Rhys and Rylee LLC
- Rhys and Rylee LLC - Overview
- Rhys and Rylee LLC - Product / Service
- Rhys and Rylee LLC - Key offerings
- 12.14 SOGEVINUS FINE WINES SA
- SOGEVINUS FINE WINES SA - Overview
- SOGEVINUS FINE WINES SA - Product / Service
- SOGEVINUS FINE WINES SA - Key offerings
- 12.15 Symington Family Estates Vinhos S.A.
- Symington Family Estates Vinhos S.A. - Overview
- Symington Family Estates Vinhos S.A. - Product / Service
- Symington Family Estates Vinhos S.A. - Key offerings
- 12.16 Taylors Port
- Taylors Port - Overview
- Taylors Port - Product / Service
- Taylors Port - Key offerings
- 12.17 Vinbros and Co.
- Vinbros and Co. - Overview
- Vinbros and Co. - Product / Service
- Vinbros and Co. - Key offerings
13 Appendix
- 13.1 Scope of the report
- 13.2 Inclusions and exclusions checklist
- Inclusions checklist
- Exclusions checklist
- 13.3 Currency conversion rates for US$
- Currency conversion rates for US$
- 13.4 Research methodology
- Research methodology
- 13.5 Data procurement
- Information sources
- 13.6 Data validation
- Data validation
- 13.7 Validation techniques employed for market sizing
- Validation techniques employed for market sizing
- 13.8 Data synthesis
- Data synthesis
- 13.9 360 degree market analysis
- 360 degree market analysis
- 13.10 List of abbreviations
- List of abbreviations

