|
|
市場調査レポート
商品コード
1705192
土壌処理の世界市場 2025~2029年Global Soil Treatment Market 2025-2029 |
||||||

|
|||||||
カスタマイズ可能
|
|||||||


| 土壌処理の世界市場 2025~2029年 |
|
出版日: 2025年04月05日
発行: TechNavio
ページ情報: 英文 252 Pages
納期: 即納可能
|

全表示
- 概要
- 図表
- 目次
土壌処理市場は2024-2029年に196億4,590万米ドル、予測期間中のCAGRは7.2%で成長すると予測されます。
当レポートでは、土壌処理市場の全体的な分析、市場規模・予測、動向、成長促進要因、課題、約25のベンダーを網羅したベンダー分析などを掲載しています。
現在の市場シナリオ、最新動向と促進要因、市場環境全体に関する最新分析を提供しています。市場は、農作物需要の増加、土壌劣化や環境への懸念の高まり、農業慣行を支援する政府の取り組みに対応する必要性によって牽引されています。
| 市場範囲 | |
|---|---|
| 基準年 | 2025 |
| 終了年 | 2029 |
| 予測期間 | 2025-2029 |
| 成長モメンタム | 加速 |
| 前年比2025年 | 6.6% |
| CAGR | 7.2% |
| 増分額 | 196億4,590万米ドル |
本調査は、業界の主要参加者からのインプットを含め、一次情報と二次情報を客観的に組み合わせて実施しました。レポートには、主要企業の分析に加え、包括的な市場規模データ、地域別分析によるセグメント、ベンダー情勢が含まれています。レポートには履歴データと予測データがあります。
本調査では、今後数年間の土壌処理市場の成長を促進する主な理由の一つとして、土壌処理における精密農業の採用が拡大していることを挙げています。また、土壌処理業界における最近の動向や、有機栽培や持続可能な土壌処理の採用拡大も、市場の大きな需要につながるでしょう。
目次
第1章 エグゼクティブサマリー
- 市場概要
第2章 Technavio分析
- 価格・ライフサイクル・顧客購入バスケット・採用率・購入基準の分析
- インプットの重要性と差別化の要因
- 混乱の要因
- 促進要因と課題の影響
第3章 市場情勢
- 市場エコシステム
- 市場の特徴
- バリューチェーン分析
第4章 市場規模
- 市場の定義
- 市場セグメント分析
- 市場規模 2024
- 市場の見通し 2024-2029
第5章 市場規模実績
- 土壌処理の世界市場 2019-2023
- タイプ別セグメント分析 2019-2023
- 技術別セグメント分析 2019-2023
- 作物タイプ別セグメント分析 2019-2023
- 用途別セグメント分析 2019-2023
- 地域別セグメント分析 2019-2023
- 国別セグメント分析 2019-2023
第6章 定性分析
- AIの影響:土壌処理の世界市場
第7章 ファイブフォース分析
- ファイブフォースの要約
- 買い手の交渉力
- 供給企業の交渉力
- 新規参入業者の脅威
- 代替品の脅威
- 競争の脅威
- 市況
第8章 市場セグメンテーション:タイプ別
- 市場セグメント
- 比較:タイプ別
- 有機肥料:市場規模と予測 2024-2029
- pH調整剤:市場規模と予測 2024-2029
- 土壌保護:市場規模と予測 2024-2029
- 市場機会:タイプ別
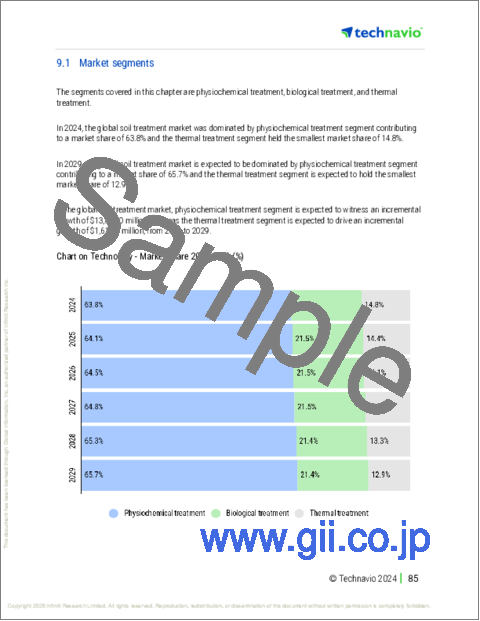
第9章 市場セグメンテーション:技術別
- 市場セグメント
- 比較:技術別
- 理化学的処理:市場規模と予測 2024-2029
- 生物学的処理:市場規模と予測 2024-2029
- 熱処理:市場規模と予測 2024-2029
- 市場機会:技術別
第10章 市場セグメンテーション:作物タイプ別
- 市場セグメント
- 比較:作物タイプ別
- 商業作物:市場規模と予測 2024-2029
- 果物と野菜:市場規模と予測 2024-2029
- 穀物:市場規模と予測 2024-2029
- 豆類と油糧種子:市場規模と予測 2024-2029
- 芝生と観賞用植物:市場規模と予測 2024-2029
- 市場機会:作物タイプ別
第11章 市場セグメンテーション:用途別
- 市場セグメント
- 比較:用途別
- 土壌の肥沃性:市場規模と予測 2024-2029
- 土壌保護:市場規模と予測 2024-2029
- 雑草対策:市場規模と予測 2024-2029
- 害虫駆除:市場規模と予測 2024-2029
- その他:市場規模と予測 2024-2029
- 市場機会:用途別
第12章 顧客情勢
- 顧客情勢の概要
第13章 地域別情勢
- 地域別セグメンテーション
- 地域別比較
- 北米:市場規模と予測 2024-2029
- 欧州:市場規模と予測 2024-2029
- アジア太平洋:市場規模と予測 2024-2029
- 南米:市場規模と予測 2024-2029
- 中東・アフリカ:市場規模と予測 2024-2029
- 米国:市場規模と予測 2024-2029
- 中国:市場規模と予測 2024-2029
- スペイン:市場規模と予測 2024-2029
- ドイツ:市場規模と予測 2024-2029
- 日本:市場規模と予測 2024-2029
- 英国:市場規模と予測 2024-2029
- カナダ:市場規模と予測 2024-2029
- ブラジル:市場規模と予測 2024-2029
- インド:市場規模と予測 2024-2029
- アルゼンチン:市場規模と予測 2024-2029
- 市場機会:地域情勢別
第14章 促進要因・課題・機会・抑制要因
- 市場促進要因
- 市場の課題
- 促進要因と課題の影響
- 市場の機会・抑制要因
第15章 競合情勢
- 概要
- 競合情勢
- 混乱の状況
- 業界のリスク
第16章 競合分析
- 企業プロファイル
- 企業ランキング指数
- 企業の市場ポジショニング
- AGRO-KANESHO CO. LTD.
- American Vanguard Corp.
- Arkema SA
- BASF SE
- Bayer AG
- China National Chemical Corp.
- Compagnie de Saint Gobain
- Corteva Inc.
- Gowan Co.
- RAG Stiftung
- SA LIME AND GYPSUM PTY LTD.
- Soil Works LLC
- Solvay SA
- Swaroop Agrochemical Industries
- UPL Ltd.
第17章 付録
Exhibits:
- Exhibits1: Executive Summary - Chart on Market Overview
- Exhibits2: Executive Summary - Data Table on Market Overview
- Exhibits3: Executive Summary - Chart on Global Market Characteristics
- Exhibits4: Executive Summary - Chart on Market By Geographical Landscape
- Exhibits5: Executive Summary - Chart on Market Segmentation by Type
- Exhibits6: Executive Summary - Chart on Market Segmentation by Technology
- Exhibits7: Executive Summary - Chart on Market Segmentation by Crop Type
- Exhibits8: Executive Summary - Chart on Market Segmentation by Application
- Exhibits9: Executive Summary - Chart on Incremental Growth
- Exhibits10: Executive Summary - Data Table on Incremental Growth
- Exhibits11: Executive Summary - Chart on Company Market Positioning
- Exhibits12: Analysis of price sensitivity, lifecycle, customer purchase basket, adoption rates, and purchase criteria
- Exhibits13: Overview on criticality of inputs and factors of differentiation
- Exhibits14: Overview on factors of disruption
- Exhibits15: Impact of drivers and challenges in 2024 and 2029
- Exhibits16: Parent Market
- Exhibits17: Data Table on - Parent Market
- Exhibits18: Market characteristics analysis
- Exhibits19: Value chain analysis
- Exhibits20: Offerings of companies included in the market definition
- Exhibits21: Market segments
- Exhibits22: Chart on Global - Market size and forecast 2024-2029 ($ million)
- Exhibits23: Data Table on Global - Market size and forecast 2024-2029 ($ million)
- Exhibits24: Chart on Global Market: Year-over-year growth 2024-2029 (%)
- Exhibits25: Data Table on Global Market: Year-over-year growth 2024-2029 (%)
- Exhibits26: Historic Market Size - Data Table on Global Soil Treatment Market 2019 - 2023 ($ million)
- Exhibits27: Historic Market Size - Type Segment 2019 - 2023 ($ million)
- Exhibits28: Historic Market Size - Technology Segment 2019 - 2023 ($ million)
- Exhibits29: Historic Market Size - Crop Type Segment 2019 - 2023 ($ million)
- Exhibits30: Historic Market Size - Application Segment 2019 - 2023 ($ million)
- Exhibits31: Historic Market Size - Geography Segment 2019 - 2023 ($ million)
- Exhibits32: Historic Market Size - Country Segment 2019 - 2023 ($ million)
- Exhibits33: Five forces analysis - Comparison between 2024 and 2029
- Exhibits34: Bargaining power of buyers - Impact of key factors 2024 and 2029
- Exhibits35: Bargaining power of suppliers - Impact of key factors in 2024 and 2029
- Exhibits36: Threat of new entrants - Impact of key factors in 2024 and 2029
- Exhibits37: Threat of substitutes - Impact of key factors in 2024 and 2029
- Exhibits38: Threat of rivalry - Impact of key factors in 2024 and 2029
- Exhibits39: Chart on Market condition - Five forces 2024 and 2029
- Exhibits40: Chart on Type - Market share 2024-2029 (%)
- Exhibits41: Data Table on Type - Market share 2024-2029 (%)
- Exhibits42: Chart on Comparison by Type
- Exhibits43: Data Table on Comparison by Type
- Exhibits44: Chart on Organic amendments - Market size and forecast 2024-2029 ($ million)
- Exhibits45: Data Table on Organic amendments - Market size and forecast 2024-2029 ($ million)
- Exhibits46: Chart on Organic amendments - Year-over-year growth 2024-2029 (%)
- Exhibits47: Data Table on Organic amendments - Year-over-year growth 2024-2029 (%)
- Exhibits48: Chart on pH adjusters - Market size and forecast 2024-2029 ($ million)
- Exhibits49: Data Table on pH adjusters - Market size and forecast 2024-2029 ($ million)
- Exhibits50: Chart on pH adjusters - Year-over-year growth 2024-2029 (%)
- Exhibits51: Data Table on pH adjusters - Year-over-year growth 2024-2029 (%)
- Exhibits52: Chart on Soil protection - Market size and forecast 2024-2029 ($ million)
- Exhibits53: Data Table on Soil protection - Market size and forecast 2024-2029 ($ million)
- Exhibits54: Chart on Soil protection - Year-over-year growth 2024-2029 (%)
- Exhibits55: Data Table on Soil protection - Year-over-year growth 2024-2029 (%)
- Exhibits56: Market opportunity by Type ($ million)
- Exhibits57: Data Table on Market opportunity by Type ($ million)
- Exhibits58: Chart on Technology - Market share 2024-2029 (%)
- Exhibits59: Data Table on Technology - Market share 2024-2029 (%)
- Exhibits60: Chart on Comparison by Technology
- Exhibits61: Data Table on Comparison by Technology
- Exhibits62: Chart on Physiochemical treatment - Market size and forecast 2024-2029 ($ million)
- Exhibits63: Data Table on Physiochemical treatment - Market size and forecast 2024-2029 ($ million)
- Exhibits64: Chart on Physiochemical treatment - Year-over-year growth 2024-2029 (%)
- Exhibits65: Data Table on Physiochemical treatment - Year-over-year growth 2024-2029 (%)
- Exhibits66: Chart on Biological treatment - Market size and forecast 2024-2029 ($ million)
- Exhibits67: Data Table on Biological treatment - Market size and forecast 2024-2029 ($ million)
- Exhibits68: Chart on Biological treatment - Year-over-year growth 2024-2029 (%)
- Exhibits69: Data Table on Biological treatment - Year-over-year growth 2024-2029 (%)
- Exhibits70: Chart on Thermal treatment - Market size and forecast 2024-2029 ($ million)
- Exhibits71: Data Table on Thermal treatment - Market size and forecast 2024-2029 ($ million)
- Exhibits72: Chart on Thermal treatment - Year-over-year growth 2024-2029 (%)
- Exhibits73: Data Table on Thermal treatment - Year-over-year growth 2024-2029 (%)
- Exhibits74: Market opportunity by Technology ($ million)
- Exhibits75: Data Table on Market opportunity by Technology ($ million)
- Exhibits76: Chart on Crop Type - Market share 2024-2029 (%)
- Exhibits77: Data Table on Crop Type - Market share 2024-2029 (%)
- Exhibits78: Chart on Comparison by Crop Type
- Exhibits79: Data Table on Comparison by Crop Type
- Exhibits80: Chart on Commercial Crops - Market size and forecast 2024-2029 ($ million)
- Exhibits81: Data Table on Commercial Crops - Market size and forecast 2024-2029 ($ million)
- Exhibits82: Chart on Commercial Crops - Year-over-year growth 2024-2029 (%)
- Exhibits83: Data Table on Commercial Crops - Year-over-year growth 2024-2029 (%)
- Exhibits84: Chart on Fruits and Vegetables - Market size and forecast 2024-2029 ($ million)
- Exhibits85: Data Table on Fruits and Vegetables - Market size and forecast 2024-2029 ($ million)
- Exhibits86: Chart on Fruits and Vegetables - Year-over-year growth 2024-2029 (%)
- Exhibits87: Data Table on Fruits and Vegetables - Year-over-year growth 2024-2029 (%)
- Exhibits88: Chart on Grains and Cereals - Market size and forecast 2024-2029 ($ million)
- Exhibits89: Data Table on Grains and Cereals - Market size and forecast 2024-2029 ($ million)
- Exhibits90: Chart on Grains and Cereals - Year-over-year growth 2024-2029 (%)
- Exhibits91: Data Table on Grains and Cereals - Year-over-year growth 2024-2029 (%)
- Exhibits92: Chart on Pulses and Oilseeds - Market size and forecast 2024-2029 ($ million)
- Exhibits93: Data Table on Pulses and Oilseeds - Market size and forecast 2024-2029 ($ million)
- Exhibits94: Chart on Pulses and Oilseeds - Year-over-year growth 2024-2029 (%)
- Exhibits95: Data Table on Pulses and Oilseeds - Year-over-year growth 2024-2029 (%)
- Exhibits96: Chart on Turf and Ornamental - Market size and forecast 2024-2029 ($ million)
- Exhibits97: Data Table on Turf and Ornamental - Market size and forecast 2024-2029 ($ million)
- Exhibits98: Chart on Turf and Ornamental - Year-over-year growth 2024-2029 (%)
- Exhibits99: Data Table on Turf and Ornamental - Year-over-year growth 2024-2029 (%)
- Exhibits100: Market opportunity by Crop Type ($ million)
- Exhibits101: Data Table on Market opportunity by Crop Type ($ million)
- Exhibits102: Chart on Application - Market share 2024-2029 (%)
- Exhibits103: Data Table on Application - Market share 2024-2029 (%)
- Exhibits104: Chart on Comparison by Application
- Exhibits105: Data Table on Comparison by Application
- Exhibits106: Chart on Soil fertility - Market size and forecast 2024-2029 ($ million)
- Exhibits107: Data Table on Soil fertility - Market size and forecast 2024-2029 ($ million)
- Exhibits108: Chart on Soil fertility - Year-over-year growth 2024-2029 (%)
- Exhibits109: Data Table on Soil fertility - Year-over-year growth 2024-2029 (%)
- Exhibits110: Chart on Soil protection - Market size and forecast 2024-2029 ($ million)
- Exhibits111: Data Table on Soil protection - Market size and forecast 2024-2029 ($ million)
- Exhibits112: Chart on Soil protection - Year-over-year growth 2024-2029 (%)
- Exhibits113: Data Table on Soil protection - Year-over-year growth 2024-2029 (%)
- Exhibits114: Chart on Weed control - Market size and forecast 2024-2029 ($ million)
- Exhibits115: Data Table on Weed control - Market size and forecast 2024-2029 ($ million)
- Exhibits116: Chart on Weed control - Year-over-year growth 2024-2029 (%)
- Exhibits117: Data Table on Weed control - Year-over-year growth 2024-2029 (%)
- Exhibits118: Chart on Pest control - Market size and forecast 2024-2029 ($ million)
- Exhibits119: Data Table on Pest control - Market size and forecast 2024-2029 ($ million)
- Exhibits120: Chart on Pest control - Year-over-year growth 2024-2029 (%)
- Exhibits121: Data Table on Pest control - Year-over-year growth 2024-2029 (%)
- Exhibits122: Chart on Others - Market size and forecast 2024-2029 ($ million)
- Exhibits123: Data Table on Others - Market size and forecast 2024-2029 ($ million)
- Exhibits124: Chart on Others - Year-over-year growth 2024-2029 (%)
- Exhibits125: Data Table on Others - Year-over-year growth 2024-2029 (%)
- Exhibits126: Market opportunity by Application ($ million)
- Exhibits127: Data Table on Market opportunity by Application ($ million)
- Exhibits128: Analysis of price sensitivity, lifecycle, customer purchase basket, adoption rates, and purchase criteria
- Exhibits129: Chart on Market share By Geographical Landscape 2024-2029 (%)
- Exhibits130: Data Table on Market share By Geographical Landscape 2024-2029 (%)
- Exhibits131: Chart on Geographic comparison
- Exhibits132: Data Table on Geographic comparison
- Exhibits133: Chart on North America - Market size and forecast 2024-2029 ($ million)
- Exhibits134: Data Table on North America - Market size and forecast 2024-2029 ($ million)
- Exhibits135: Chart on North America - Year-over-year growth 2024-2029 (%)
- Exhibits136: Data Table on North America - Year-over-year growth 2024-2029 (%)
- Exhibits137: Chart on Europe - Market size and forecast 2024-2029 ($ million)
- Exhibits138: Data Table on Europe - Market size and forecast 2024-2029 ($ million)
- Exhibits139: Chart on Europe - Year-over-year growth 2024-2029 (%)
- Exhibits140: Data Table on Europe - Year-over-year growth 2024-2029 (%)
- Exhibits141: Chart on APAC - Market size and forecast 2024-2029 ($ million)
- Exhibits142: Data Table on APAC - Market size and forecast 2024-2029 ($ million)
- Exhibits143: Chart on APAC - Year-over-year growth 2024-2029 (%)
- Exhibits144: Data Table on APAC - Year-over-year growth 2024-2029 (%)
- Exhibits145: Chart on South America - Market size and forecast 2024-2029 ($ million)
- Exhibits146: Data Table on South America - Market size and forecast 2024-2029 ($ million)
- Exhibits147: Chart on South America - Year-over-year growth 2024-2029 (%)
- Exhibits148: Data Table on South America - Year-over-year growth 2024-2029 (%)
- Exhibits149: Chart on Middle East and Africa - Market size and forecast 2024-2029 ($ million)
- Exhibits150: Data Table on Middle East and Africa - Market size and forecast 2024-2029 ($ million)
- Exhibits151: Chart on Middle East and Africa - Year-over-year growth 2024-2029 (%)
- Exhibits152: Data Table on Middle East and Africa - Year-over-year growth 2024-2029 (%)
- Exhibits153: Chart on US - Market size and forecast 2024-2029 ($ million)
- Exhibits154: Data Table on US - Market size and forecast 2024-2029 ($ million)
- Exhibits155: Chart on US - Year-over-year growth 2024-2029 (%)
- Exhibits156: Data Table on US - Year-over-year growth 2024-2029 (%)
- Exhibits157: Chart on China - Market size and forecast 2024-2029 ($ million)
- Exhibits158: Data Table on China - Market size and forecast 2024-2029 ($ million)
- Exhibits159: Chart on China - Year-over-year growth 2024-2029 (%)
- Exhibits160: Data Table on China - Year-over-year growth 2024-2029 (%)
- Exhibits161: Chart on Spain - Market size and forecast 2024-2029 ($ million)
- Exhibits162: Data Table on Spain - Market size and forecast 2024-2029 ($ million)
- Exhibits163: Chart on Spain - Year-over-year growth 2024-2029 (%)
- Exhibits164: Data Table on Spain - Year-over-year growth 2024-2029 (%)
- Exhibits165: Chart on Germany - Market size and forecast 2024-2029 ($ million)
- Exhibits166: Data Table on Germany - Market size and forecast 2024-2029 ($ million)
- Exhibits167: Chart on Germany - Year-over-year growth 2024-2029 (%)
- Exhibits168: Data Table on Germany - Year-over-year growth 2024-2029 (%)
- Exhibits169: Chart on Japan - Market size and forecast 2024-2029 ($ million)
- Exhibits170: Data Table on Japan - Market size and forecast 2024-2029 ($ million)
- Exhibits171: Chart on Japan - Year-over-year growth 2024-2029 (%)
- Exhibits172: Data Table on Japan - Year-over-year growth 2024-2029 (%)
- Exhibits173: Chart on UK - Market size and forecast 2024-2029 ($ million)
- Exhibits174: Data Table on UK - Market size and forecast 2024-2029 ($ million)
- Exhibits175: Chart on UK - Year-over-year growth 2024-2029 (%)
- Exhibits176: Data Table on UK - Year-over-year growth 2024-2029 (%)
- Exhibits177: Chart on Canada - Market size and forecast 2024-2029 ($ million)
- Exhibits178: Data Table on Canada - Market size and forecast 2024-2029 ($ million)
- Exhibits179: Chart on Canada - Year-over-year growth 2024-2029 (%)
- Exhibits180: Data Table on Canada - Year-over-year growth 2024-2029 (%)
- Exhibits181: Chart on Brazil - Market size and forecast 2024-2029 ($ million)
- Exhibits182: Data Table on Brazil - Market size and forecast 2024-2029 ($ million)
- Exhibits183: Chart on Brazil - Year-over-year growth 2024-2029 (%)
- Exhibits184: Data Table on Brazil - Year-over-year growth 2024-2029 (%)
- Exhibits185: Chart on India - Market size and forecast 2024-2029 ($ million)
- Exhibits186: Data Table on India - Market size and forecast 2024-2029 ($ million)
- Exhibits187: Chart on India - Year-over-year growth 2024-2029 (%)
- Exhibits188: Data Table on India - Year-over-year growth 2024-2029 (%)
- Exhibits189: Chart on Argentina - Market size and forecast 2024-2029 ($ million)
- Exhibits190: Data Table on Argentina - Market size and forecast 2024-2029 ($ million)
- Exhibits191: Chart on Argentina - Year-over-year growth 2024-2029 (%)
- Exhibits192: Data Table on Argentina - Year-over-year growth 2024-2029 (%)
- Exhibits193: Market opportunity By Geographical Landscape ($ million)
- Exhibits194: Data Tables on Market opportunity By Geographical Landscape ($ million)
- Exhibits195: Impact of drivers and challenges in 2024 and 2029
- Exhibits196: Overview on criticality of inputs and factors of differentiation
- Exhibits197: Overview on factors of disruption
- Exhibits198: Impact of key risks on business
- Exhibits199: Companies covered
- Exhibits200: Company ranking index
- Exhibits201: Matrix on companies position and classification
- Exhibits202: AGRO-KANESHO CO. LTD. - Overview
- Exhibits203: AGRO-KANESHO CO. LTD. - Product / Service
- Exhibits204: AGRO-KANESHO CO. LTD. - Key offerings
- Exhibits205: SWOT
- Exhibits206: American Vanguard Corp. - Overview
- Exhibits207: American Vanguard Corp. - Product / Service
- Exhibits208: American Vanguard Corp. - Key offerings
- Exhibits209: SWOT
- Exhibits210: Arkema SA - Overview
- Exhibits211: Arkema SA - Business segments
- Exhibits212: Arkema SA - Key news
- Exhibits213: Arkema SA - Key offerings
- Exhibits214: Arkema SA - Segment focus
- Exhibits215: SWOT
- Exhibits216: BASF SE - Overview
- Exhibits217: BASF SE - Business segments
- Exhibits218: BASF SE - Key news
- Exhibits219: BASF SE - Key offerings
- Exhibits220: BASF SE - Segment focus
- Exhibits221: SWOT
- Exhibits222: Bayer AG - Overview
- Exhibits223: Bayer AG - Business segments
- Exhibits224: Bayer AG - Key news
- Exhibits225: Bayer AG - Key offerings
- Exhibits226: Bayer AG - Segment focus
- Exhibits227: SWOT
- Exhibits228: China National Chemical Corp. - Overview
- Exhibits229: China National Chemical Corp. - Product / Service
- Exhibits230: China National Chemical Corp. - Key offerings
- Exhibits231: SWOT
- Exhibits232: Compagnie de Saint Gobain - Overview
- Exhibits233: Compagnie de Saint Gobain - Business segments
- Exhibits234: Compagnie de Saint Gobain - Key news
- Exhibits235: Compagnie de Saint Gobain - Key offerings
- Exhibits236: Compagnie de Saint Gobain - Segment focus
- Exhibits237: SWOT
- Exhibits238: Corteva Inc. - Overview
- Exhibits239: Corteva Inc. - Business segments
- Exhibits240: Corteva Inc. - Key news
- Exhibits241: Corteva Inc. - Key offerings
- Exhibits242: Corteva Inc. - Segment focus
- Exhibits243: SWOT
- Exhibits244: Gowan Co. - Overview
- Exhibits245: Gowan Co. - Product / Service
- Exhibits246: Gowan Co. - Key news
- Exhibits247: Gowan Co. - Key offerings
- Exhibits248: SWOT
- Exhibits249: RAG Stiftung - Overview
- Exhibits250: RAG Stiftung - Product / Service
- Exhibits251: RAG Stiftung - Key offerings
- Exhibits252: SWOT
- Exhibits253: SA LIME AND GYPSUM PTY LTD. - Overview
- Exhibits254: SA LIME AND GYPSUM PTY LTD. - Product / Service
- Exhibits255: SA LIME AND GYPSUM PTY LTD. - Key offerings
- Exhibits256: SWOT
- Exhibits257: Soil Works LLC - Overview
- Exhibits258: Soil Works LLC - Product / Service
- Exhibits259: Soil Works LLC - Key offerings
- Exhibits260: SWOT
- Exhibits261: Solvay SA - Overview
- Exhibits262: Solvay SA - Business segments
- Exhibits263: Solvay SA - Key news
- Exhibits264: Solvay SA - Key offerings
- Exhibits265: Solvay SA - Segment focus
- Exhibits266: SWOT
- Exhibits267: Swaroop Agrochemical Industries - Overview
- Exhibits268: Swaroop Agrochemical Industries - Product / Service
- Exhibits269: Swaroop Agrochemical Industries - Key offerings
- Exhibits270: SWOT
- Exhibits271: UPL Ltd. - Overview
- Exhibits272: UPL Ltd. - Business segments
- Exhibits273: UPL Ltd. - Key offerings
- Exhibits274: UPL Ltd. - Segment focus
- Exhibits275: SWOT
- Exhibits276: Inclusions checklist
- Exhibits277: Exclusions checklist
- Exhibits278: Currency conversion rates for US$
- Exhibits279: Research methodology
- Exhibits280: Information sources
- Exhibits281: Data validation
- Exhibits282: Validation techniques employed for market sizing
- Exhibits283: Data synthesis
- Exhibits284: 360 degree market analysis
- Exhibits285: List of abbreviations
The soil treatment market is forecasted to grow by USD 19645.9 mn during 2024-2029, accelerating at a CAGR of 7.2% during the forecast period. The report on the soil treatment market provides a holistic analysis, market size and forecast, trends, growth drivers, and challenges, as well as vendor analysis covering around 25 vendors.
The report offers an up-to-date analysis regarding the current market scenario, the latest trends and drivers, and the overall market environment. The market is driven by need to meet rising demand for crops, growing soil degradation and environmental concerns, and government initiatives to support agricultural practices.
| Market Scope | |
|---|---|
| Base Year | 2025 |
| End Year | 2029 |
| Series Year | 2025-2029 |
| Growth Momentum | Accelerate |
| YOY 2025 | 6.6% |
| CAGR | 7.2% |
| Incremental Value | $19645.9 mn |
The study was conducted using an objective combination of primary and secondary information including inputs from key participants in the industry. The report contains a comprehensive market size data, segment with regional analysis and vendor landscape in addition to an analysis of the key companies. Reports have historic and forecast data.
Technavio's soil treatment market is segmented as below:
By Type
- Organic amendments
- pH adjusters
- Soil protection
By Technology
- Physiochemical treatment
- Biological treatment
- Thermal treatment
By Geographical Landscape
- North America
- Europe
- APAC
- South America
- Middle East and Africa
This study identifies the growing adoption of precision agriculture in soil treatment as one of the prime reasons driving the soil treatment market growth during the next few years. Also, growing recent developments in soil treatment industry and growing adoption of organic and sustainable soil treatment practices will lead to sizable demand in the market.
The report on the soil treatment market covers the following areas:
- Soil Treatment Market sizing
- Soil Treatment Market forecast
- Soil Treatment Market industry analysis
The robust vendor analysis is designed to help clients improve their market position, and in line with this, this report provides a detailed analysis of several leading soil treatment market vendors that include AGRO-KANESHO CO. LTD., American Vanguard Corp., Arkema, BASF SE, Bayer AG, Beneficial Reuse Management, China National Chemical Corp., Compagnie de Saint-Gobain SA, Corteva Inc., Gowan Co., HERA HOLDING, Novorem Pty Ltd., RAG Stiftung, SA LIME AND GYPSUM PTY LTD., Soil Works LLC, Solvay SA, Swaroop Agrochemical Industries, Tata Sons Pvt. Ltd., TerraCottem Intl. SL, and UPL Ltd.. Also, the soil treatment market analysis report includes information on upcoming trends and challenges that will influence market growth. This is to help companies strategize and leverage all forthcoming growth opportunities.
The publisher presents a detailed picture of the market by the way of study, synthesis, and summation of data from multiple sources by an analysis of key parameters such as profit, pricing, competition, and promotions. It presents various market facets by identifying the key industry influencers. The data presented is comprehensive, reliable, and a result of extensive primary and secondary research. The market research reports provide a complete competitive landscape and an in-depth vendor selection methodology and analysis using qualitative and quantitative research to forecast accurate market growth.
Table of Contents
1 Executive Summary
- 1.1 Market overview
- Executive Summary - Chart on Market Overview
- Executive Summary - Data Table on Market Overview
- Executive Summary - Chart on Global Market Characteristics
- Executive Summary - Chart on Market By Geographical Landscape
- Executive Summary - Chart on Market Segmentation by Type
- Executive Summary - Chart on Market Segmentation by Technology
- Executive Summary - Chart on Market Segmentation by Crop Type
- Executive Summary - Chart on Market Segmentation by Application
- Executive Summary - Chart on Incremental Growth
- Executive Summary - Data Table on Incremental Growth
- Executive Summary - Chart on Company Market Positioning
2 Technavio Analysis
- 2.1 Analysis of price sensitivity, lifecycle, customer purchase basket, adoption rates, and purchase criteria
- Analysis of price sensitivity, lifecycle, customer purchase basket, adoption rates, and purchase criteria
- 2.2 Criticality of inputs and Factors of differentiation
- Overview on criticality of inputs and factors of differentiation
- 2.3 Factors of disruption
- Overview on factors of disruption
- 2.4 Impact of drivers and challenges
- Impact of drivers and challenges in 2024 and 2029
3 Market Landscape
- 3.1 Market ecosystem
- Parent Market
- Data Table on - Parent Market
- 3.2 Market characteristics
- Market characteristics analysis
- 3.3 Value chain analysis
- Value chain analysis
4 Market Sizing
- 4.1 Market definition
- Offerings of companies included in the market definition
- 4.2 Market segment analysis
- Market segments
- 4.3 Market size 2024
- 4.4 Market outlook: Forecast for 2024-2029
- Chart on Global - Market size and forecast 2024-2029 ($ million)
- Data Table on Global - Market size and forecast 2024-2029 ($ million)
- Chart on Global Market: Year-over-year growth 2024-2029 (%)
- Data Table on Global Market: Year-over-year growth 2024-2029 (%)
5 Historic Market Size
- 5.1 Global Soil Treatment Market 2019 - 2023
- Historic Market Size - Data Table on Global Soil Treatment Market 2019 - 2023 ($ million)
- 5.2 Type segment analysis 2019 - 2023
- Historic Market Size - Type Segment 2019 - 2023 ($ million)
- 5.3 Technology segment analysis 2019 - 2023
- Historic Market Size - Technology Segment 2019 - 2023 ($ million)
- 5.4 Crop Type segment analysis 2019 - 2023
- Historic Market Size - Crop Type Segment 2019 - 2023 ($ million)
- 5.5 Application segment analysis 2019 - 2023
- Historic Market Size - Application Segment 2019 - 2023 ($ million)
- 5.6 Geography segment analysis 2019 - 2023
- Historic Market Size - Geography Segment 2019 - 2023 ($ million)
- 5.7 Country segment analysis 2019 - 2023
- Historic Market Size - Country Segment 2019 - 2023 ($ million)
6 Qualitative Analysis
- 6.1 Impact of AI in Global Soil Treatment Market
7 Five Forces Analysis
- 7.1 Five forces summary
- Five forces analysis - Comparison between 2024 and 2029
- 7.2 Bargaining power of buyers
- Bargaining power of buyers - Impact of key factors 2024 and 2029
- 7.3 Bargaining power of suppliers
- Bargaining power of suppliers - Impact of key factors in 2024 and 2029
- 7.4 Threat of new entrants
- Threat of new entrants - Impact of key factors in 2024 and 2029
- 7.5 Threat of substitutes
- Threat of substitutes - Impact of key factors in 2024 and 2029
- 7.6 Threat of rivalry
- Threat of rivalry - Impact of key factors in 2024 and 2029
- 7.7 Market condition
- Chart on Market condition - Five forces 2024 and 2029
8 Market Segmentation by Type
- 8.1 Market segments
- Chart on Type - Market share 2024-2029 (%)
- Data Table on Type - Market share 2024-2029 (%)
- 8.2 Comparison by Type
- Chart on Comparison by Type
- Data Table on Comparison by Type
- 8.3 Organic amendments - Market size and forecast 2024-2029
- Chart on Organic amendments - Market size and forecast 2024-2029 ($ million)
- Data Table on Organic amendments - Market size and forecast 2024-2029 ($ million)
- Chart on Organic amendments - Year-over-year growth 2024-2029 (%)
- Data Table on Organic amendments - Year-over-year growth 2024-2029 (%)
- 8.4 pH adjusters - Market size and forecast 2024-2029
- Chart on pH adjusters - Market size and forecast 2024-2029 ($ million)
- Data Table on pH adjusters - Market size and forecast 2024-2029 ($ million)
- Chart on pH adjusters - Year-over-year growth 2024-2029 (%)
- Data Table on pH adjusters - Year-over-year growth 2024-2029 (%)
- 8.5 Soil protection - Market size and forecast 2024-2029
- Chart on Soil protection - Market size and forecast 2024-2029 ($ million)
- Data Table on Soil protection - Market size and forecast 2024-2029 ($ million)
- Chart on Soil protection - Year-over-year growth 2024-2029 (%)
- Data Table on Soil protection - Year-over-year growth 2024-2029 (%)
- 8.6 Market opportunity by Type
- Market opportunity by Type ($ million)
- Data Table on Market opportunity by Type ($ million)
9 Market Segmentation by Technology
- 9.1 Market segments
- Chart on Technology - Market share 2024-2029 (%)
- Data Table on Technology - Market share 2024-2029 (%)
- 9.2 Comparison by Technology
- Chart on Comparison by Technology
- Data Table on Comparison by Technology
- 9.3 Physiochemical treatment - Market size and forecast 2024-2029
- Chart on Physiochemical treatment - Market size and forecast 2024-2029 ($ million)
- Data Table on Physiochemical treatment - Market size and forecast 2024-2029 ($ million)
- Chart on Physiochemical treatment - Year-over-year growth 2024-2029 (%)
- Data Table on Physiochemical treatment - Year-over-year growth 2024-2029 (%)
- 9.4 Biological treatment - Market size and forecast 2024-2029
- Chart on Biological treatment - Market size and forecast 2024-2029 ($ million)
- Data Table on Biological treatment - Market size and forecast 2024-2029 ($ million)
- Chart on Biological treatment - Year-over-year growth 2024-2029 (%)
- Data Table on Biological treatment - Year-over-year growth 2024-2029 (%)
- 9.5 Thermal treatment - Market size and forecast 2024-2029
- Chart on Thermal treatment - Market size and forecast 2024-2029 ($ million)
- Data Table on Thermal treatment - Market size and forecast 2024-2029 ($ million)
- Chart on Thermal treatment - Year-over-year growth 2024-2029 (%)
- Data Table on Thermal treatment - Year-over-year growth 2024-2029 (%)
- 9.6 Market opportunity by Technology
- Market opportunity by Technology ($ million)
- Data Table on Market opportunity by Technology ($ million)
10 Market Segmentation by Crop Type
- 10.1 Market segments
- Chart on Crop Type - Market share 2024-2029 (%)
- Data Table on Crop Type - Market share 2024-2029 (%)
- 10.2 Comparison by Crop Type
- Chart on Comparison by Crop Type
- Data Table on Comparison by Crop Type
- 10.3 Commercial Crops - Market size and forecast 2024-2029
- Chart on Commercial Crops - Market size and forecast 2024-2029 ($ million)
- Data Table on Commercial Crops - Market size and forecast 2024-2029 ($ million)
- Chart on Commercial Crops - Year-over-year growth 2024-2029 (%)
- Data Table on Commercial Crops - Year-over-year growth 2024-2029 (%)
- 10.4 Fruits and Vegetables - Market size and forecast 2024-2029
- Chart on Fruits and Vegetables - Market size and forecast 2024-2029 ($ million)
- Data Table on Fruits and Vegetables - Market size and forecast 2024-2029 ($ million)
- Chart on Fruits and Vegetables - Year-over-year growth 2024-2029 (%)
- Data Table on Fruits and Vegetables - Year-over-year growth 2024-2029 (%)
- 10.5 Grains and Cereals - Market size and forecast 2024-2029
- Chart on Grains and Cereals - Market size and forecast 2024-2029 ($ million)
- Data Table on Grains and Cereals - Market size and forecast 2024-2029 ($ million)
- Chart on Grains and Cereals - Year-over-year growth 2024-2029 (%)
- Data Table on Grains and Cereals - Year-over-year growth 2024-2029 (%)
- 10.6 Pulses and Oilseeds - Market size and forecast 2024-2029
- Chart on Pulses and Oilseeds - Market size and forecast 2024-2029 ($ million)
- Data Table on Pulses and Oilseeds - Market size and forecast 2024-2029 ($ million)
- Chart on Pulses and Oilseeds - Year-over-year growth 2024-2029 (%)
- Data Table on Pulses and Oilseeds - Year-over-year growth 2024-2029 (%)
- 10.7 Turf and Ornamental - Market size and forecast 2024-2029
- Chart on Turf and Ornamental - Market size and forecast 2024-2029 ($ million)
- Data Table on Turf and Ornamental - Market size and forecast 2024-2029 ($ million)
- Chart on Turf and Ornamental - Year-over-year growth 2024-2029 (%)
- Data Table on Turf and Ornamental - Year-over-year growth 2024-2029 (%)
- 10.8 Market opportunity by Crop Type
- Market opportunity by Crop Type ($ million)
- Data Table on Market opportunity by Crop Type ($ million)
11 Market Segmentation by Application
- 11.1 Market segments
- Chart on Application - Market share 2024-2029 (%)
- Data Table on Application - Market share 2024-2029 (%)
- 11.2 Comparison by Application
- Chart on Comparison by Application
- Data Table on Comparison by Application
- 11.3 Soil fertility - Market size and forecast 2024-2029
- Chart on Soil fertility - Market size and forecast 2024-2029 ($ million)
- Data Table on Soil fertility - Market size and forecast 2024-2029 ($ million)
- Chart on Soil fertility - Year-over-year growth 2024-2029 (%)
- Data Table on Soil fertility - Year-over-year growth 2024-2029 (%)
- 11.4 Soil protection - Market size and forecast 2024-2029
- Chart on Soil protection - Market size and forecast 2024-2029 ($ million)
- Data Table on Soil protection - Market size and forecast 2024-2029 ($ million)
- Chart on Soil protection - Year-over-year growth 2024-2029 (%)
- Data Table on Soil protection - Year-over-year growth 2024-2029 (%)
- 11.5 Weed control - Market size and forecast 2024-2029
- Chart on Weed control - Market size and forecast 2024-2029 ($ million)
- Data Table on Weed control - Market size and forecast 2024-2029 ($ million)
- Chart on Weed control - Year-over-year growth 2024-2029 (%)
- Data Table on Weed control - Year-over-year growth 2024-2029 (%)
- 11.6 Pest control - Market size and forecast 2024-2029
- Chart on Pest control - Market size and forecast 2024-2029 ($ million)
- Data Table on Pest control - Market size and forecast 2024-2029 ($ million)
- Chart on Pest control - Year-over-year growth 2024-2029 (%)
- Data Table on Pest control - Year-over-year growth 2024-2029 (%)
- 11.7 Others - Market size and forecast 2024-2029
- Chart on Others - Market size and forecast 2024-2029 ($ million)
- Data Table on Others - Market size and forecast 2024-2029 ($ million)
- Chart on Others - Year-over-year growth 2024-2029 (%)
- Data Table on Others - Year-over-year growth 2024-2029 (%)
- 11.8 Market opportunity by Application
- Market opportunity by Application ($ million)
- Data Table on Market opportunity by Application ($ million)
12 Customer Landscape
- 12.1 Customer landscape overview
- Analysis of price sensitivity, lifecycle, customer purchase basket, adoption rates, and purchase criteria
13 Geographic Landscape
- 13.1 Geographic segmentation
- Chart on Market share By Geographical Landscape 2024-2029 (%)
- Data Table on Market share By Geographical Landscape 2024-2029 (%)
- 13.2 Geographic comparison
- Chart on Geographic comparison
- Data Table on Geographic comparison
- 13.3 North America - Market size and forecast 2024-2029
- Chart on North America - Market size and forecast 2024-2029 ($ million)
- Data Table on North America - Market size and forecast 2024-2029 ($ million)
- Chart on North America - Year-over-year growth 2024-2029 (%)
- Data Table on North America - Year-over-year growth 2024-2029 (%)
- 13.4 Europe - Market size and forecast 2024-2029
- Chart on Europe - Market size and forecast 2024-2029 ($ million)
- Data Table on Europe - Market size and forecast 2024-2029 ($ million)
- Chart on Europe - Year-over-year growth 2024-2029 (%)
- Data Table on Europe - Year-over-year growth 2024-2029 (%)
- 13.5 APAC - Market size and forecast 2024-2029
- Chart on APAC - Market size and forecast 2024-2029 ($ million)
- Data Table on APAC - Market size and forecast 2024-2029 ($ million)
- Chart on APAC - Year-over-year growth 2024-2029 (%)
- Data Table on APAC - Year-over-year growth 2024-2029 (%)
- 13.6 South America - Market size and forecast 2024-2029
- Chart on South America - Market size and forecast 2024-2029 ($ million)
- Data Table on South America - Market size and forecast 2024-2029 ($ million)
- Chart on South America - Year-over-year growth 2024-2029 (%)
- Data Table on South America - Year-over-year growth 2024-2029 (%)
- 13.7 Middle East and Africa - Market size and forecast 2024-2029
- Chart on Middle East and Africa - Market size and forecast 2024-2029 ($ million)
- Data Table on Middle East and Africa - Market size and forecast 2024-2029 ($ million)
- Chart on Middle East and Africa - Year-over-year growth 2024-2029 (%)
- Data Table on Middle East and Africa - Year-over-year growth 2024-2029 (%)
- 13.8 US - Market size and forecast 2024-2029
- Chart on US - Market size and forecast 2024-2029 ($ million)
- Data Table on US - Market size and forecast 2024-2029 ($ million)
- Chart on US - Year-over-year growth 2024-2029 (%)
- Data Table on US - Year-over-year growth 2024-2029 (%)
- 13.9 China - Market size and forecast 2024-2029
- Chart on China - Market size and forecast 2024-2029 ($ million)
- Data Table on China - Market size and forecast 2024-2029 ($ million)
- Chart on China - Year-over-year growth 2024-2029 (%)
- Data Table on China - Year-over-year growth 2024-2029 (%)
- 13.10 Spain - Market size and forecast 2024-2029
- Chart on Spain - Market size and forecast 2024-2029 ($ million)
- Data Table on Spain - Market size and forecast 2024-2029 ($ million)
- Chart on Spain - Year-over-year growth 2024-2029 (%)
- Data Table on Spain - Year-over-year growth 2024-2029 (%)
- 13.11 Germany - Market size and forecast 2024-2029
- Chart on Germany - Market size and forecast 2024-2029 ($ million)
- Data Table on Germany - Market size and forecast 2024-2029 ($ million)
- Chart on Germany - Year-over-year growth 2024-2029 (%)
- Data Table on Germany - Year-over-year growth 2024-2029 (%)
- 13.12 Japan - Market size and forecast 2024-2029
- Chart on Japan - Market size and forecast 2024-2029 ($ million)
- Data Table on Japan - Market size and forecast 2024-2029 ($ million)
- Chart on Japan - Year-over-year growth 2024-2029 (%)
- Data Table on Japan - Year-over-year growth 2024-2029 (%)
- 13.13 UK - Market size and forecast 2024-2029
- Chart on UK - Market size and forecast 2024-2029 ($ million)
- Data Table on UK - Market size and forecast 2024-2029 ($ million)
- Chart on UK - Year-over-year growth 2024-2029 (%)
- Data Table on UK - Year-over-year growth 2024-2029 (%)
- 13.14 Canada - Market size and forecast 2024-2029
- Chart on Canada - Market size and forecast 2024-2029 ($ million)
- Data Table on Canada - Market size and forecast 2024-2029 ($ million)
- Chart on Canada - Year-over-year growth 2024-2029 (%)
- Data Table on Canada - Year-over-year growth 2024-2029 (%)
- 13.15 Brazil - Market size and forecast 2024-2029
- Chart on Brazil - Market size and forecast 2024-2029 ($ million)
- Data Table on Brazil - Market size and forecast 2024-2029 ($ million)
- Chart on Brazil - Year-over-year growth 2024-2029 (%)
- Data Table on Brazil - Year-over-year growth 2024-2029 (%)
- 13.16 India - Market size and forecast 2024-2029
- Chart on India - Market size and forecast 2024-2029 ($ million)
- Data Table on India - Market size and forecast 2024-2029 ($ million)
- Chart on India - Year-over-year growth 2024-2029 (%)
- Data Table on India - Year-over-year growth 2024-2029 (%)
- 13.17 Argentina - Market size and forecast 2024-2029
- Chart on Argentina - Market size and forecast 2024-2029 ($ million)
- Data Table on Argentina - Market size and forecast 2024-2029 ($ million)
- Chart on Argentina - Year-over-year growth 2024-2029 (%)
- Data Table on Argentina - Year-over-year growth 2024-2029 (%)
- 13.18 Market opportunity By Geographical Landscape
- Market opportunity By Geographical Landscape ($ million)
- Data Tables on Market opportunity By Geographical Landscape ($ million)
14 Drivers, Challenges, and Opportunity/Restraints
- 14.1 Market drivers
- 14.2 Market challenges
- 14.3 Impact of drivers and challenges
- Impact of drivers and challenges in 2024 and 2029
- 14.4 Market opportunities/restraints
15 Competitive Landscape
- 15.1 Overview
- 15.2 Competitive Landscape
- Overview on criticality of inputs and factors of differentiation
- 15.3 Landscape disruption
- Overview on factors of disruption
- 15.4 Industry risks
- Impact of key risks on business
16 Competitive Analysis
- 16.1 Companies profiled
- Companies covered
- 16.2 Company ranking index
- Company ranking index
- 16.3 Market positioning of companies
- Matrix on companies position and classification
- 16.4 AGRO-KANESHO CO. LTD.
- AGRO-KANESHO CO. LTD. - Overview
- AGRO-KANESHO CO. LTD. - Product / Service
- AGRO-KANESHO CO. LTD. - Key offerings
- SWOT
- 16.5 American Vanguard Corp.
- American Vanguard Corp. - Overview
- American Vanguard Corp. - Product / Service
- American Vanguard Corp. - Key offerings
- SWOT
- 16.6 Arkema SA
- Arkema SA - Overview
- Arkema SA - Business segments
- Arkema SA - Key news
- Arkema SA - Key offerings
- Arkema SA - Segment focus
- SWOT
- 16.7 BASF SE
- BASF SE - Overview
- BASF SE - Business segments
- BASF SE - Key news
- BASF SE - Key offerings
- BASF SE - Segment focus
- SWOT
- 16.8 Bayer AG
- Bayer AG - Overview
- Bayer AG - Business segments
- Bayer AG - Key news
- Bayer AG - Key offerings
- Bayer AG - Segment focus
- SWOT
- 16.9 China National Chemical Corp.
- China National Chemical Corp. - Overview
- China National Chemical Corp. - Product / Service
- China National Chemical Corp. - Key offerings
- SWOT
- 16.10 Compagnie de Saint Gobain
- Compagnie de Saint Gobain - Overview
- Compagnie de Saint Gobain - Business segments
- Compagnie de Saint Gobain - Key news
- Compagnie de Saint Gobain - Key offerings
- Compagnie de Saint Gobain - Segment focus
- SWOT
- 16.11 Corteva Inc.
- Corteva Inc. - Overview
- Corteva Inc. - Business segments
- Corteva Inc. - Key news
- Corteva Inc. - Key offerings
- Corteva Inc. - Segment focus
- SWOT
- 16.12 Gowan Co.
- Gowan Co. - Overview
- Gowan Co. - Product / Service
- Gowan Co. - Key news
- Gowan Co. - Key offerings
- SWOT
- 16.13 RAG Stiftung
- RAG Stiftung - Overview
- RAG Stiftung - Product / Service
- RAG Stiftung - Key offerings
- SWOT
- 16.14 SA LIME AND GYPSUM PTY LTD.
- SA LIME AND GYPSUM PTY LTD. - Overview
- SA LIME AND GYPSUM PTY LTD. - Product / Service
- SA LIME AND GYPSUM PTY LTD. - Key offerings
- SWOT
- 16.15 Soil Works LLC
- Soil Works LLC - Overview
- Soil Works LLC - Product / Service
- Soil Works LLC - Key offerings
- SWOT
- 16.16 Solvay SA
- Solvay SA - Overview
- Solvay SA - Business segments
- Solvay SA - Key news
- Solvay SA - Key offerings
- Solvay SA - Segment focus
- SWOT
- 16.17 Swaroop Agrochemical Industries
- Swaroop Agrochemical Industries - Overview
- Swaroop Agrochemical Industries - Product / Service
- Swaroop Agrochemical Industries - Key offerings
- SWOT
- 16.18 UPL Ltd.
- UPL Ltd. - Overview
- UPL Ltd. - Business segments
- UPL Ltd. - Key offerings
- UPL Ltd. - Segment focus
- SWOT
17 Appendix
- 17.1 Scope of the report
- 17.2 Inclusions and exclusions checklist
- Inclusions checklist
- Exclusions checklist
- 17.3 Currency conversion rates for US$
- Currency conversion rates for US$
- 17.4 Research methodology
- Research methodology
- 17.5 Data procurement
- Information sources
- 17.6 Data validation
- Data validation
- 17.7 Validation techniques employed for market sizing
- Validation techniques employed for market sizing
- 17.8 Data synthesis
- Data synthesis
- 17.9 360 degree market analysis
- 360 degree market analysis
- 17.10 List of abbreviations
- List of abbreviations

