|
|
市場調査レポート
商品コード
1697323
リコリスの世界市場 2025-2029Global Liquorice Market 2025-2029 |
||||||

|
|||||||
カスタマイズ可能
|
|||||||


| リコリスの世界市場 2025-2029 |
|
出版日: 2025年03月28日
発行: TechNavio
ページ情報: 英文 248 Pages
納期: 即納可能
|

全表示
- 概要
- 図表
- 目次
リコリス市場は2024-2029年に7億6,350万米ドル、予測期間中のCAGRは6.4%で成長すると予測されます。
当レポートでは、リコリス市場の全体的な分析、市場規模・予測、動向、成長促進要因、課題、約25のベンダーを網羅したベンダー分析などを掲載しています。
現在の市場シナリオ、最新動向と促進要因、市場環境全体に関する最新分析を提供しています。市場は、ハーブ成分を含む飲食品の需要拡大、ハーブ薬の採用拡大、葉巻や喫煙用タバコ製品の需要増加によって牽引されています。
| 市場範囲 | |
|---|---|
| 基準年 | 2025 |
| 終了年 | 2029 |
| 予測期間 | 2025-2029 |
| 成長モメンタム | 加速 |
| 前年比2025年 | 5.6% |
| CAGR | 6.4% |
| 増分額 | 7億6,350万米ドル |
本調査は、業界の主要参加者からのインプットを含め、一次情報と二次情報を客観的に組み合わせて実施しました。レポートには、主要企業の分析に加え、包括的な市場規模データ、地域分析によるセグメント、ベンダー情勢が含まれています。レポートには過去データと予測データがあります。
本調査では、今後数年間のリコリス市場の成長を促進する主な理由の一つとして、ハーブエキスの免疫力向上特性を挙げています。また、eコマース産業の成長、リコリスを使用したがんの治療調査の増加は、市場の大きな需要につながるでしょう。
目次
第1章 エグゼクティブサマリー
- 市場概要
第2章 Technavio分析
- 価格・ライフサイクル・顧客購入バスケット・採用率・購入基準の分析
- インプットの重要性と差別化の要因
- 混乱の要因
- 促進要因と課題の影響
第3章 市場情勢
- 市場エコシステム
- 市場の特徴
- バリューチェーン分析
第4章 市場規模
- 市場の定義
- 市場セグメント分析
- 市場規模 2024
- 市場の見通し 2024-2029
第5章 市場規模実績
- リコリスの世界市場 2019-2023
- 学年タイプセグメント分析 2019-2023
- 用途別セグメント分析 2019-2023
- 製品タイプセグメント分析 2019-2023
- 流通チャネルセグメント分析 2019-2023
- エンドユーザーセグメント分析 2019-2023
- 地域別セグメント分析 2019-2023
- 国別セグメント分析 2019-2023
第6章 定性分析
- AIの影響:リコリスの世界市場
第7章 ファイブフォース分析
- ファイブフォースの要約
- 買い手の交渉力
- 供給企業の交渉力
- 新規参入業者の脅威
- 代替品の脅威
- 競争の脅威
- 市況
第8章 市場セグメンテーション:グレードタイプ別
- 市場セグメント
- 比較:グレードタイプ別
- 食品グレード:市場規模と予測 2024-2029
- 飼料グレード:市場規模と予測 2024-2029
- 医薬品グレード:市場規模と予測 2024-2029
- 市場機会:グレードタイプ別
第9章 市場セグメンテーション:用途別
- 市場セグメント
- 比較:用途別
- 飲食品:市場規模と予測 2024-2029
- 医薬品:市場規模と予測 2024-2029
- タバコ:市場規模と予測 2024-2029
- その他:市場規模と予測 2024-2029
- 市場機会:用途別
第10章 市場セグメンテーション:製品タイプ別
- 市場セグメント
- 比較:製品タイプ別
- フルーツ風味のリコリス:市場規模と予測 2024-2029
- オリジナルブラックリコリス:市場規模と予測 2024-2029
- 市場機会:製品タイプ別
第11章 市場セグメンテーション:流通チャネル別
- 市場セグメント
- 比較:流通チャネル別
- スーパーマーケット:市場規模と予測 2024-2029
- オンライン販売:市場規模と予測 2024-2029
- コンビニエンスストア:市場規模と予測 2024-2029
- 市場機会:流通チャネル別
第12章 市場セグメンテーション:エンドユーザー別
- 市場セグメント
- 比較:エンドユーザー別
- 個人消費者:市場規模と予測 2024-2029
- 産業ユーザー:市場規模と予測 2024-2029
- 市場機会:エンドユーザー別
第13章 顧客情勢
- 顧客情勢の概要
第14章 地域別情勢
- 地域別セグメンテーション
- 地域別比較
- アジア太平洋:市場規模と予測 2024-2029
- 欧州:市場規模と予測 2024-2029
- 北米:市場規模と予測 2024-2029
- 中東・アフリカ:市場規模と予測 2024-2029
- 南米:市場規模と予測 2024-2029
- 米国:市場規模と予測 2024-2029
- 中国:市場規模と予測 2024-2029
- ドイツ:市場規模と予測 2024-2029
- 日本:市場規模と予測 2024-2029
- インド:市場規模と予測 2024-2029
- 英国:市場規模と予測 2024-2029
- 韓国:市場規模と予測 2024-2029
- フランス:市場規模と予測 2024-2029
- イタリア:市場規模と予測 2024-2029
- カナダ:市場規模と予測 2024-2029
- 市場機会:地域情勢別
第15章 促進要因・課題・機会・抑制要因
- 市場促進要因
- 市場の課題
- 促進要因と課題の影響
- 市場の機会・抑制要因
第16章 競合情勢
- 概要
- 競合情勢
- 混乱の状況
- 業界のリスク
第17章 競合分析
- 企業プロファイル
- 企業ランキング指数
- 企業の市場ポジショニング
- Beijing Gingko Group
- Botanic Healthcare Group
- C.E. Roeper GmbH
- F and C Licorice Ltd.
- Glycyrrhiza Glabra Co. Ltd.
- HB Natural Ingredients
- Mafco Worldwide LLC
- Maruzen Pharmaceutical Co. Ltd.
- Norevo GmbH
- Nutra Green Biotechnology Co. Ltd.
- Ransom Naturals Ltd.
- Sepidan Osareh Jonoob Co.
- Shaanxi FUJIE Pharmaceutical Co. Ltd.
- Shirin Daru Co.
- Zagros Licorice co.
第18章 付録
Exhibits:
- Exhibits1: Executive Summary - Chart on Market Overview
- Exhibits2: Executive Summary - Data Table on Market Overview
- Exhibits3: Executive Summary - Chart on Global Market Characteristics
- Exhibits4: Executive Summary - Chart on Market By Geographical Landscape
- Exhibits5: Executive Summary - Chart on Market Segmentation by Grade Type
- Exhibits6: Executive Summary - Chart on Market Segmentation by Application
- Exhibits7: Executive Summary - Chart on Market Segmentation by Product Type
- Exhibits8: Executive Summary - Chart on Market Segmentation by Distribution Channel
- Exhibits9: Executive Summary - Chart on Market Segmentation by End-user
- Exhibits10: Executive Summary - Chart on Incremental Growth
- Exhibits11: Executive Summary - Data Table on Incremental Growth
- Exhibits12: Executive Summary - Chart on Company Market Positioning
- Exhibits13: Analysis of price sensitivity, lifecycle, customer purchase basket, adoption rates, and purchase criteria
- Exhibits14: Overview on criticality of inputs and factors of differentiation
- Exhibits15: Overview on factors of disruption
- Exhibits16: Impact of drivers and challenges in 2024 and 2029
- Exhibits17: Parent Market
- Exhibits18: Data Table on - Parent Market
- Exhibits19: Market characteristics analysis
- Exhibits20: Value chain analysis
- Exhibits21: Offerings of companies included in the market definition
- Exhibits22: Market segments
- Exhibits23: Chart on Global - Market size and forecast 2024-2029 ($ million)
- Exhibits24: Data Table on Global - Market size and forecast 2024-2029 ($ million)
- Exhibits25: Chart on Global Market: Year-over-year growth 2024-2029 (%)
- Exhibits26: Data Table on Global Market: Year-over-year growth 2024-2029 (%)
- Exhibits27: Historic Market Size - Data Table on Global Liquorice Market 2019 - 2023 ($ million)
- Exhibits28: Historic Market Size - Grade Type Segment 2019 - 2023 ($ million)
- Exhibits29: Historic Market Size - Application Segment 2019 - 2023 ($ million)
- Exhibits30: Historic Market Size - Product Type Segment 2019 - 2023 ($ million)
- Exhibits31: Historic Market Size - Distribution Channel Segment 2019 - 2023 ($ million)
- Exhibits32: Historic Market Size - End-user Segment 2019 - 2023 ($ million)
- Exhibits33: Historic Market Size - Geography Segment 2019 - 2023 ($ million)
- Exhibits34: Historic Market Size - Country Segment 2019 - 2023 ($ million)
- Exhibits35: Five forces analysis - Comparison between 2024 and 2029
- Exhibits36: Bargaining power of buyers - Impact of key factors 2024 and 2029
- Exhibits37: Bargaining power of suppliers - Impact of key factors in 2024 and 2029
- Exhibits38: Threat of new entrants - Impact of key factors in 2024 and 2029
- Exhibits39: Threat of substitutes - Impact of key factors in 2024 and 2029
- Exhibits40: Threat of rivalry - Impact of key factors in 2024 and 2029
- Exhibits41: Chart on Market condition - Five forces 2024 and 2029
- Exhibits42: Chart on Grade Type - Market share 2024-2029 (%)
- Exhibits43: Data Table on Grade Type - Market share 2024-2029 (%)
- Exhibits44: Chart on Comparison by Grade Type
- Exhibits45: Data Table on Comparison by Grade Type
- Exhibits46: Chart on Food grade - Market size and forecast 2024-2029 ($ million)
- Exhibits47: Data Table on Food grade - Market size and forecast 2024-2029 ($ million)
- Exhibits48: Chart on Food grade - Year-over-year growth 2024-2029 (%)
- Exhibits49: Data Table on Food grade - Year-over-year growth 2024-2029 (%)
- Exhibits50: Chart on Feed grade - Market size and forecast 2024-2029 ($ million)
- Exhibits51: Data Table on Feed grade - Market size and forecast 2024-2029 ($ million)
- Exhibits52: Chart on Feed grade - Year-over-year growth 2024-2029 (%)
- Exhibits53: Data Table on Feed grade - Year-over-year growth 2024-2029 (%)
- Exhibits54: Chart on Pharmaceutical grade - Market size and forecast 2024-2029 ($ million)
- Exhibits55: Data Table on Pharmaceutical grade - Market size and forecast 2024-2029 ($ million)
- Exhibits56: Chart on Pharmaceutical grade - Year-over-year growth 2024-2029 (%)
- Exhibits57: Data Table on Pharmaceutical grade - Year-over-year growth 2024-2029 (%)
- Exhibits58: Market opportunity by Grade Type ($ million)
- Exhibits59: Data Table on Market opportunity by Grade Type ($ million)
- Exhibits60: Chart on Application - Market share 2024-2029 (%)
- Exhibits61: Data Table on Application - Market share 2024-2029 (%)
- Exhibits62: Chart on Comparison by Application
- Exhibits63: Data Table on Comparison by Application
- Exhibits64: Chart on Food and beverages - Market size and forecast 2024-2029 ($ million)
- Exhibits65: Data Table on Food and beverages - Market size and forecast 2024-2029 ($ million)
- Exhibits66: Chart on Food and beverages - Year-over-year growth 2024-2029 (%)
- Exhibits67: Data Table on Food and beverages - Year-over-year growth 2024-2029 (%)
- Exhibits68: Chart on Pharmaceuticals - Market size and forecast 2024-2029 ($ million)
- Exhibits69: Data Table on Pharmaceuticals - Market size and forecast 2024-2029 ($ million)
- Exhibits70: Chart on Pharmaceuticals - Year-over-year growth 2024-2029 (%)
- Exhibits71: Data Table on Pharmaceuticals - Year-over-year growth 2024-2029 (%)
- Exhibits72: Chart on Tobacco - Market size and forecast 2024-2029 ($ million)
- Exhibits73: Data Table on Tobacco - Market size and forecast 2024-2029 ($ million)
- Exhibits74: Chart on Tobacco - Year-over-year growth 2024-2029 (%)
- Exhibits75: Data Table on Tobacco - Year-over-year growth 2024-2029 (%)
- Exhibits76: Chart on Others - Market size and forecast 2024-2029 ($ million)
- Exhibits77: Data Table on Others - Market size and forecast 2024-2029 ($ million)
- Exhibits78: Chart on Others - Year-over-year growth 2024-2029 (%)
- Exhibits79: Data Table on Others - Year-over-year growth 2024-2029 (%)
- Exhibits80: Market opportunity by Application ($ million)
- Exhibits81: Data Table on Market opportunity by Application ($ million)
- Exhibits82: Chart on Product Type - Market share 2024-2029 (%)
- Exhibits83: Data Table on Product Type - Market share 2024-2029 (%)
- Exhibits84: Chart on Comparison by Product Type
- Exhibits85: Data Table on Comparison by Product Type
- Exhibits86: Chart on Fruit flavored licorice - Market size and forecast 2024-2029 ($ million)
- Exhibits87: Data Table on Fruit flavored licorice - Market size and forecast 2024-2029 ($ million)
- Exhibits88: Chart on Fruit flavored licorice - Year-over-year growth 2024-2029 (%)
- Exhibits89: Data Table on Fruit flavored licorice - Year-over-year growth 2024-2029 (%)
- Exhibits90: Chart on Original black licorice - Market size and forecast 2024-2029 ($ million)
- Exhibits91: Data Table on Original black licorice - Market size and forecast 2024-2029 ($ million)
- Exhibits92: Chart on Original black licorice - Year-over-year growth 2024-2029 (%)
- Exhibits93: Data Table on Original black licorice - Year-over-year growth 2024-2029 (%)
- Exhibits94: Market opportunity by Product Type ($ million)
- Exhibits95: Data Table on Market opportunity by Product Type ($ million)
- Exhibits96: Chart on Distribution Channel - Market share 2024-2029 (%)
- Exhibits97: Data Table on Distribution Channel - Market share 2024-2029 (%)
- Exhibits98: Chart on Comparison by Distribution Channel
- Exhibits99: Data Table on Comparison by Distribution Channel
- Exhibits100: Chart on Supermarkets - Market size and forecast 2024-2029 ($ million)
- Exhibits101: Data Table on Supermarkets - Market size and forecast 2024-2029 ($ million)
- Exhibits102: Chart on Supermarkets - Year-over-year growth 2024-2029 (%)
- Exhibits103: Data Table on Supermarkets - Year-over-year growth 2024-2029 (%)
- Exhibits104: Chart on Online sales - Market size and forecast 2024-2029 ($ million)
- Exhibits105: Data Table on Online sales - Market size and forecast 2024-2029 ($ million)
- Exhibits106: Chart on Online sales - Year-over-year growth 2024-2029 (%)
- Exhibits107: Data Table on Online sales - Year-over-year growth 2024-2029 (%)
- Exhibits108: Chart on Convenience stores - Market size and forecast 2024-2029 ($ million)
- Exhibits109: Data Table on Convenience stores - Market size and forecast 2024-2029 ($ million)
- Exhibits110: Chart on Convenience stores - Year-over-year growth 2024-2029 (%)
- Exhibits111: Data Table on Convenience stores - Year-over-year growth 2024-2029 (%)
- Exhibits112: Market opportunity by Distribution Channel ($ million)
- Exhibits113: Data Table on Market opportunity by Distribution Channel ($ million)
- Exhibits114: Chart on End-user - Market share 2024-2029 (%)
- Exhibits115: Data Table on End-user - Market share 2024-2029 (%)
- Exhibits116: Chart on Comparison by End-user
- Exhibits117: Data Table on Comparison by End-user
- Exhibits118: Chart on Individual consumers - Market size and forecast 2024-2029 ($ million)
- Exhibits119: Data Table on Individual consumers - Market size and forecast 2024-2029 ($ million)
- Exhibits120: Chart on Individual consumers - Year-over-year growth 2024-2029 (%)
- Exhibits121: Data Table on Individual consumers - Year-over-year growth 2024-2029 (%)
- Exhibits122: Chart on Industrial users - Market size and forecast 2024-2029 ($ million)
- Exhibits123: Data Table on Industrial users - Market size and forecast 2024-2029 ($ million)
- Exhibits124: Chart on Industrial users - Year-over-year growth 2024-2029 (%)
- Exhibits125: Data Table on Industrial users - Year-over-year growth 2024-2029 (%)
- Exhibits126: Market opportunity by End-user ($ million)
- Exhibits127: Data Table on Market opportunity by End-user ($ million)
- Exhibits128: Analysis of price sensitivity, lifecycle, customer purchase basket, adoption rates, and purchase criteria
- Exhibits129: Chart on Market share By Geographical Landscape 2024-2029 (%)
- Exhibits130: Data Table on Market share By Geographical Landscape 2024-2029 (%)
- Exhibits131: Chart on Geographic comparison
- Exhibits132: Data Table on Geographic comparison
- Exhibits133: Chart on APAC - Market size and forecast 2024-2029 ($ million)
- Exhibits134: Data Table on APAC - Market size and forecast 2024-2029 ($ million)
- Exhibits135: Chart on APAC - Year-over-year growth 2024-2029 (%)
- Exhibits136: Data Table on APAC - Year-over-year growth 2024-2029 (%)
- Exhibits137: Chart on Europe - Market size and forecast 2024-2029 ($ million)
- Exhibits138: Data Table on Europe - Market size and forecast 2024-2029 ($ million)
- Exhibits139: Chart on Europe - Year-over-year growth 2024-2029 (%)
- Exhibits140: Data Table on Europe - Year-over-year growth 2024-2029 (%)
- Exhibits141: Chart on North America - Market size and forecast 2024-2029 ($ million)
- Exhibits142: Data Table on North America - Market size and forecast 2024-2029 ($ million)
- Exhibits143: Chart on North America - Year-over-year growth 2024-2029 (%)
- Exhibits144: Data Table on North America - Year-over-year growth 2024-2029 (%)
- Exhibits145: Chart on Middle East and Africa - Market size and forecast 2024-2029 ($ million)
- Exhibits146: Data Table on Middle East and Africa - Market size and forecast 2024-2029 ($ million)
- Exhibits147: Chart on Middle East and Africa - Year-over-year growth 2024-2029 (%)
- Exhibits148: Data Table on Middle East and Africa - Year-over-year growth 2024-2029 (%)
- Exhibits149: Chart on South America - Market size and forecast 2024-2029 ($ million)
- Exhibits150: Data Table on South America - Market size and forecast 2024-2029 ($ million)
- Exhibits151: Chart on South America - Year-over-year growth 2024-2029 (%)
- Exhibits152: Data Table on South America - Year-over-year growth 2024-2029 (%)
- Exhibits153: Chart on US - Market size and forecast 2024-2029 ($ million)
- Exhibits154: Data Table on US - Market size and forecast 2024-2029 ($ million)
- Exhibits155: Chart on US - Year-over-year growth 2024-2029 (%)
- Exhibits156: Data Table on US - Year-over-year growth 2024-2029 (%)
- Exhibits157: Chart on China - Market size and forecast 2024-2029 ($ million)
- Exhibits158: Data Table on China - Market size and forecast 2024-2029 ($ million)
- Exhibits159: Chart on China - Year-over-year growth 2024-2029 (%)
- Exhibits160: Data Table on China - Year-over-year growth 2024-2029 (%)
- Exhibits161: Chart on Germany - Market size and forecast 2024-2029 ($ million)
- Exhibits162: Data Table on Germany - Market size and forecast 2024-2029 ($ million)
- Exhibits163: Chart on Germany - Year-over-year growth 2024-2029 (%)
- Exhibits164: Data Table on Germany - Year-over-year growth 2024-2029 (%)
- Exhibits165: Chart on Japan - Market size and forecast 2024-2029 ($ million)
- Exhibits166: Data Table on Japan - Market size and forecast 2024-2029 ($ million)
- Exhibits167: Chart on Japan - Year-over-year growth 2024-2029 (%)
- Exhibits168: Data Table on Japan - Year-over-year growth 2024-2029 (%)
- Exhibits169: Chart on India - Market size and forecast 2024-2029 ($ million)
- Exhibits170: Data Table on India - Market size and forecast 2024-2029 ($ million)
- Exhibits171: Chart on India - Year-over-year growth 2024-2029 (%)
- Exhibits172: Data Table on India - Year-over-year growth 2024-2029 (%)
- Exhibits173: Chart on UK - Market size and forecast 2024-2029 ($ million)
- Exhibits174: Data Table on UK - Market size and forecast 2024-2029 ($ million)
- Exhibits175: Chart on UK - Year-over-year growth 2024-2029 (%)
- Exhibits176: Data Table on UK - Year-over-year growth 2024-2029 (%)
- Exhibits177: Chart on South Korea - Market size and forecast 2024-2029 ($ million)
- Exhibits178: Data Table on South Korea - Market size and forecast 2024-2029 ($ million)
- Exhibits179: Chart on South Korea - Year-over-year growth 2024-2029 (%)
- Exhibits180: Data Table on South Korea - Year-over-year growth 2024-2029 (%)
- Exhibits181: Chart on France - Market size and forecast 2024-2029 ($ million)
- Exhibits182: Data Table on France - Market size and forecast 2024-2029 ($ million)
- Exhibits183: Chart on France - Year-over-year growth 2024-2029 (%)
- Exhibits184: Data Table on France - Year-over-year growth 2024-2029 (%)
- Exhibits185: Chart on Italy - Market size and forecast 2024-2029 ($ million)
- Exhibits186: Data Table on Italy - Market size and forecast 2024-2029 ($ million)
- Exhibits187: Chart on Italy - Year-over-year growth 2024-2029 (%)
- Exhibits188: Data Table on Italy - Year-over-year growth 2024-2029 (%)
- Exhibits189: Chart on Canada - Market size and forecast 2024-2029 ($ million)
- Exhibits190: Data Table on Canada - Market size and forecast 2024-2029 ($ million)
- Exhibits191: Chart on Canada - Year-over-year growth 2024-2029 (%)
- Exhibits192: Data Table on Canada - Year-over-year growth 2024-2029 (%)
- Exhibits193: Market opportunity By Geographical Landscape ($ million)
- Exhibits194: Data Tables on Market opportunity By Geographical Landscape ($ million)
- Exhibits195: Impact of drivers and challenges in 2024 and 2029
- Exhibits196: Overview on criticality of inputs and factors of differentiation
- Exhibits197: Overview on factors of disruption
- Exhibits198: Impact of key risks on business
- Exhibits199: Companies covered
- Exhibits200: Company ranking index
- Exhibits201: Matrix on companies position and classification
- Exhibits202: Beijing Gingko Group - Overview
- Exhibits203: Beijing Gingko Group - Product / Service
- Exhibits204: Beijing Gingko Group - Key news
- Exhibits205: Beijing Gingko Group - Key offerings
- Exhibits206: SWOT
- Exhibits207: Botanic Healthcare Group - Overview
- Exhibits208: Botanic Healthcare Group - Product / Service
- Exhibits209: Botanic Healthcare Group - Key offerings
- Exhibits210: SWOT
- Exhibits211: C.E. Roeper GmbH - Overview
- Exhibits212: C.E. Roeper GmbH - Product / Service
- Exhibits213: C.E. Roeper GmbH - Key offerings
- Exhibits214: SWOT
- Exhibits215: F and C Licorice Ltd. - Overview
- Exhibits216: F and C Licorice Ltd. - Product / Service
- Exhibits217: F and C Licorice Ltd. - Key offerings
- Exhibits218: SWOT
- Exhibits219: Glycyrrhiza Glabra Co. Ltd. - Overview
- Exhibits220: Glycyrrhiza Glabra Co. Ltd. - Product / Service
- Exhibits221: Glycyrrhiza Glabra Co. Ltd. - Key offerings
- Exhibits222: SWOT
- Exhibits223: HB Natural Ingredients - Overview
- Exhibits224: HB Natural Ingredients - Product / Service
- Exhibits225: HB Natural Ingredients - Key offerings
- Exhibits226: SWOT
- Exhibits227: Mafco Worldwide LLC - Overview
- Exhibits228: Mafco Worldwide LLC - Product / Service
- Exhibits229: Mafco Worldwide LLC - Key offerings
- Exhibits230: SWOT
- Exhibits231: Maruzen Pharmaceutical Co. Ltd. - Overview
- Exhibits232: Maruzen Pharmaceutical Co. Ltd. - Product / Service
- Exhibits233: Maruzen Pharmaceutical Co. Ltd. - Key news
- Exhibits234: Maruzen Pharmaceutical Co. Ltd. - Key offerings
- Exhibits235: SWOT
- Exhibits236: Norevo GmbH - Overview
- Exhibits237: Norevo GmbH - Product / Service
- Exhibits238: Norevo GmbH - Key offerings
- Exhibits239: SWOT
- Exhibits240: Nutra Green Biotechnology Co. Ltd. - Overview
- Exhibits241: Nutra Green Biotechnology Co. Ltd. - Product / Service
- Exhibits242: Nutra Green Biotechnology Co. Ltd. - Key offerings
- Exhibits243: SWOT
- Exhibits244: Ransom Naturals Ltd. - Overview
- Exhibits245: Ransom Naturals Ltd. - Product / Service
- Exhibits246: Ransom Naturals Ltd. - Key offerings
- Exhibits247: SWOT
- Exhibits248: Sepidan Osareh Jonoob Co. - Overview
- Exhibits249: Sepidan Osareh Jonoob Co. - Product / Service
- Exhibits250: Sepidan Osareh Jonoob Co. - Key offerings
- Exhibits251: SWOT
- Exhibits252: Shaanxi FUJIE Pharmaceutical Co. Ltd. - Overview
- Exhibits253: Shaanxi FUJIE Pharmaceutical Co. Ltd. - Product / Service
- Exhibits254: Shaanxi FUJIE Pharmaceutical Co. Ltd. - Key offerings
- Exhibits255: SWOT
- Exhibits256: Shirin Daru Co. - Overview
- Exhibits257: Shirin Daru Co. - Product / Service
- Exhibits258: Shirin Daru Co. - Key offerings
- Exhibits259: SWOT
- Exhibits260: Zagros Licorice co. - Overview
- Exhibits261: Zagros Licorice co. - Product / Service
- Exhibits262: Zagros Licorice co. - Key offerings
- Exhibits263: SWOT
- Exhibits264: Inclusions checklist
- Exhibits265: Exclusions checklist
- Exhibits266: Currency conversion rates for US$
- Exhibits267: Research methodology
- Exhibits268: Information sources
- Exhibits269: Data validation
- Exhibits270: Validation techniques employed for market sizing
- Exhibits271: Data synthesis
- Exhibits272: 360 degree market analysis
- Exhibits273: List of abbreviations
The liquorice market is forecasted to grow by USD 763.5 mn during 2024-2029, accelerating at a CAGR of 6.4% during the forecast period. The report on the liquorice market provides a holistic analysis, market size and forecast, trends, growth drivers, and challenges, as well as vendor analysis covering around 25 vendors.
The report offers an up-to-date analysis regarding the current market scenario, the latest trends and drivers, and the overall market environment. The market is driven by growing demand for food and beverages with herbal ingredients, growing adoption of herbal medicine, and rising demand for cigars and smoking tobacco products.
| Market Scope | |
|---|---|
| Base Year | 2025 |
| End Year | 2029 |
| Series Year | 2025-2029 |
| Growth Momentum | Accelerate |
| YOY 2025 | 5.6% |
| CAGR | 6.4% |
| Incremental Value | $763.5 mn |
The study was conducted using an objective combination of primary and secondary information including inputs from key participants in the industry. The report contains a comprehensive market size data, segment with regional analysis and vendor landscape in addition to an analysis of the key companies. Reports have historic and forecast data.
Technavio's liquorice market is segmented as below:
By Grade Type
- Food grade
- Feed grade
- Pharmaceutical grade
By Application
- Food and beverages
- Pharmaceuticals
- Tobacco
- Others
By Product Type
- Fruit flavored licorice
- Original black licorice
By Distribution Channel
- Supermarkets
- Online sales
- Convenience stores
By End-user
- Individual consumers
- Industrial users
By Geographical Landscape
- APAC
- Europe
- North America
- Middle East and Africa
- South America
This study identifies the immunity-boosting properties of herbal extracts as one of the prime reasons driving the liquorice market growth during the next few years. Also, growing e-commerce industry and growing research for treatment of cancer using liquorice will lead to sizable demand in the market.
The report on the liquorice market covers the following areas:
- Liquorice Market sizing
- Liquorice Market forecast
- Liquorice Market industry analysis
The robust vendor analysis is designed to help clients improve their market position, and in line with this, this report provides a detailed analysis of several leading liquorice market vendors that include AOS Products Pvt. Ltd., Aushadhi Herbal, Avestia Pharma, Beijing Gingko Group, Botanic Healthcare Group, C.E. Roeper GmbH, Extroil Naturals, F and C Licorice Ltd., Glycyrrhiza Glabra Co. Ltd., HB Natural Ingredients, Herbal Creations, Mafco Worldwide LLC, Maruzen Pharmaceutical Co. Ltd., Norevo GmbH, Nutra Green Biotechnology Co. Ltd., Ransom Naturals Ltd., Sepidan Osareh Jonoob Co., Shaanxi FUJIE Pharmaceutical Co. Ltd., Shirin Daru Co., and Zagros Licorice co.. Also, the liquorice market analysis report includes information on upcoming trends and challenges that will influence market growth. This is to help companies strategize and leverage all forthcoming growth opportunities.
The publisher presents a detailed picture of the market by the way of study, synthesis, and summation of data from multiple sources by an analysis of key parameters such as profit, pricing, competition, and promotions. It presents various market facets by identifying the key industry influencers. The data presented is comprehensive, reliable, and a result of extensive primary and secondary research. The market research reports provide a complete competitive landscape and an in-depth vendor selection methodology and analysis using qualitative and quantitative research to forecast accurate market growth.
Table of Contents
1 Executive Summary
- 1.1 Market overview
- Executive Summary - Chart on Market Overview
- Executive Summary - Data Table on Market Overview
- Executive Summary - Chart on Global Market Characteristics
- Executive Summary - Chart on Market By Geographical Landscape
- Executive Summary - Chart on Market Segmentation by Grade Type
- Executive Summary - Chart on Market Segmentation by Application
- Executive Summary - Chart on Market Segmentation by Product Type
- Executive Summary - Chart on Market Segmentation by Distribution Channel
- Executive Summary - Chart on Market Segmentation by End-user
- Executive Summary - Chart on Incremental Growth
- Executive Summary - Data Table on Incremental Growth
- Executive Summary - Chart on Company Market Positioning
2 Technavio Analysis
- 2.1 Analysis of price sensitivity, lifecycle, customer purchase basket, adoption rates, and purchase criteria
- Analysis of price sensitivity, lifecycle, customer purchase basket, adoption rates, and purchase criteria
- 2.2 Criticality of inputs and Factors of differentiation
- Overview on criticality of inputs and factors of differentiation
- 2.3 Factors of disruption
- Overview on factors of disruption
- 2.4 Impact of drivers and challenges
- Impact of drivers and challenges in 2024 and 2029
3 Market Landscape
- 3.1 Market ecosystem
- Parent Market
- Data Table on - Parent Market
- 3.2 Market characteristics
- Market characteristics analysis
- 3.3 Value chain analysis
- Value chain analysis
4 Market Sizing
- 4.1 Market definition
- Offerings of companies included in the market definition
- 4.2 Market segment analysis
- Market segments
- 4.3 Market size 2024
- 4.4 Market outlook: Forecast for 2024-2029
- Chart on Global - Market size and forecast 2024-2029 ($ million)
- Data Table on Global - Market size and forecast 2024-2029 ($ million)
- Chart on Global Market: Year-over-year growth 2024-2029 (%)
- Data Table on Global Market: Year-over-year growth 2024-2029 (%)
5 Historic Market Size
- 5.1 Global Liquorice Market 2019 - 2023
- Historic Market Size - Data Table on Global Liquorice Market 2019 - 2023 ($ million)
- 5.2 Grade Type segment analysis 2019 - 2023
- Historic Market Size - Grade Type Segment 2019 - 2023 ($ million)
- 5.3 Application segment analysis 2019 - 2023
- Historic Market Size - Application Segment 2019 - 2023 ($ million)
- 5.4 Product Type segment analysis 2019 - 2023
- Historic Market Size - Product Type Segment 2019 - 2023 ($ million)
- 5.5 Distribution Channel segment analysis 2019 - 2023
- Historic Market Size - Distribution Channel Segment 2019 - 2023 ($ million)
- 5.6 End-user segment analysis 2019 - 2023
- Historic Market Size - End-user Segment 2019 - 2023 ($ million)
- 5.7 Geography segment analysis 2019 - 2023
- Historic Market Size - Geography Segment 2019 - 2023 ($ million)
- 5.8 Country segment analysis 2019 - 2023
- Historic Market Size - Country Segment 2019 - 2023 ($ million)
6 Qualitative Analysis
- 6.1 The AI impact on global liquorice market
7 Five Forces Analysis
- 7.1 Five forces summary
- Five forces analysis - Comparison between 2024 and 2029
- 7.2 Bargaining power of buyers
- Bargaining power of buyers - Impact of key factors 2024 and 2029
- 7.3 Bargaining power of suppliers
- Bargaining power of suppliers - Impact of key factors in 2024 and 2029
- 7.4 Threat of new entrants
- Threat of new entrants - Impact of key factors in 2024 and 2029
- 7.5 Threat of substitutes
- Threat of substitutes - Impact of key factors in 2024 and 2029
- 7.6 Threat of rivalry
- Threat of rivalry - Impact of key factors in 2024 and 2029
- 7.7 Market condition
- Chart on Market condition - Five forces 2024 and 2029
8 Market Segmentation by Grade Type
- 8.1 Market segments
- Chart on Grade Type - Market share 2024-2029 (%)
- Data Table on Grade Type - Market share 2024-2029 (%)
- 8.2 Comparison by Grade Type
- Chart on Comparison by Grade Type
- Data Table on Comparison by Grade Type
- 8.3 Food grade - Market size and forecast 2024-2029
- Chart on Food grade - Market size and forecast 2024-2029 ($ million)
- Data Table on Food grade - Market size and forecast 2024-2029 ($ million)
- Chart on Food grade - Year-over-year growth 2024-2029 (%)
- Data Table on Food grade - Year-over-year growth 2024-2029 (%)
- 8.4 Feed grade - Market size and forecast 2024-2029
- Chart on Feed grade - Market size and forecast 2024-2029 ($ million)
- Data Table on Feed grade - Market size and forecast 2024-2029 ($ million)
- Chart on Feed grade - Year-over-year growth 2024-2029 (%)
- Data Table on Feed grade - Year-over-year growth 2024-2029 (%)
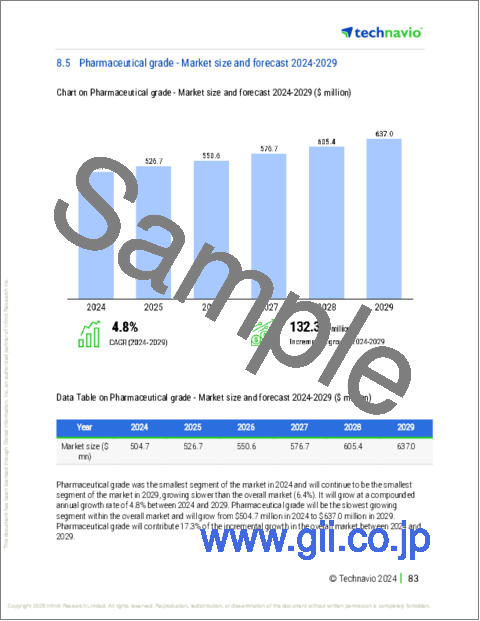
- 8.5 Pharmaceutical grade - Market size and forecast 2024-2029
- Chart on Pharmaceutical grade - Market size and forecast 2024-2029 ($ million)
- Data Table on Pharmaceutical grade - Market size and forecast 2024-2029 ($ million)
- Chart on Pharmaceutical grade - Year-over-year growth 2024-2029 (%)
- Data Table on Pharmaceutical grade - Year-over-year growth 2024-2029 (%)
- 8.6 Market opportunity by Grade Type
- Market opportunity by Grade Type ($ million)
- Data Table on Market opportunity by Grade Type ($ million)
9 Market Segmentation by Application
- 9.1 Market segments
- Chart on Application - Market share 2024-2029 (%)
- Data Table on Application - Market share 2024-2029 (%)
- 9.2 Comparison by Application
- Chart on Comparison by Application
- Data Table on Comparison by Application
- 9.3 Food and beverages - Market size and forecast 2024-2029
- Chart on Food and beverages - Market size and forecast 2024-2029 ($ million)
- Data Table on Food and beverages - Market size and forecast 2024-2029 ($ million)
- Chart on Food and beverages - Year-over-year growth 2024-2029 (%)
- Data Table on Food and beverages - Year-over-year growth 2024-2029 (%)
- 9.4 Pharmaceuticals - Market size and forecast 2024-2029
- Chart on Pharmaceuticals - Market size and forecast 2024-2029 ($ million)
- Data Table on Pharmaceuticals - Market size and forecast 2024-2029 ($ million)
- Chart on Pharmaceuticals - Year-over-year growth 2024-2029 (%)
- Data Table on Pharmaceuticals - Year-over-year growth 2024-2029 (%)
- 9.5 Tobacco - Market size and forecast 2024-2029
- Chart on Tobacco - Market size and forecast 2024-2029 ($ million)
- Data Table on Tobacco - Market size and forecast 2024-2029 ($ million)
- Chart on Tobacco - Year-over-year growth 2024-2029 (%)
- Data Table on Tobacco - Year-over-year growth 2024-2029 (%)
- 9.6 Others - Market size and forecast 2024-2029
- Chart on Others - Market size and forecast 2024-2029 ($ million)
- Data Table on Others - Market size and forecast 2024-2029 ($ million)
- Chart on Others - Year-over-year growth 2024-2029 (%)
- Data Table on Others - Year-over-year growth 2024-2029 (%)
- 9.7 Market opportunity by Application
- Market opportunity by Application ($ million)
- Data Table on Market opportunity by Application ($ million)
10 Market Segmentation by Product Type
- 10.1 Market segments
- Chart on Product Type - Market share 2024-2029 (%)
- Data Table on Product Type - Market share 2024-2029 (%)
- 10.2 Comparison by Product Type
- Chart on Comparison by Product Type
- Data Table on Comparison by Product Type
- 10.3 Fruit flavored licorice - Market size and forecast 2024-2029
- Chart on Fruit flavored licorice - Market size and forecast 2024-2029 ($ million)
- Data Table on Fruit flavored licorice - Market size and forecast 2024-2029 ($ million)
- Chart on Fruit flavored licorice - Year-over-year growth 2024-2029 (%)
- Data Table on Fruit flavored licorice - Year-over-year growth 2024-2029 (%)
- 10.4 Original black licorice - Market size and forecast 2024-2029
- Chart on Original black licorice - Market size and forecast 2024-2029 ($ million)
- Data Table on Original black licorice - Market size and forecast 2024-2029 ($ million)
- Chart on Original black licorice - Year-over-year growth 2024-2029 (%)
- Data Table on Original black licorice - Year-over-year growth 2024-2029 (%)
- 10.5 Market opportunity by Product Type
- Market opportunity by Product Type ($ million)
- Data Table on Market opportunity by Product Type ($ million)
11 Market Segmentation by Distribution Channel
- 11.1 Market segments
- Chart on Distribution Channel - Market share 2024-2029 (%)
- Data Table on Distribution Channel - Market share 2024-2029 (%)
- 11.2 Comparison by Distribution Channel
- Chart on Comparison by Distribution Channel
- Data Table on Comparison by Distribution Channel
- 11.3 Supermarkets - Market size and forecast 2024-2029
- Chart on Supermarkets - Market size and forecast 2024-2029 ($ million)
- Data Table on Supermarkets - Market size and forecast 2024-2029 ($ million)
- Chart on Supermarkets - Year-over-year growth 2024-2029 (%)
- Data Table on Supermarkets - Year-over-year growth 2024-2029 (%)
- 11.4 Online sales - Market size and forecast 2024-2029
- Chart on Online sales - Market size and forecast 2024-2029 ($ million)
- Data Table on Online sales - Market size and forecast 2024-2029 ($ million)
- Chart on Online sales - Year-over-year growth 2024-2029 (%)
- Data Table on Online sales - Year-over-year growth 2024-2029 (%)
- 11.5 Convenience stores - Market size and forecast 2024-2029
- Chart on Convenience stores - Market size and forecast 2024-2029 ($ million)
- Data Table on Convenience stores - Market size and forecast 2024-2029 ($ million)
- Chart on Convenience stores - Year-over-year growth 2024-2029 (%)
- Data Table on Convenience stores - Year-over-year growth 2024-2029 (%)
- 11.6 Market opportunity by Distribution Channel
- Market opportunity by Distribution Channel ($ million)
- Data Table on Market opportunity by Distribution Channel ($ million)
12 Market Segmentation by End-user
- 12.1 Market segments
- Chart on End-user - Market share 2024-2029 (%)
- Data Table on End-user - Market share 2024-2029 (%)
- 12.2 Comparison by End-user
- Chart on Comparison by End-user
- Data Table on Comparison by End-user
- 12.3 Individual consumers - Market size and forecast 2024-2029
- Chart on Individual consumers - Market size and forecast 2024-2029 ($ million)
- Data Table on Individual consumers - Market size and forecast 2024-2029 ($ million)
- Chart on Individual consumers - Year-over-year growth 2024-2029 (%)
- Data Table on Individual consumers - Year-over-year growth 2024-2029 (%)
- 12.4 Industrial users - Market size and forecast 2024-2029
- Chart on Industrial users - Market size and forecast 2024-2029 ($ million)
- Data Table on Industrial users - Market size and forecast 2024-2029 ($ million)
- Chart on Industrial users - Year-over-year growth 2024-2029 (%)
- Data Table on Industrial users - Year-over-year growth 2024-2029 (%)
- 12.5 Market opportunity by End-user
- Market opportunity by End-user ($ million)
- Data Table on Market opportunity by End-user ($ million)
13 Customer Landscape
- 13.1 Customer landscape overview
- Analysis of price sensitivity, lifecycle, customer purchase basket, adoption rates, and purchase criteria
14 Geographic Landscape
- 14.1 Geographic segmentation
- Chart on Market share By Geographical Landscape 2024-2029 (%)
- Data Table on Market share By Geographical Landscape 2024-2029 (%)
- 14.2 Geographic comparison
- Chart on Geographic comparison
- Data Table on Geographic comparison
- 14.3 APAC - Market size and forecast 2024-2029
- Chart on APAC - Market size and forecast 2024-2029 ($ million)
- Data Table on APAC - Market size and forecast 2024-2029 ($ million)
- Chart on APAC - Year-over-year growth 2024-2029 (%)
- Data Table on APAC - Year-over-year growth 2024-2029 (%)
- 14.4 Europe - Market size and forecast 2024-2029
- Chart on Europe - Market size and forecast 2024-2029 ($ million)
- Data Table on Europe - Market size and forecast 2024-2029 ($ million)
- Chart on Europe - Year-over-year growth 2024-2029 (%)
- Data Table on Europe - Year-over-year growth 2024-2029 (%)
- 14.5 North America - Market size and forecast 2024-2029
- Chart on North America - Market size and forecast 2024-2029 ($ million)
- Data Table on North America - Market size and forecast 2024-2029 ($ million)
- Chart on North America - Year-over-year growth 2024-2029 (%)
- Data Table on North America - Year-over-year growth 2024-2029 (%)
- 14.6 Middle East and Africa - Market size and forecast 2024-2029
- Chart on Middle East and Africa - Market size and forecast 2024-2029 ($ million)
- Data Table on Middle East and Africa - Market size and forecast 2024-2029 ($ million)
- Chart on Middle East and Africa - Year-over-year growth 2024-2029 (%)
- Data Table on Middle East and Africa - Year-over-year growth 2024-2029 (%)
- 14.7 South America - Market size and forecast 2024-2029
- Chart on South America - Market size and forecast 2024-2029 ($ million)
- Data Table on South America - Market size and forecast 2024-2029 ($ million)
- Chart on South America - Year-over-year growth 2024-2029 (%)
- Data Table on South America - Year-over-year growth 2024-2029 (%)
- 14.8 US - Market size and forecast 2024-2029
- Chart on US - Market size and forecast 2024-2029 ($ million)
- Data Table on US - Market size and forecast 2024-2029 ($ million)
- Chart on US - Year-over-year growth 2024-2029 (%)
- Data Table on US - Year-over-year growth 2024-2029 (%)
- 14.9 China - Market size and forecast 2024-2029
- Chart on China - Market size and forecast 2024-2029 ($ million)
- Data Table on China - Market size and forecast 2024-2029 ($ million)
- Chart on China - Year-over-year growth 2024-2029 (%)
- Data Table on China - Year-over-year growth 2024-2029 (%)
- 14.10 Germany - Market size and forecast 2024-2029
- Chart on Germany - Market size and forecast 2024-2029 ($ million)
- Data Table on Germany - Market size and forecast 2024-2029 ($ million)
- Chart on Germany - Year-over-year growth 2024-2029 (%)
- Data Table on Germany - Year-over-year growth 2024-2029 (%)
- 14.11 Japan - Market size and forecast 2024-2029
- Chart on Japan - Market size and forecast 2024-2029 ($ million)
- Data Table on Japan - Market size and forecast 2024-2029 ($ million)
- Chart on Japan - Year-over-year growth 2024-2029 (%)
- Data Table on Japan - Year-over-year growth 2024-2029 (%)
- 14.12 India - Market size and forecast 2024-2029
- Chart on India - Market size and forecast 2024-2029 ($ million)
- Data Table on India - Market size and forecast 2024-2029 ($ million)
- Chart on India - Year-over-year growth 2024-2029 (%)
- Data Table on India - Year-over-year growth 2024-2029 (%)
- 14.13 UK - Market size and forecast 2024-2029
- Chart on UK - Market size and forecast 2024-2029 ($ million)
- Data Table on UK - Market size and forecast 2024-2029 ($ million)
- Chart on UK - Year-over-year growth 2024-2029 (%)
- Data Table on UK - Year-over-year growth 2024-2029 (%)
- 14.14 South Korea - Market size and forecast 2024-2029
- Chart on South Korea - Market size and forecast 2024-2029 ($ million)
- Data Table on South Korea - Market size and forecast 2024-2029 ($ million)
- Chart on South Korea - Year-over-year growth 2024-2029 (%)
- Data Table on South Korea - Year-over-year growth 2024-2029 (%)
- 14.15 France - Market size and forecast 2024-2029
- Chart on France - Market size and forecast 2024-2029 ($ million)
- Data Table on France - Market size and forecast 2024-2029 ($ million)
- Chart on France - Year-over-year growth 2024-2029 (%)
- Data Table on France - Year-over-year growth 2024-2029 (%)
- 14.16 Italy - Market size and forecast 2024-2029
- Chart on Italy - Market size and forecast 2024-2029 ($ million)
- Data Table on Italy - Market size and forecast 2024-2029 ($ million)
- Chart on Italy - Year-over-year growth 2024-2029 (%)
- Data Table on Italy - Year-over-year growth 2024-2029 (%)
- 14.17 Canada - Market size and forecast 2024-2029
- Chart on Canada - Market size and forecast 2024-2029 ($ million)
- Data Table on Canada - Market size and forecast 2024-2029 ($ million)
- Chart on Canada - Year-over-year growth 2024-2029 (%)
- Data Table on Canada - Year-over-year growth 2024-2029 (%)
- 14.18 Market opportunity By Geographical Landscape
- Market opportunity By Geographical Landscape ($ million)
- Data Tables on Market opportunity By Geographical Landscape ($ million)
15 Drivers, Challenges, and Opportunity/Restraints
- 15.1 Market drivers
- 15.2 Market challenges
- 15.3 Impact of drivers and challenges
- Impact of drivers and challenges in 2024 and 2029
- 15.4 Market opportunities/restraints
16 Competitive Landscape
- 16.1 Overview
- 16.2 Competitive Landscape
- Overview on criticality of inputs and factors of differentiation
- 16.3 Landscape disruption
- Overview on factors of disruption
- 16.4 Industry risks
- Impact of key risks on business
17 Competitive Analysis
- 17.1 Companies profiled
- Companies covered
- 17.2 Company ranking index
- Company ranking index
- 17.3 Market positioning of companies
- Matrix on companies position and classification
- 17.4 Beijing Gingko Group
- Beijing Gingko Group - Overview
- Beijing Gingko Group - Product / Service
- Beijing Gingko Group - Key news
- Beijing Gingko Group - Key offerings
- SWOT
- 17.5 Botanic Healthcare Group
- Botanic Healthcare Group - Overview
- Botanic Healthcare Group - Product / Service
- Botanic Healthcare Group - Key offerings
- SWOT
- 17.6 C.E. Roeper GmbH
- C.E. Roeper GmbH - Overview
- C.E. Roeper GmbH - Product / Service
- C.E. Roeper GmbH - Key offerings
- SWOT
- 17.7 F and C Licorice Ltd.
- F and C Licorice Ltd. - Overview
- F and C Licorice Ltd. - Product / Service
- F and C Licorice Ltd. - Key offerings
- SWOT
- 17.8 Glycyrrhiza Glabra Co. Ltd.
- Glycyrrhiza Glabra Co. Ltd. - Overview
- Glycyrrhiza Glabra Co. Ltd. - Product / Service
- Glycyrrhiza Glabra Co. Ltd. - Key offerings
- SWOT
- 17.9 HB Natural Ingredients
- HB Natural Ingredients - Overview
- HB Natural Ingredients - Product / Service
- HB Natural Ingredients - Key offerings
- SWOT
- 17.10 Mafco Worldwide LLC
- Mafco Worldwide LLC - Overview
- Mafco Worldwide LLC - Product / Service
- Mafco Worldwide LLC - Key offerings
- SWOT
- 17.11 Maruzen Pharmaceutical Co. Ltd.
- Maruzen Pharmaceutical Co. Ltd. - Overview
- Maruzen Pharmaceutical Co. Ltd. - Product / Service
- Maruzen Pharmaceutical Co. Ltd. - Key news
- Maruzen Pharmaceutical Co. Ltd. - Key offerings
- SWOT
- 17.12 Norevo GmbH
- Norevo GmbH - Overview
- Norevo GmbH - Product / Service
- Norevo GmbH - Key offerings
- SWOT
- 17.13 Nutra Green Biotechnology Co. Ltd.
- Nutra Green Biotechnology Co. Ltd. - Overview
- Nutra Green Biotechnology Co. Ltd. - Product / Service
- Nutra Green Biotechnology Co. Ltd. - Key offerings
- SWOT
- 17.14 Ransom Naturals Ltd.
- Ransom Naturals Ltd. - Overview
- Ransom Naturals Ltd. - Product / Service
- Ransom Naturals Ltd. - Key offerings
- SWOT
- 17.15 Sepidan Osareh Jonoob Co.
- Sepidan Osareh Jonoob Co. - Overview
- Sepidan Osareh Jonoob Co. - Product / Service
- Sepidan Osareh Jonoob Co. - Key offerings
- SWOT
- 17.16 Shaanxi FUJIE Pharmaceutical Co. Ltd.
- Shaanxi FUJIE Pharmaceutical Co. Ltd. - Overview
- Shaanxi FUJIE Pharmaceutical Co. Ltd. - Product / Service
- Shaanxi FUJIE Pharmaceutical Co. Ltd. - Key offerings
- SWOT
- 17.17 Shirin Daru Co.
- Shirin Daru Co. - Overview
- Shirin Daru Co. - Product / Service
- Shirin Daru Co. - Key offerings
- SWOT
- 17.18 Zagros Licorice co.
- Zagros Licorice co. - Overview
- Zagros Licorice co. - Product / Service
- Zagros Licorice co. - Key offerings
- SWOT
18 Appendix
- 18.1 Scope of the report
- 18.2 Inclusions and exclusions checklist
- Inclusions checklist
- Exclusions checklist
- 18.3 Currency conversion rates for US$
- Currency conversion rates for US$
- 18.4 Research methodology
- Research methodology
- 18.5 Data procurement
- Information sources
- 18.6 Data validation
- Data validation
- 18.7 Validation techniques employed for market sizing
- Validation techniques employed for market sizing
- 18.8 Data synthesis
- Data synthesis
- 18.9 360 degree market analysis
- 360 degree market analysis
- 18.10 List of abbreviations
- List of abbreviations

