|
|
市場調査レポート
商品コード
1557540
インタラクティブホワイトボードの世界市場 2024-2028Global Interactive Whiteboard Market 2024-2028 |
||||||
|
|||||||
カスタマイズ可能
|
|||||||


| インタラクティブホワイトボードの世界市場 2024-2028 |
|
出版日: 2024年08月15日
発行: TechNavio
ページ情報: 英文 169 Pages
納期: 即納可能
|

全表示
- 概要
- 図表
- 目次
インタラクティブホワイトボード市場は2023-2028年に7億4,920万米ドル、予測期間中のCAGRは6.78%で成長すると予測されます。
当レポートでは、インタラクティブホワイトボード市場の全体的な分析、市場規模・予測、動向、成長促進要因、課題、約25のベンダーを網羅したベンダー分析などを掲載しています。
現在の市場シナリオ、最新動向と促進要因、市場環境全体に関する最新分析を提供しています。同市場は、教育分野での先端技術利用の増加、従来のホワイトボードからデジタルホワイトボードへの転換、スマートフォンの普及とインターネットへのアクセスの向上などが牽引しています。
| 市場範囲 | |
|---|---|
| 基準年 | 2024 |
| 終了年 | 2028 |
| 予測期間 | 2024-2028 |
| 成長モメンタム | 加速 |
| 前年比2024年 | 6.24% |
| CAGR | 6.78% |
| 増分額 | 7億4,920万米ドル |
本調査では、今後数年間のインタラクティブホワイトボード市場の成長を促進する主な要因の1つとして、ゲーミフィケーションの採用増加を挙げています。また、デジタル化の進展、電子製品の高い普及率、デジタル教育に対する政府の取り組みも、市場の大きな需要につながります。
目次
第1章 エグゼクティブサマリー
- 市場概要
第2章 市場情勢
- 市場エコシステム
- 市場の特徴
- バリューチェーン分析
第3章 市場規模の評価
- 市場の定義
- 市場セグメント分析
- 市場規模 2023
- 市場の見通し 2023-2028
第4章 市場規模実績
- インタラクティブホワイトボードの世界市場 2018-2022
- エンドユーザー別セグメント分析 2018-2022
- 技術別セグメント分析 2018-2022
- 地域別セグメント分析 2018-2022
- 国別セグメント分析 2018-2022
第5章 ファイブフォース分析
- ファイブフォースの要約
- 買い手の交渉力
- 供給企業の交渉力
- 新規参入業者の脅威
- 代替品の脅威
- 競争の脅威
- 市況
第6章 市場セグメンテーション:エンドユーザー別
- 市場セグメンテーション
- 比較:エンドユーザー別
- 教育分野:市場規模と予測 2023-2028
- 企業部門:市場規模と予測 2023-2028
- 市場機会:エンドユーザー別
第7章 市場セグメンテーション:技術別
- 市場セグメンテーション
- 比較:技術別
- 抵抗性:市場規模と予測 2023-2028
- 静電容量式:市場規模と予測 2023-2028
- 赤外線:市場規模と予測 2023-2028
- 電磁ペン:市場規模と予測 2023-2028
- その他:市場規模と予測 2023-2028
- 市場機会:技術別
第8章 顧客情勢
- 顧客情勢の概要
第9章 地域別情勢
- 地域別セグメンテーション
- 地域別比較
- 北米:市場規模と予測 2023-2028
- 欧州:市場規模と予測 2023-2028
- アジア太平洋:市場規模と予測 2023-2028
- 南米:市場規模と予測 2023-2028
- 中東・アフリカ:市場規模と予測 2023-2028
- 米国:市場規模と予測 2023-2028
- 英国:市場規模と予測 2023-2028
- 中国:市場規模と予測 2023-2028
- 日本:市場規模と予測 2023-2028
- ドイツ:市場規模と予測 2023-2028
- 市場機会:地域情勢別
第10章 促進要因・課題・機会・抑制要因
- 市場促進要因
- 市場の課題
- 促進要因と課題の影響
- 市場の機会・抑制要因
第11章 競合情勢
- 概要
- 競合情勢
- 混乱の状況
- 業界のリスク
第12章 競合分析
- 企業プロファイル
- 企業の市場ポジショニング
- Alphabet Inc.
- Boxlight Corp
- Cisco Systems Inc.
- Hitachi Ltd.
- Leyard Group
- LG Electronics Inc.
- Microsoft Corp.
- Panasonic Holdings Corp.
- Promethean World Ltd.
- Qisda Corp.
- Ricoh Co. Ltd.
- Samsung Electronics Co. Ltd.
- Sharp NEC Display Solutions of America Inc.
- SMART Technologies ULC
- ViewSonic Corp.
第13章 付録
Exhibits:
- Exhibits1: Executive Summary - Chart on Market Overview
- Exhibits2: Executive Summary - Data Table on Market Overview
- Exhibits3: Executive Summary - Chart on Global Market Characteristics
- Exhibits4: Executive Summary - Chart on Market By Geographical Landscape
- Exhibits5: Executive Summary - Chart on Market Segmentation by End-user
- Exhibits6: Executive Summary - Chart on Market Segmentation by Technology
- Exhibits7: Executive Summary - Chart on Incremental Growth
- Exhibits8: Executive Summary - Data Table on Incremental Growth
- Exhibits9: Executive Summary - Chart on Company Market Positioning
- Exhibits10: Parent Market
- Exhibits11: Data Table on - Parent Market
- Exhibits12: Market characteristics analysis
- Exhibits13: Value Chain Analysis
- Exhibits14: Offerings of companies included in the market definition
- Exhibits15: Market segments
- Exhibits16: Chart on Global - Market size and forecast 2023-2028 ($ million)
- Exhibits17: Data Table on Global - Market size and forecast 2023-2028 ($ million)
- Exhibits18: Chart on Global Market: Year-over-year growth 2023-2028 (%)
- Exhibits19: Data Table on Global Market: Year-over-year growth 2023-2028 (%)
- Exhibits20: Historic Market Size - Data Table on Global Interactive Whiteboard Market 2018 - 2022 ($ million)
- Exhibits21: Historic Market Size - End-user Segment 2018 - 2022 ($ million)
- Exhibits22: Historic Market Size - Technology Segment 2018 - 2022 ($ million)
- Exhibits23: Historic Market Size - Geography Segment 2018 - 2022 ($ million)
- Exhibits24: Historic Market Size - Country Segment 2018 - 2022 ($ million)
- Exhibits25: Five forces analysis - Comparison between 2023 and 2028
- Exhibits26: Bargaining power of buyers - Impact of key factors 2023 and 2028
- Exhibits27: Bargaining power of suppliers - Impact of key factors in 2023 and 2028
- Exhibits28: Threat of new entrants - Impact of key factors in 2023 and 2028
- Exhibits29: Threat of substitutes - Impact of key factors in 2023 and 2028
- Exhibits30: Threat of rivalry - Impact of key factors in 2023 and 2028
- Exhibits31: Chart on Market condition - Five forces 2023 and 2028
- Exhibits32: Chart on End-user - Market share 2023-2028 (%)
- Exhibits33: Data Table on End-user - Market share 2023-2028 (%)
- Exhibits34: Chart on Comparison by End-user
- Exhibits35: Data Table on Comparison by End-user
- Exhibits36: Chart on Education sector - Market size and forecast 2023-2028 ($ million)
- Exhibits37: Data Table on Education sector - Market size and forecast 2023-2028 ($ million)
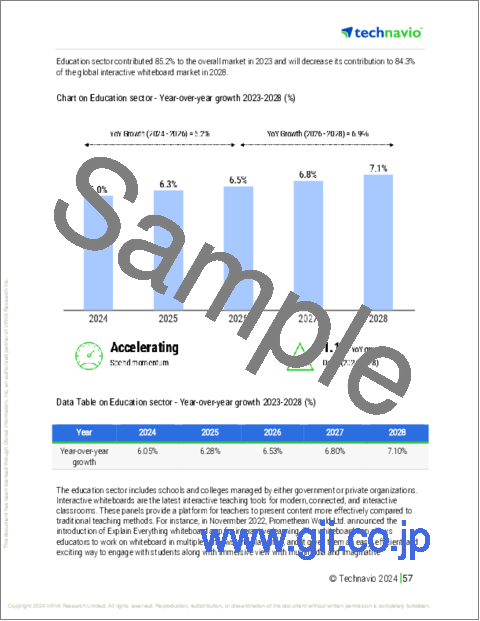
- Exhibits38: Chart on Education sector - Year-over-year growth 2023-2028 (%)
- Exhibits39: Data Table on Education sector - Year-over-year growth 2023-2028 (%)
- Exhibits40: Chart on Corporate sector - Market size and forecast 2023-2028 ($ million)
- Exhibits41: Data Table on Corporate sector - Market size and forecast 2023-2028 ($ million)
- Exhibits42: Chart on Corporate sector - Year-over-year growth 2023-2028 (%)
- Exhibits43: Data Table on Corporate sector - Year-over-year growth 2023-2028 (%)
- Exhibits44: Market opportunity by End-user ($ million)
- Exhibits45: Data Table on Market opportunity by End-user ($ million)
- Exhibits46: Chart on Technology - Market share 2023-2028 (%)
- Exhibits47: Data Table on Technology - Market share 2023-2028 (%)
- Exhibits48: Chart on Comparison by Technology
- Exhibits49: Data Table on Comparison by Technology
- Exhibits50: Chart on Resistive - Market size and forecast 2023-2028 ($ million)
- Exhibits51: Data Table on Resistive - Market size and forecast 2023-2028 ($ million)
- Exhibits52: Chart on Resistive - Year-over-year growth 2023-2028 (%)
- Exhibits53: Data Table on Resistive - Year-over-year growth 2023-2028 (%)
- Exhibits54: Chart on Capacitive - Market size and forecast 2023-2028 ($ million)
- Exhibits55: Data Table on Capacitive - Market size and forecast 2023-2028 ($ million)
- Exhibits56: Chart on Capacitive - Year-over-year growth 2023-2028 (%)
- Exhibits57: Data Table on Capacitive - Year-over-year growth 2023-2028 (%)
- Exhibits58: Chart on Infrared - Market size and forecast 2023-2028 ($ million)
- Exhibits59: Data Table on Infrared - Market size and forecast 2023-2028 ($ million)
- Exhibits60: Chart on Infrared - Year-over-year growth 2023-2028 (%)
- Exhibits61: Data Table on Infrared - Year-over-year growth 2023-2028 (%)
- Exhibits62: Chart on Electromagnetic pen - Market size and forecast 2023-2028 ($ million)
- Exhibits63: Data Table on Electromagnetic pen - Market size and forecast 2023-2028 ($ million)
- Exhibits64: Chart on Electromagnetic pen - Year-over-year growth 2023-2028 (%)
- Exhibits65: Data Table on Electromagnetic pen - Year-over-year growth 2023-2028 (%)
- Exhibits66: Chart on Others - Market size and forecast 2023-2028 ($ million)
- Exhibits67: Data Table on Others - Market size and forecast 2023-2028 ($ million)
- Exhibits68: Chart on Others - Year-over-year growth 2023-2028 (%)
- Exhibits69: Data Table on Others - Year-over-year growth 2023-2028 (%)
- Exhibits70: Market opportunity by Technology ($ million)
- Exhibits71: Data Table on Market opportunity by Technology ($ million)
- Exhibits72: Analysis of price sensitivity, lifecycle, customer purchase basket, adoption rates, and purchase criteria
- Exhibits73: Chart on Market share By Geographical Landscape 2023-2028 (%)
- Exhibits74: Data Table on Market share By Geographical Landscape 2023-2028 (%)
- Exhibits75: Chart on Geographic comparison
- Exhibits76: Data Table on Geographic comparison
- Exhibits77: Chart on North America - Market size and forecast 2023-2028 ($ million)
- Exhibits78: Data Table on North America - Market size and forecast 2023-2028 ($ million)
- Exhibits79: Chart on North America - Year-over-year growth 2023-2028 (%)
- Exhibits80: Data Table on North America - Year-over-year growth 2023-2028 (%)
- Exhibits81: Chart on Europe - Market size and forecast 2023-2028 ($ million)
- Exhibits82: Data Table on Europe - Market size and forecast 2023-2028 ($ million)
- Exhibits83: Chart on Europe - Year-over-year growth 2023-2028 (%)
- Exhibits84: Data Table on Europe - Year-over-year growth 2023-2028 (%)
- Exhibits85: Chart on APAC - Market size and forecast 2023-2028 ($ million)
- Exhibits86: Data Table on APAC - Market size and forecast 2023-2028 ($ million)
- Exhibits87: Chart on APAC - Year-over-year growth 2023-2028 (%)
- Exhibits88: Data Table on APAC - Year-over-year growth 2023-2028 (%)
- Exhibits89: Chart on South America - Market size and forecast 2023-2028 ($ million)
- Exhibits90: Data Table on South America - Market size and forecast 2023-2028 ($ million)
- Exhibits91: Chart on South America - Year-over-year growth 2023-2028 (%)
- Exhibits92: Data Table on South America - Year-over-year growth 2023-2028 (%)
- Exhibits93: Chart on Middle East and Africa - Market size and forecast 2023-2028 ($ million)
- Exhibits94: Data Table on Middle East and Africa - Market size and forecast 2023-2028 ($ million)
- Exhibits95: Chart on Middle East and Africa - Year-over-year growth 2023-2028 (%)
- Exhibits96: Data Table on Middle East and Africa - Year-over-year growth 2023-2028 (%)
- Exhibits97: Chart on US - Market size and forecast 2023-2028 ($ million)
- Exhibits98: Data Table on US - Market size and forecast 2023-2028 ($ million)
- Exhibits99: Chart on US - Year-over-year growth 2023-2028 (%)
- Exhibits100: Data Table on US - Year-over-year growth 2023-2028 (%)
- Exhibits101: Chart on UK - Market size and forecast 2023-2028 ($ million)
- Exhibits102: Data Table on UK - Market size and forecast 2023-2028 ($ million)
- Exhibits103: Chart on UK - Year-over-year growth 2023-2028 (%)
- Exhibits104: Data Table on UK - Year-over-year growth 2023-2028 (%)
- Exhibits105: Chart on China - Market size and forecast 2023-2028 ($ million)
- Exhibits106: Data Table on China - Market size and forecast 2023-2028 ($ million)
- Exhibits107: Chart on China - Year-over-year growth 2023-2028 (%)
- Exhibits108: Data Table on China - Year-over-year growth 2023-2028 (%)
- Exhibits109: Chart on Japan - Market size and forecast 2023-2028 ($ million)
- Exhibits110: Data Table on Japan - Market size and forecast 2023-2028 ($ million)
- Exhibits111: Chart on Japan - Year-over-year growth 2023-2028 (%)
- Exhibits112: Data Table on Japan - Year-over-year growth 2023-2028 (%)
- Exhibits113: Chart on Germany - Market size and forecast 2023-2028 ($ million)
- Exhibits114: Data Table on Germany - Market size and forecast 2023-2028 ($ million)
- Exhibits115: Chart on Germany - Year-over-year growth 2023-2028 (%)
- Exhibits116: Data Table on Germany - Year-over-year growth 2023-2028 (%)
- Exhibits117: Market opportunity By Geographical Landscape ($ million)
- Exhibits118: Data Tables on Market opportunity By Geographical Landscape ($ million)
- Exhibits119: Impact of drivers and challenges in 2023 and 2028
- Exhibits120: Overview on criticality of inputs and factors of differentiation
- Exhibits121: Overview on factors of disruption
- Exhibits122: Impact of key risks on business
- Exhibits123: Companies covered
- Exhibits124: Matrix on companies position and classification
- Exhibits125: Alphabet Inc. - Overview
- Exhibits126: Alphabet Inc. - Business segments
- Exhibits127: Alphabet Inc. - Key offerings
- Exhibits128: Alphabet Inc. - Segment focus
- Exhibits129: Boxlight Corp - Overview
- Exhibits130: Boxlight Corp - Product / Service
- Exhibits131: Boxlight Corp - Key news
- Exhibits132: Boxlight Corp - Key offerings
- Exhibits133: Cisco Systems Inc. - Overview
- Exhibits134: Cisco Systems Inc. - Business segments
- Exhibits135: Cisco Systems Inc. - Key news
- Exhibits136: Cisco Systems Inc. - Key offerings
- Exhibits137: Cisco Systems Inc. - Segment focus
- Exhibits138: Hitachi Ltd. - Overview
- Exhibits139: Hitachi Ltd. - Business segments
- Exhibits140: Hitachi Ltd. - Key news
- Exhibits141: Hitachi Ltd. - Key offerings
- Exhibits142: Hitachi Ltd. - Segment focus
- Exhibits143: Leyard Group - Overview
- Exhibits144: Leyard Group - Business segments
- Exhibits145: Leyard Group - Key offerings
- Exhibits146: Leyard Group - Segment focus
- Exhibits147: LG Electronics Inc. - Overview
- Exhibits148: LG Electronics Inc. - Product / Service
- Exhibits149: LG Electronics Inc. - Key news
- Exhibits150: LG Electronics Inc. - Key offerings
- Exhibits151: Microsoft Corp. - Overview
- Exhibits152: Microsoft Corp. - Business segments
- Exhibits153: Microsoft Corp. - Key news
- Exhibits154: Microsoft Corp. - Key offerings
- Exhibits155: Microsoft Corp. - Segment focus
- Exhibits156: Panasonic Holdings Corp. - Overview
- Exhibits157: Panasonic Holdings Corp. - Business segments
- Exhibits158: Panasonic Holdings Corp. - Key news
- Exhibits159: Panasonic Holdings Corp. - Key offerings
- Exhibits160: Panasonic Holdings Corp. - Segment focus
- Exhibits161: Promethean World Ltd. - Overview
- Exhibits162: Promethean World Ltd. - Product / Service
- Exhibits163: Promethean World Ltd. - Key offerings
- Exhibits164: Qisda Corp. - Overview
- Exhibits165: Qisda Corp. - Product / Service
- Exhibits166: Qisda Corp. - Key offerings
- Exhibits167: Ricoh Co. Ltd. - Overview
- Exhibits168: Ricoh Co. Ltd. - Business segments
- Exhibits169: Ricoh Co. Ltd. - Key news
- Exhibits170: Ricoh Co. Ltd. - Key offerings
- Exhibits171: Ricoh Co. Ltd. - Segment focus
- Exhibits172: Samsung Electronics Co. Ltd. - Overview
- Exhibits173: Samsung Electronics Co. Ltd. - Business segments
- Exhibits174: Samsung Electronics Co. Ltd. - Key news
- Exhibits175: Samsung Electronics Co. Ltd. - Key offerings
- Exhibits176: Samsung Electronics Co. Ltd. - Segment focus
- Exhibits177: Sharp NEC Display Solutions of America Inc. - Overview
- Exhibits178: Sharp NEC Display Solutions of America Inc. - Product / Service
- Exhibits179: Sharp NEC Display Solutions of America Inc. - Key offerings
- Exhibits180: SMART Technologies ULC - Overview
- Exhibits181: SMART Technologies ULC - Product / Service
- Exhibits182: SMART Technologies ULC - Key offerings
- Exhibits183: ViewSonic Corp. - Overview
- Exhibits184: ViewSonic Corp. - Product / Service
- Exhibits185: ViewSonic Corp. - Key offerings
- Exhibits186: Inclusions checklist
- Exhibits187: Exclusions checklist
- Exhibits188: Currency conversion rates for US$
- Exhibits189: Research methodology
- Exhibits190: Information sources
- Exhibits191: Data validation
- Exhibits192: Validation techniques employed for market sizing
- Exhibits193: Data synthesis
- Exhibits194: 360 degree market analysis
- Exhibits195: List of abbreviations
The interactive whiteboard market is forecasted to grow by USD 749.2 mn during 2023-2028, accelerating at a CAGR of 6.78% during the forecast period. The report on the interactive whiteboard market provides a holistic analysis, market size and forecast, trends, growth drivers, and challenges, as well as vendor analysis covering around 25 vendors.
The report offers an up-to-date analysis regarding the current market scenario, the latest trends and drivers, and the overall market environment. The market is driven by increasing use of advanced technologies in education sector, transformation of traditional whiteboard into digital whiteboard, and rising adoption of smartphones and better access to internet.
Technavio's interactive whiteboard market is segmented as below:
| Market Scope | |
|---|---|
| Base Year | 2024 |
| End Year | 2028 |
| Series Year | 2024-2028 |
| Growth Momentum | Accelerate |
| YOY 2024 | 6.24% |
| CAGR | 6.78% |
| Incremental Value | $749.2 mn |
By End-user
- Education sector
- Corporate sector
By Technology
- Resistive
- Capacitive
- Infrared
- Electromagnetic pen
- Others
By Geographical Landscape
- North America
- Europe
- APAC
- South America
- Middle East and Africa
This study identifies the increased adoption of gamification as one of the prime reasons driving the interactive whiteboard market growth during the next few years. Also, growth in digitalization and high adoption of electronic products and government initiatives for digital education will lead to sizable demand in the market.
The report on the interactive whiteboard market covers the following areas:
- Interactive whiteboard market sizing
- Interactive whiteboard market forecast
- Interactive whiteboard market industry analysis
The robust vendor analysis is designed to help clients improve their market position, and in line with this, this report provides a detailed analysis of several leading interactive whiteboard market vendors that include Alphabet Inc., Boxlight Corp, Cisco Systems Inc., Delta Electronics Inc., Genee World Ltd, Hitachi Ltd., Leyard Group, LG Electronics Inc., Microsoft Corp., Newline Interactive Inc., Panasonic Holdings Corp., Promethean World Ltd., Qisda Corp., Ricoh Co. Ltd., Samsung Electronics Co. Ltd., Seiko Epson Corp., Sharp NEC Display Solutions of America Inc., SMART Technologies ULC, Steelcase Inc., and ViewSonic Corp.. Also, the interactive whiteboard market analysis report includes information on upcoming trends and challenges that will influence market growth. This is to help companies strategize and leverage all forthcoming growth opportunities.
The study was conducted using an objective combination of primary and secondary information including inputs from key participants in the industry. The report contains a comprehensive market and vendor landscape in addition to an analysis of the key vendors.
The publisher presents a detailed picture of the market by the way of study, synthesis, and summation of data from multiple sources by an analysis of key parameters such as profit, pricing, competition, and promotions. It presents various market facets by identifying the key industry influencers. The data presented is comprehensive, reliable, and a result of extensive research - both primary and secondary. The market research reports provide a complete competitive landscape and an in-depth vendor selection methodology and analysis using qualitative and quantitative research to forecast the accurate market growth.
Table of Contents
1 Executive Summary
- 1.1 Market overview
- Executive Summary - Chart on Market Overview
- Executive Summary - Data Table on Market Overview
- Executive Summary - Chart on Global Market Characteristics
- Executive Summary - Chart on Market By Geographical Landscape
- Executive Summary - Chart on Market Segmentation by End-user
- Executive Summary - Chart on Market Segmentation by Technology
- Executive Summary - Chart on Incremental Growth
- Executive Summary - Data Table on Incremental Growth
- Executive Summary - Chart on Company Market Positioning
2 Market Landscape
- 2.1 Market ecosystem
- Parent Market
- Data Table on - Parent Market
- 2.2 Market characteristics
- Market characteristics analysis
- 2.3 Value chain analysis
- Value Chain Analysis
3 Market Sizing
- 3.1 Market definition
- Offerings of companies included in the market definition
- 3.2 Market segment analysis
- Market segments
- 3.3 Market size 2023
- 3.4 Market outlook: Forecast for 2023-2028
- Chart on Global - Market size and forecast 2023-2028 ($ million)
- Data Table on Global - Market size and forecast 2023-2028 ($ million)
- Chart on Global Market: Year-over-year growth 2023-2028 (%)
- Data Table on Global Market: Year-over-year growth 2023-2028 (%)
4 Historic Market Size
- 4.1 Global Interactive Whiteboard Market 2018 - 2022
- Historic Market Size - Data Table on Global Interactive Whiteboard Market 2018 - 2022 ($ million)
- 4.2 End-user segment analysis 2018 - 2022
- Historic Market Size - End-user Segment 2018 - 2022 ($ million)
- 4.3 Technology segment analysis 2018 - 2022
- Historic Market Size - Technology Segment 2018 - 2022 ($ million)
- 4.4 Geography segment analysis 2018 - 2022
- Historic Market Size - Geography Segment 2018 - 2022 ($ million)
- 4.5 Country segment analysis 2018 - 2022
- Historic Market Size - Country Segment 2018 - 2022 ($ million)
5 Five Forces Analysis
- 5.1 Five forces summary
- Five forces analysis - Comparison between 2023 and 2028
- 5.2 Bargaining power of buyers
- Bargaining power of buyers - Impact of key factors 2023 and 2028
- 5.3 Bargaining power of suppliers
- Bargaining power of suppliers - Impact of key factors in 2023 and 2028
- 5.4 Threat of new entrants
- Threat of new entrants - Impact of key factors in 2023 and 2028
- 5.5 Threat of substitutes
- Threat of substitutes - Impact of key factors in 2023 and 2028
- 5.6 Threat of rivalry
- Threat of rivalry - Impact of key factors in 2023 and 2028
- 5.7 Market condition
- Chart on Market condition - Five forces 2023 and 2028
6 Market Segmentation by End-user
- 6.1 Market segments
- Chart on End-user - Market share 2023-2028 (%)
- Data Table on End-user - Market share 2023-2028 (%)
- 6.2 Comparison by End-user
- Chart on Comparison by End-user
- Data Table on Comparison by End-user
- 6.3 Education sector - Market size and forecast 2023-2028
- Chart on Education sector - Market size and forecast 2023-2028 ($ million)
- Data Table on Education sector - Market size and forecast 2023-2028 ($ million)
- Chart on Education sector - Year-over-year growth 2023-2028 (%)
- Data Table on Education sector - Year-over-year growth 2023-2028 (%)
- 6.4 Corporate sector - Market size and forecast 2023-2028
- Chart on Corporate sector - Market size and forecast 2023-2028 ($ million)
- Data Table on Corporate sector - Market size and forecast 2023-2028 ($ million)
- Chart on Corporate sector - Year-over-year growth 2023-2028 (%)
- Data Table on Corporate sector - Year-over-year growth 2023-2028 (%)
- 6.5 Market opportunity by End-user
- Market opportunity by End-user ($ million)
- Data Table on Market opportunity by End-user ($ million)
7 Market Segmentation by Technology
- 7.1 Market segments
- Chart on Technology - Market share 2023-2028 (%)
- Data Table on Technology - Market share 2023-2028 (%)
- 7.2 Comparison by Technology
- Chart on Comparison by Technology
- Data Table on Comparison by Technology
- 7.3 Resistive - Market size and forecast 2023-2028
- Chart on Resistive - Market size and forecast 2023-2028 ($ million)
- Data Table on Resistive - Market size and forecast 2023-2028 ($ million)
- Chart on Resistive - Year-over-year growth 2023-2028 (%)
- Data Table on Resistive - Year-over-year growth 2023-2028 (%)
- 7.4 Capacitive - Market size and forecast 2023-2028
- Chart on Capacitive - Market size and forecast 2023-2028 ($ million)
- Data Table on Capacitive - Market size and forecast 2023-2028 ($ million)
- Chart on Capacitive - Year-over-year growth 2023-2028 (%)
- Data Table on Capacitive - Year-over-year growth 2023-2028 (%)
- 7.5 Infrared - Market size and forecast 2023-2028
- Chart on Infrared - Market size and forecast 2023-2028 ($ million)
- Data Table on Infrared - Market size and forecast 2023-2028 ($ million)
- Chart on Infrared - Year-over-year growth 2023-2028 (%)
- Data Table on Infrared - Year-over-year growth 2023-2028 (%)
- 7.6 Electromagnetic pen - Market size and forecast 2023-2028
- Chart on Electromagnetic pen - Market size and forecast 2023-2028 ($ million)
- Data Table on Electromagnetic pen - Market size and forecast 2023-2028 ($ million)
- Chart on Electromagnetic pen - Year-over-year growth 2023-2028 (%)
- Data Table on Electromagnetic pen - Year-over-year growth 2023-2028 (%)
- 7.7 Others - Market size and forecast 2023-2028
- Chart on Others - Market size and forecast 2023-2028 ($ million)
- Data Table on Others - Market size and forecast 2023-2028 ($ million)
- Chart on Others - Year-over-year growth 2023-2028 (%)
- Data Table on Others - Year-over-year growth 2023-2028 (%)
- 7.8 Market opportunity by Technology
- Market opportunity by Technology ($ million)
- Data Table on Market opportunity by Technology ($ million)
8 Customer Landscape
- 8.1 Customer landscape overview
- Analysis of price sensitivity, lifecycle, customer purchase basket, adoption rates, and purchase criteria
9 Geographic Landscape
- 9.1 Geographic segmentation
- Chart on Market share By Geographical Landscape 2023-2028 (%)
- Data Table on Market share By Geographical Landscape 2023-2028 (%)
- 9.2 Geographic comparison
- Chart on Geographic comparison
- Data Table on Geographic comparison
- 9.3 North America - Market size and forecast 2023-2028
- Chart on North America - Market size and forecast 2023-2028 ($ million)
- Data Table on North America - Market size and forecast 2023-2028 ($ million)
- Chart on North America - Year-over-year growth 2023-2028 (%)
- Data Table on North America - Year-over-year growth 2023-2028 (%)
- 9.4 Europe - Market size and forecast 2023-2028
- Chart on Europe - Market size and forecast 2023-2028 ($ million)
- Data Table on Europe - Market size and forecast 2023-2028 ($ million)
- Chart on Europe - Year-over-year growth 2023-2028 (%)
- Data Table on Europe - Year-over-year growth 2023-2028 (%)
- 9.5 APAC - Market size and forecast 2023-2028
- Chart on APAC - Market size and forecast 2023-2028 ($ million)
- Data Table on APAC - Market size and forecast 2023-2028 ($ million)
- Chart on APAC - Year-over-year growth 2023-2028 (%)
- Data Table on APAC - Year-over-year growth 2023-2028 (%)
- 9.6 South America - Market size and forecast 2023-2028
- Chart on South America - Market size and forecast 2023-2028 ($ million)
- Data Table on South America - Market size and forecast 2023-2028 ($ million)
- Chart on South America - Year-over-year growth 2023-2028 (%)
- Data Table on South America - Year-over-year growth 2023-2028 (%)
- 9.7 Middle East and Africa - Market size and forecast 2023-2028
- Chart on Middle East and Africa - Market size and forecast 2023-2028 ($ million)
- Data Table on Middle East and Africa - Market size and forecast 2023-2028 ($ million)
- Chart on Middle East and Africa - Year-over-year growth 2023-2028 (%)
- Data Table on Middle East and Africa - Year-over-year growth 2023-2028 (%)
- 9.8 US - Market size and forecast 2023-2028
- Chart on US - Market size and forecast 2023-2028 ($ million)
- Data Table on US - Market size and forecast 2023-2028 ($ million)
- Chart on US - Year-over-year growth 2023-2028 (%)
- Data Table on US - Year-over-year growth 2023-2028 (%)
- 9.9 UK - Market size and forecast 2023-2028
- Chart on UK - Market size and forecast 2023-2028 ($ million)
- Data Table on UK - Market size and forecast 2023-2028 ($ million)
- Chart on UK - Year-over-year growth 2023-2028 (%)
- Data Table on UK - Year-over-year growth 2023-2028 (%)
- 9.10 China - Market size and forecast 2023-2028
- Chart on China - Market size and forecast 2023-2028 ($ million)
- Data Table on China - Market size and forecast 2023-2028 ($ million)
- Chart on China - Year-over-year growth 2023-2028 (%)
- Data Table on China - Year-over-year growth 2023-2028 (%)
- 9.11 Japan - Market size and forecast 2023-2028
- Chart on Japan - Market size and forecast 2023-2028 ($ million)
- Data Table on Japan - Market size and forecast 2023-2028 ($ million)
- Chart on Japan - Year-over-year growth 2023-2028 (%)
- Data Table on Japan - Year-over-year growth 2023-2028 (%)
- 9.12 Germany - Market size and forecast 2023-2028
- Chart on Germany - Market size and forecast 2023-2028 ($ million)
- Data Table on Germany - Market size and forecast 2023-2028 ($ million)
- Chart on Germany - Year-over-year growth 2023-2028 (%)
- Data Table on Germany - Year-over-year growth 2023-2028 (%)
- 9.13 Market opportunity By Geographical Landscape
- Market opportunity By Geographical Landscape ($ million)
- Data Tables on Market opportunity By Geographical Landscape ($ million)
10 Drivers, Challenges, and Opportunity/Restraints
- 10.1 Market drivers
- 10.2 Market challenges
- 10.3 Impact of drivers and challenges
- Impact of drivers and challenges in 2023 and 2028
- 10.4 Market opportunities/restraints
11 Competitive Landscape
- 11.1 Overview
- 11.2 Competitive Landscape
- Overview on criticality of inputs and factors of differentiation
- 11.3 Landscape disruption
- Overview on factors of disruption
- 11.4 Industry risks
- Impact of key risks on business
12 Competitive Analysis
- 12.1 Companies profiled
- Companies covered
- 12.2 Market positioning of companies
- Matrix on companies position and classification
- 12.3 Alphabet Inc.
- Alphabet Inc. - Overview
- Alphabet Inc. - Business segments
- Alphabet Inc. - Key offerings
- Alphabet Inc. - Segment focus
- 12.4 Boxlight Corp
- Boxlight Corp - Overview
- Boxlight Corp - Product / Service
- Boxlight Corp - Key news
- Boxlight Corp - Key offerings
- 12.5 Cisco Systems Inc.
- Cisco Systems Inc. - Overview
- Cisco Systems Inc. - Business segments
- Cisco Systems Inc. - Key news
- Cisco Systems Inc. - Key offerings
- Cisco Systems Inc. - Segment focus
- 12.6 Hitachi Ltd.
- Hitachi Ltd. - Overview
- Hitachi Ltd. - Business segments
- Hitachi Ltd. - Key news
- Hitachi Ltd. - Key offerings
- Hitachi Ltd. - Segment focus
- 12.7 Leyard Group
- Leyard Group - Overview
- Leyard Group - Business segments
- Leyard Group - Key offerings
- Leyard Group - Segment focus
- 12.8 LG Electronics Inc.
- LG Electronics Inc. - Overview
- LG Electronics Inc. - Product / Service
- LG Electronics Inc. - Key news
- LG Electronics Inc. - Key offerings
- 12.9 Microsoft Corp.
- Microsoft Corp. - Overview
- Microsoft Corp. - Business segments
- Microsoft Corp. - Key news
- Microsoft Corp. - Key offerings
- Microsoft Corp. - Segment focus
- 12.10 Panasonic Holdings Corp.
- Panasonic Holdings Corp. - Overview
- Panasonic Holdings Corp. - Business segments
- Panasonic Holdings Corp. - Key news
- Panasonic Holdings Corp. - Key offerings
- Panasonic Holdings Corp. - Segment focus
- 12.11 Promethean World Ltd.
- Promethean World Ltd. - Overview
- Promethean World Ltd. - Product / Service
- Promethean World Ltd. - Key offerings
- 12.12 Qisda Corp.
- Qisda Corp. - Overview
- Qisda Corp. - Product / Service
- Qisda Corp. - Key offerings
- 12.13 Ricoh Co. Ltd.
- Ricoh Co. Ltd. - Overview
- Ricoh Co. Ltd. - Business segments
- Ricoh Co. Ltd. - Key news
- Ricoh Co. Ltd. - Key offerings
- Ricoh Co. Ltd. - Segment focus
- 12.14 Samsung Electronics Co. Ltd.
- Samsung Electronics Co. Ltd. - Overview
- Samsung Electronics Co. Ltd. - Business segments
- Samsung Electronics Co. Ltd. - Key news
- Samsung Electronics Co. Ltd. - Key offerings
- Samsung Electronics Co. Ltd. - Segment focus
- 12.15 Sharp NEC Display Solutions of America Inc.
- Sharp NEC Display Solutions of America Inc. - Overview
- Sharp NEC Display Solutions of America Inc. - Product / Service
- Sharp NEC Display Solutions of America Inc. - Key offerings
- 12.16 SMART Technologies ULC
- SMART Technologies ULC - Overview
- SMART Technologies ULC - Product / Service
- SMART Technologies ULC - Key offerings
- 12.17 ViewSonic Corp.
- ViewSonic Corp. - Overview
- ViewSonic Corp. - Product / Service
- ViewSonic Corp. - Key offerings
13 Appendix
- 13.1 Scope of the report
- 13.2 Inclusions and exclusions checklist
- Inclusions checklist
- Exclusions checklist
- 13.3 Currency conversion rates for US$
- Currency conversion rates for US$
- 13.4 Research methodology
- Research methodology
- 13.5 Data procurement
- Information sources
- 13.6 Data validation
- Data validation
- 13.7 Validation techniques employed for market sizing
- Validation techniques employed for market sizing
- 13.8 Data synthesis
- Data synthesis
- 13.9 360 degree market analysis
- 360 degree market analysis
- 13.10 List of abbreviations
- List of abbreviations

