|
|
市場調査レポート
商品コード
1516169
人工揚油システムの世界市場 2024-2028Global artificial lift systems market 2024-2028 |
||||||
|
|||||||
カスタマイズ可能
|
|||||||


| 人工揚油システムの世界市場 2024-2028 |
|
出版日: 2024年06月11日
発行: TechNavio
ページ情報: 英文 175 Pages
納期: 即納可能
|

全表示
- 概要
- 図表
- 目次
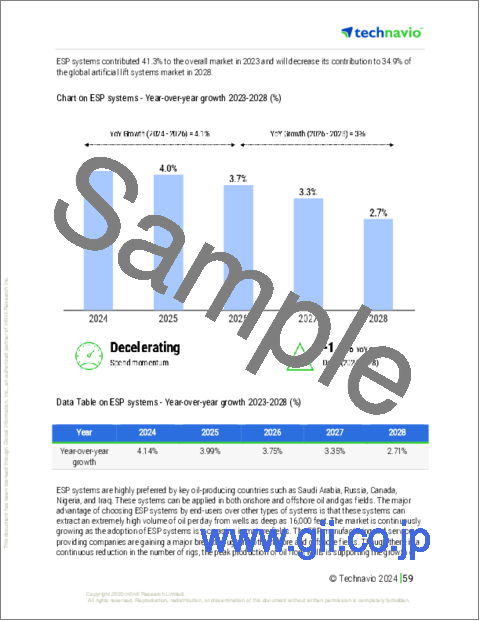
人工揚油システム市場は2023-2028年に46億2,180万米ドル、予測期間中のCAGRは7.12%で成長すると予測されます。
当レポートでは、人工揚油システム市場の全体的な分析、市場規模・予測、動向、成長促進要因、課題、約25のベンダーを網羅したベンダー分析などを掲載しています。
現在の市場シナリオ、最新動向と促進要因、市場環境全体に関する最新分析を提供しています。石油・天然ガスの需要拡大、深海、超深海、重油における生産活動の増加、成熟油田における生産要件の強化などが市場を牽引しています。
| 市場範囲 | |
|---|---|
| 基準年 | 2024 |
| 終了年 | 2028 |
| 予測期間 | 2024-2028 |
| 成長モメンタム | 加速 |
| 前年比2024年 | 6.51% |
| CAGR | 7.12% |
| 増分額 | 46億2,180万米ドル |
本調査では、今後数年間の人工揚油システム市場成長を牽引する主な要因の1つとして、自動化と遠隔技術の利用増加を挙げています。また、欧州における海底作業の増加や非従来型エネルギー源への適応の増加が、市場の大きな需要につながります。
目次
第1章 エグゼクティブサマリー
- 市場概要
第2章 市場情勢
- 市場エコシステム
- 市場の特徴
- バリューチェーン分析
第3章 市場規模の評価
- 市場の定義
- 市場セグメント分析
- 市場規模 2023
- 市場の見通し 2023-2028
第4章 市場規模実績
- 世界の人工揚油システム市場 2018-2022
- タイプ別セグメント分析 2018-2022
- エンドユーザー別セグメント分析 2018-2022
- 地域別セグメント分析 2018-2022
- 国別セグメント分析 2018-2022
第5章 ファイブフォース分析
- ファイブフォースの要約
- 買い手の交渉力
- 供給企業の交渉力
- 新規参入業者の脅威
- 代替品の脅威
- 競争の脅威
- 市況
第6章 市場セグメンテーション:タイプ別
- 市場セグメンテーション
- 比較:タイプ別
- ESPシステム:市場規模と予測 2023-2028
- RLPシステム:市場規模と予測 2023-2028
- PCPシステム:市場規模と予測 2023-2028
- その他:市場規模と予測 2023-2028
- 市場機会:タイプ別
第7章 市場セグメンテーション:エンドユーザー別
- 市場セグメンテーション
- 比較:エンドユーザー別
- 陸上石油・ガス産業:市場規模と予測 2023-2028
- オフショア石油・ガス産業:市場規模と予測 2023-2028
- 市場機会:エンドユーザー別
第8章 顧客情勢
- 顧客情勢の概要
第9章 地域別情勢
- 地域別セグメンテーション
- 地域別比較
- 北米:市場規模と予測 2023-2028
- 欧州:市場規模と予測 2023-2028
- アジア太平洋:市場規模と予測 2023-2028
- 中東・アフリカ:市場規模と予測 2023-2028
- 南米:市場規模と予測 2023-2028
- 米国:市場規模と予測 2023-2028
- カナダ:市場規模と予測 2023-2028
- スペイン:市場規模と予測 2023-2028
- 中国:市場規模と予測 2023-2028
- 日本:市場規模と予測 2023-2028
- 市場機会:地域情勢別
第10章 促進要因・課題・機会・抑制要因
- 市場促進要因
- 市場の課題
- 促進要因と課題の影響
- 市場の機会・抑制要因
第11章 競合情勢
- 概要
- 競合情勢
- 混乱の状況
- 業界のリスク
第12章 競合分析
- 企業プロファイル
- 企業の市場ポジショニング
- Baker Hughes Co.
- ChampionX Corp.
- Halliburton Co.
- JJ Tech
- Levare International
- Liberty Lift Solutions LLC
- NOV Inc.
- Novomet Group
- NOW Inc.
- OiLSERV
- PCM Artificial Lift Solutions
- Premium Artificial Lift Systems Ltd.
- Rockwell Automation Inc.
- Schlumberger Ltd.
- Weatherford International Plc
第13章 付録
Exhibits:
- Exhibits1: Executive Summary - Chart on Market Overview
- Exhibits2: Executive Summary - Data Table on Market Overview
- Exhibits3: Executive Summary - Chart on Global Market Characteristics
- Exhibits4: Executive Summary - Chart on Market By Geographical Landscape
- Exhibits5: Executive Summary - Chart on Market Segmentation by Type
- Exhibits6: Executive Summary - Chart on Market Segmentation by End-user
- Exhibits7: Executive Summary - Chart on Incremental Growth
- Exhibits8: Executive Summary - Data Table on Incremental Growth
- Exhibits9: Executive Summary - Chart on Company Market Positioning
- Exhibits10: Parent Market
- Exhibits11: Data Table on - Parent Market
- Exhibits12: Market characteristics analysis
- Exhibits13: Value Chain Analysis
- Exhibits14: Offerings of companies included in the market definition
- Exhibits15: Market segments
- Exhibits16: Chart on Global - Market size and forecast 2023-2028 ($ million)
- Exhibits17: Data Table on Global - Market size and forecast 2023-2028 ($ million)
- Exhibits18: Chart on Global Market: Year-over-year growth 2023-2028 (%)
- Exhibits19: Data Table on Global Market: Year-over-year growth 2023-2028 (%)
- Exhibits20: Historic Market Size - Data Table on Global Artificial Lift Systems Market 2018 - 2022 ($ million)
- Exhibits21: Historic Market Size - Type Segment 2018 - 2022 ($ million)
- Exhibits22: Historic Market Size - End-user Segment 2018 - 2022 ($ million)
- Exhibits23: Historic Market Size - Geography Segment 2018 - 2022 ($ million)
- Exhibits24: Historic Market Size - Country Segment 2018 - 2022 ($ million)
- Exhibits25: Five forces analysis - Comparison between 2023 and 2028
- Exhibits26: Bargaining power of buyers - Impact of key factors 2023 and 2028
- Exhibits27: Bargaining power of suppliers - Impact of key factors in 2023 and 2028
- Exhibits28: Threat of new entrants - Impact of key factors in 2023 and 2028
- Exhibits29: Threat of substitutes - Impact of key factors in 2023 and 2028
- Exhibits30: Threat of rivalry - Impact of key factors in 2023 and 2028
- Exhibits31: Chart on Market condition - Five forces 2023 and 2028
- Exhibits32: Chart on Type - Market share 2023-2028 (%)
- Exhibits33: Data Table on Type - Market share 2023-2028 (%)
- Exhibits34: Chart on Comparison by Type
- Exhibits35: Data Table on Comparison by Type
- Exhibits36: Chart on ESP systems - Market size and forecast 2023-2028 ($ million)
- Exhibits37: Data Table on ESP systems - Market size and forecast 2023-2028 ($ million)
- Exhibits38: Chart on ESP systems - Year-over-year growth 2023-2028 (%)
- Exhibits39: Data Table on ESP systems - Year-over-year growth 2023-2028 (%)
- Exhibits40: Chart on RLP systems - Market size and forecast 2023-2028 ($ million)
- Exhibits41: Data Table on RLP systems - Market size and forecast 2023-2028 ($ million)
- Exhibits42: Chart on RLP systems - Year-over-year growth 2023-2028 (%)
- Exhibits43: Data Table on RLP systems - Year-over-year growth 2023-2028 (%)
- Exhibits44: Chart on PCP systems - Market size and forecast 2023-2028 ($ million)
- Exhibits45: Data Table on PCP systems - Market size and forecast 2023-2028 ($ million)
- Exhibits46: Chart on PCP systems - Year-over-year growth 2023-2028 (%)
- Exhibits47: Data Table on PCP systems - Year-over-year growth 2023-2028 (%)
- Exhibits48: Chart on Others - Market size and forecast 2023-2028 ($ million)
- Exhibits49: Data Table on Others - Market size and forecast 2023-2028 ($ million)
- Exhibits50: Chart on Others - Year-over-year growth 2023-2028 (%)
- Exhibits51: Data Table on Others - Year-over-year growth 2023-2028 (%)
- Exhibits52: Market opportunity by Type ($ million)
- Exhibits53: Data Table on Market opportunity by Type ($ million)
- Exhibits54: Chart on End-user - Market share 2023-2028 (%)
- Exhibits55: Data Table on End-user - Market share 2023-2028 (%)
- Exhibits56: Chart on Comparison by End-user
- Exhibits57: Data Table on Comparison by End-user
- Exhibits58: Chart on Onshore oil and gas industry - Market size and forecast 2023-2028 ($ million)
- Exhibits59: Data Table on Onshore oil and gas industry - Market size and forecast 2023-2028 ($ million)
- Exhibits60: Chart on Onshore oil and gas industry - Year-over-year growth 2023-2028 (%)
- Exhibits61: Data Table on Onshore oil and gas industry - Year-over-year growth 2023-2028 (%)
- Exhibits62: Chart on Offshore oil and gas industry - Market size and forecast 2023-2028 ($ million)
- Exhibits63: Data Table on Offshore oil and gas industry - Market size and forecast 2023-2028 ($ million)
- Exhibits64: Chart on Offshore oil and gas industry - Year-over-year growth 2023-2028 (%)
- Exhibits65: Data Table on Offshore oil and gas industry - Year-over-year growth 2023-2028 (%)
- Exhibits66: Market opportunity by End-user ($ million)
- Exhibits67: Data Table on Market opportunity by End-user ($ million)
- Exhibits68: Analysis of price sensitivity, lifecycle, customer purchase basket, adoption rates, and purchase criteria
- Exhibits69: Chart on Market share By Geographical Landscape 2023-2028 (%)
- Exhibits70: Data Table on Market share By Geographical Landscape 2023-2028 (%)
- Exhibits71: Chart on Geographic comparison
- Exhibits72: Data Table on Geographic comparison
- Exhibits73: Chart on North America - Market size and forecast 2023-2028 ($ million)
- Exhibits74: Data Table on North America - Market size and forecast 2023-2028 ($ million)
- Exhibits75: Chart on North America - Year-over-year growth 2023-2028 (%)
- Exhibits76: Data Table on North America - Year-over-year growth 2023-2028 (%)
- Exhibits77: Chart on Europe - Market size and forecast 2023-2028 ($ million)
- Exhibits78: Data Table on Europe - Market size and forecast 2023-2028 ($ million)
- Exhibits79: Chart on Europe - Year-over-year growth 2023-2028 (%)
- Exhibits80: Data Table on Europe - Year-over-year growth 2023-2028 (%)
- Exhibits81: Chart on APAC - Market size and forecast 2023-2028 ($ million)
- Exhibits82: Data Table on APAC - Market size and forecast 2023-2028 ($ million)
- Exhibits83: Chart on APAC - Year-over-year growth 2023-2028 (%)
- Exhibits84: Data Table on APAC - Year-over-year growth 2023-2028 (%)
- Exhibits85: Chart on Middle East and Africa - Market size and forecast 2023-2028 ($ million)
- Exhibits86: Data Table on Middle East and Africa - Market size and forecast 2023-2028 ($ million)
- Exhibits87: Chart on Middle East and Africa - Year-over-year growth 2023-2028 (%)
- Exhibits88: Data Table on Middle East and Africa - Year-over-year growth 2023-2028 (%)
- Exhibits89: Chart on South America - Market size and forecast 2023-2028 ($ million)
- Exhibits90: Data Table on South America - Market size and forecast 2023-2028 ($ million)
- Exhibits91: Chart on South America - Year-over-year growth 2023-2028 (%)
- Exhibits92: Data Table on South America - Year-over-year growth 2023-2028 (%)
- Exhibits93: Chart on US - Market size and forecast 2023-2028 ($ million)
- Exhibits94: Data Table on US - Market size and forecast 2023-2028 ($ million)
- Exhibits95: Chart on US - Year-over-year growth 2023-2028 (%)
- Exhibits96: Data Table on US - Year-over-year growth 2023-2028 (%)
- Exhibits97: Chart on Canada - Market size and forecast 2023-2028 ($ million)
- Exhibits98: Data Table on Canada - Market size and forecast 2023-2028 ($ million)
- Exhibits99: Chart on Canada - Year-over-year growth 2023-2028 (%)
- Exhibits100: Data Table on Canada - Year-over-year growth 2023-2028 (%)
- Exhibits101: Chart on Spain - Market size and forecast 2023-2028 ($ million)
- Exhibits102: Data Table on Spain - Market size and forecast 2023-2028 ($ million)
- Exhibits103: Chart on Spain - Year-over-year growth 2023-2028 (%)
- Exhibits104: Data Table on Spain - Year-over-year growth 2023-2028 (%)
- Exhibits105: Chart on China - Market size and forecast 2023-2028 ($ million)
- Exhibits106: Data Table on China - Market size and forecast 2023-2028 ($ million)
- Exhibits107: Chart on China - Year-over-year growth 2023-2028 (%)
- Exhibits108: Data Table on China - Year-over-year growth 2023-2028 (%)
- Exhibits109: Chart on Japan - Market size and forecast 2023-2028 ($ million)
- Exhibits110: Data Table on Japan - Market size and forecast 2023-2028 ($ million)
- Exhibits111: Chart on Japan - Year-over-year growth 2023-2028 (%)
- Exhibits112: Data Table on Japan - Year-over-year growth 2023-2028 (%)
- Exhibits113: Market opportunity By Geographical Landscape ($ million)
- Exhibits114: Data Tables on Market opportunity By Geographical Landscape ($ million)
- Exhibits115: Impact of drivers and challenges in 2023 and 2028
- Exhibits116: Overview on criticality of inputs and factors of differentiation
- Exhibits117: Overview on factors of disruption
- Exhibits118: Impact of key risks on business
- Exhibits119: Companies covered
- Exhibits120: Matrix on companies position and classification
- Exhibits121: Baker Hughes Co. - Overview
- Exhibits122: Baker Hughes Co. - Business segments
- Exhibits123: Baker Hughes Co. - Key news
- Exhibits124: Baker Hughes Co. - Key offerings
- Exhibits125: Baker Hughes Co. - Segment focus
- Exhibits126: ChampionX Corp. - Overview
- Exhibits127: ChampionX Corp. - Business segments
- Exhibits128: ChampionX Corp. - Key offerings
- Exhibits129: ChampionX Corp. - Segment focus
- Exhibits130: Halliburton Co. - Overview
- Exhibits131: Halliburton Co. - Business segments
- Exhibits132: Halliburton Co. - Key news
- Exhibits133: Halliburton Co. - Key offerings
- Exhibits134: Halliburton Co. - Segment focus
- Exhibits135: JJ Tech - Overview
- Exhibits136: JJ Tech - Product / Service
- Exhibits137: JJ Tech - Key offerings
- Exhibits138: Levare International - Overview
- Exhibits139: Levare International - Product / Service
- Exhibits140: Levare International - Key offerings
- Exhibits141: Liberty Lift Solutions LLC - Overview
- Exhibits142: Liberty Lift Solutions LLC - Product / Service
- Exhibits143: Liberty Lift Solutions LLC - Key offerings
- Exhibits144: NOV Inc. - Overview
- Exhibits145: NOV Inc. - Business segments
- Exhibits146: NOV Inc. - Key news
- Exhibits147: NOV Inc. - Key offerings
- Exhibits148: NOV Inc. - Segment focus
- Exhibits149: Novomet Group - Overview
- Exhibits150: Novomet Group - Product / Service
- Exhibits151: Novomet Group - Key offerings
- Exhibits152: NOW Inc. - Overview
- Exhibits153: NOW Inc. - Business segments
- Exhibits154: NOW Inc. - Key offerings
- Exhibits155: NOW Inc. - Segment focus
- Exhibits156: OiLSERV - Overview
- Exhibits157: OiLSERV - Product / Service
- Exhibits158: OiLSERV - Key offerings
- Exhibits159: PCM Artificial Lift Solutions - Overview
- Exhibits160: PCM Artificial Lift Solutions - Product / Service
- Exhibits161: PCM Artificial Lift Solutions - Key offerings
- Exhibits162: Premium Artificial Lift Systems Ltd. - Overview
- Exhibits163: Premium Artificial Lift Systems Ltd. - Product / Service
- Exhibits164: Premium Artificial Lift Systems Ltd. - Key offerings
- Exhibits165: Rockwell Automation Inc. - Overview
- Exhibits166: Rockwell Automation Inc. - Business segments
- Exhibits167: Rockwell Automation Inc. - Key news
- Exhibits168: Rockwell Automation Inc. - Key offerings
- Exhibits169: Rockwell Automation Inc. - Segment focus
- Exhibits170: Schlumberger Ltd. - Overview
- Exhibits171: Schlumberger Ltd. - Business segments
- Exhibits172: Schlumberger Ltd. - Key news
- Exhibits173: Schlumberger Ltd. - Key offerings
- Exhibits174: Schlumberger Ltd. - Segment focus
- Exhibits175: Weatherford International Plc - Overview
- Exhibits176: Weatherford International Plc - Business segments
- Exhibits177: Weatherford International Plc - Key news
- Exhibits178: Weatherford International Plc - Key offerings
- Exhibits179: Weatherford International Plc - Segment focus
- Exhibits180: Inclusions checklist
- Exhibits181: Exclusions checklist
- Exhibits182: Currency conversion rates for US$
- Exhibits183: Research methodology
- Exhibits184: Information sources
- Exhibits185: Data validation
- Exhibits186: Validation techniques employed for market sizing
- Exhibits187: Data synthesis
- Exhibits188: 360 degree market analysis
- Exhibits189: List of abbreviations
The artificial lift systems market is forecasted to grow by USD 4621.8 mn during 2023-2028, accelerating at a CAGR of 7.12% during the forecast period. The report on the artificial lift systems market provides a holistic analysis, market size and forecast, trends, growth drivers, and challenges, as well as vendor analysis covering around 25 vendors.
The report offers an up-to-date analysis regarding the current market scenario, the latest trends and drivers, and the overall market environment. The market is driven by growing demand for oil and natural gas, increase in production activities in deepwater, ultra-deep offshore, and heavy-oil, and enhanced production requirements in mature fields.
Technavio's artificial lift systems market is segmented as below:
| Market Scope | |
|---|---|
| Base Year | 2024 |
| End Year | 2028 |
| Series Year | 2024-2028 |
| Growth Momentum | Accelerate |
| YOY 2024 | 6.51% |
| CAGR | 7.12% |
| Incremental Value | $4621.8mn |
By Type
- ESP systems
- RLP systems
- PCP systems
- Others
By End-user
- Onshore oil and gas industry
- Offshore oil and gas industry
By Geographical Landscape
- North America
- Europe
- APAC
- Middle East and Africa
- South America
This study identifies the increasing use of automation and remote technology as one of the prime reasons driving the artificial lift systems market growth during the next few years. Also, increasing subsea operations and increasing adaptation to non-conventional energy sources in Europe will lead to sizable demand in the market.
The report on the artificial lift systems market covers the following areas:
- Artificial lift systems market sizing
- Artificial lift systems market forecast
- Artificial lift systems market industry analysis
The robust vendor analysis is designed to help clients improve their market position, and in line with this, this report provides a detailed analysis of several leading artificial lift systems market vendors that include Baker Hughes Co., ChampionX Corp., General Petroleum Holdings Pty Ltd., Gulf Coast Pump and Supply, Halliburton Co., JJ Tech, Levare International, Liberty Lift Solutions LLC, NOV Inc., Novomet Group, NOW Inc., OiLSERV, PCM Artificial Lift Solutions, Premium Artificial Lift Systems Ltd., Rockwell Automation Inc., Schlumberger Ltd., SSI Artificial Lift, Torqueflow-Sydex Ltd., Valiant Artificial Lift Solutions LLC, and Weatherford International Plc. Also, the artificial lift systems market analysis report includes information on upcoming trends and challenges that will influence market growth. This is to help companies strategize and leverage all forthcoming growth opportunities.
The study was conducted using an objective combination of primary and secondary information including inputs from key participants in the industry. The report contains a comprehensive market and vendor landscape in addition to an analysis of the key vendors.
The publisher presents a detailed picture of the market by the way of study, synthesis, and summation of data from multiple sources by an analysis of key parameters such as profit, pricing, competition, and promotions. It presents various market facets by identifying the key industry influencers. The data presented is comprehensive, reliable, and a result of extensive research - both primary and secondary. The market research reports provide a complete competitive landscape and an in-depth vendor selection methodology and analysis using qualitative and quantitative research to forecast the accurate market growth.
Table of Contents
1 Executive Summary
- 1.1 Market overview
- Executive Summary - Chart on Market Overview
- Executive Summary - Data Table on Market Overview
- Executive Summary - Chart on Global Market Characteristics
- Executive Summary - Chart on Market By Geographical Landscape
- Executive Summary - Chart on Market Segmentation by Type
- Executive Summary - Chart on Market Segmentation by End-user
- Executive Summary - Chart on Incremental Growth
- Executive Summary - Data Table on Incremental Growth
- Executive Summary - Chart on Company Market Positioning
2 Market Landscape
- 2.1 Market ecosystem
- Parent Market
- Data Table on - Parent Market
- 2.2 Market characteristics
- Market characteristics analysis
- 2.3 Value chain analysis
- Value Chain Analysis
3 Market Sizing
- 3.1 Market definition
- Offerings of companies included in the market definition
- 3.2 Market segment analysis
- Market segments
- 3.3 Market size 2023
- 3.4 Market outlook: Forecast for 2023-2028
- Chart on Global - Market size and forecast 2023-2028 ($ million)
- Data Table on Global - Market size and forecast 2023-2028 ($ million)
- Chart on Global Market: Year-over-year growth 2023-2028 (%)
- Data Table on Global Market: Year-over-year growth 2023-2028 (%)
4 Historic Market Size
- 4.1 Global Artificial Lift Systems Market 2018 - 2022
- Historic Market Size - Data Table on Global Artificial Lift Systems Market 2018 - 2022 ($ million)
- 4.2 Type segment analysis 2018 - 2022
- Historic Market Size - Type Segment 2018 - 2022 ($ million)
- 4.3 End-user segment analysis 2018 - 2022
- Historic Market Size - End-user Segment 2018 - 2022 ($ million)
- 4.4 Geography segment analysis 2018 - 2022
- Historic Market Size - Geography Segment 2018 - 2022 ($ million)
- 4.5 Country segment analysis 2018 - 2022
- Historic Market Size - Country Segment 2018 - 2022 ($ million)
5 Five Forces Analysis
- 5.1 Five forces summary
- Five forces analysis - Comparison between 2023 and 2028
- 5.2 Bargaining power of buyers
- Bargaining power of buyers - Impact of key factors 2023 and 2028
- 5.3 Bargaining power of suppliers
- Bargaining power of suppliers - Impact of key factors in 2023 and 2028
- 5.4 Threat of new entrants
- Threat of new entrants - Impact of key factors in 2023 and 2028
- 5.5 Threat of substitutes
- Threat of substitutes - Impact of key factors in 2023 and 2028
- 5.6 Threat of rivalry
- Threat of rivalry - Impact of key factors in 2023 and 2028
- 5.7 Market condition
- Chart on Market condition - Five forces 2023 and 2028
6 Market Segmentation by Type
- 6.1 Market segments
- Chart on Type - Market share 2023-2028 (%)
- Data Table on Type - Market share 2023-2028 (%)
- 6.2 Comparison by Type
- Chart on Comparison by Type
- Data Table on Comparison by Type
- 6.3 ESP systems - Market size and forecast 2023-2028
- Chart on ESP systems - Market size and forecast 2023-2028 ($ million)
- Data Table on ESP systems - Market size and forecast 2023-2028 ($ million)
- Chart on ESP systems - Year-over-year growth 2023-2028 (%)
- Data Table on ESP systems - Year-over-year growth 2023-2028 (%)
- 6.4 RLP systems - Market size and forecast 2023-2028
- Chart on RLP systems - Market size and forecast 2023-2028 ($ million)
- Data Table on RLP systems - Market size and forecast 2023-2028 ($ million)
- Chart on RLP systems - Year-over-year growth 2023-2028 (%)
- Data Table on RLP systems - Year-over-year growth 2023-2028 (%)
- 6.5 PCP systems - Market size and forecast 2023-2028
- Chart on PCP systems - Market size and forecast 2023-2028 ($ million)
- Data Table on PCP systems - Market size and forecast 2023-2028 ($ million)
- Chart on PCP systems - Year-over-year growth 2023-2028 (%)
- Data Table on PCP systems - Year-over-year growth 2023-2028 (%)
- 6.6 Others - Market size and forecast 2023-2028
- Chart on Others - Market size and forecast 2023-2028 ($ million)
- Data Table on Others - Market size and forecast 2023-2028 ($ million)
- Chart on Others - Year-over-year growth 2023-2028 (%)
- Data Table on Others - Year-over-year growth 2023-2028 (%)
- 6.7 Market opportunity by Type
- Market opportunity by Type ($ million)
- Data Table on Market opportunity by Type ($ million)
7 Market Segmentation by End-user
- 7.1 Market segments
- Chart on End-user - Market share 2023-2028 (%)
- Data Table on End-user - Market share 2023-2028 (%)
- 7.2 Comparison by End-user
- Chart on Comparison by End-user
- Data Table on Comparison by End-user
- 7.3 Onshore oil and gas industry - Market size and forecast 2023-2028
- Chart on Onshore oil and gas industry - Market size and forecast 2023-2028 ($ million)
- Data Table on Onshore oil and gas industry - Market size and forecast 2023-2028 ($ million)
- Chart on Onshore oil and gas industry - Year-over-year growth 2023-2028 (%)
- Data Table on Onshore oil and gas industry - Year-over-year growth 2023-2028 (%)
- 7.4 Offshore oil and gas industry - Market size and forecast 2023-2028
- Chart on Offshore oil and gas industry - Market size and forecast 2023-2028 ($ million)
- Data Table on Offshore oil and gas industry - Market size and forecast 2023-2028 ($ million)
- Chart on Offshore oil and gas industry - Year-over-year growth 2023-2028 (%)
- Data Table on Offshore oil and gas industry - Year-over-year growth 2023-2028 (%)
- 7.5 Market opportunity by End-user
- Market opportunity by End-user ($ million)
- Data Table on Market opportunity by End-user ($ million)
8 Customer Landscape
- 8.1 Customer landscape overview
- Analysis of price sensitivity, lifecycle, customer purchase basket, adoption rates, and purchase criteria
9 Geographic Landscape
- 9.1 Geographic segmentation
- Chart on Market share By Geographical Landscape 2023-2028 (%)
- Data Table on Market share By Geographical Landscape 2023-2028 (%)
- 9.2 Geographic comparison
- Chart on Geographic comparison
- Data Table on Geographic comparison
- 9.3 North America - Market size and forecast 2023-2028
- Chart on North America - Market size and forecast 2023-2028 ($ million)
- Data Table on North America - Market size and forecast 2023-2028 ($ million)
- Chart on North America - Year-over-year growth 2023-2028 (%)
- Data Table on North America - Year-over-year growth 2023-2028 (%)
- 9.4 Europe - Market size and forecast 2023-2028
- Chart on Europe - Market size and forecast 2023-2028 ($ million)
- Data Table on Europe - Market size and forecast 2023-2028 ($ million)
- Chart on Europe - Year-over-year growth 2023-2028 (%)
- Data Table on Europe - Year-over-year growth 2023-2028 (%)
- 9.5 APAC - Market size and forecast 2023-2028
- Chart on APAC - Market size and forecast 2023-2028 ($ million)
- Data Table on APAC - Market size and forecast 2023-2028 ($ million)
- Chart on APAC - Year-over-year growth 2023-2028 (%)
- Data Table on APAC - Year-over-year growth 2023-2028 (%)
- 9.6 Middle East and Africa - Market size and forecast 2023-2028
- Chart on Middle East and Africa - Market size and forecast 2023-2028 ($ million)
- Data Table on Middle East and Africa - Market size and forecast 2023-2028 ($ million)
- Chart on Middle East and Africa - Year-over-year growth 2023-2028 (%)
- Data Table on Middle East and Africa - Year-over-year growth 2023-2028 (%)
- 9.7 South America - Market size and forecast 2023-2028
- Chart on South America - Market size and forecast 2023-2028 ($ million)
- Data Table on South America - Market size and forecast 2023-2028 ($ million)
- Chart on South America - Year-over-year growth 2023-2028 (%)
- Data Table on South America - Year-over-year growth 2023-2028 (%)
- 9.8 US - Market size and forecast 2023-2028
- Chart on US - Market size and forecast 2023-2028 ($ million)
- Data Table on US - Market size and forecast 2023-2028 ($ million)
- Chart on US - Year-over-year growth 2023-2028 (%)
- Data Table on US - Year-over-year growth 2023-2028 (%)
- 9.9 Canada - Market size and forecast 2023-2028
- Chart on Canada - Market size and forecast 2023-2028 ($ million)
- Data Table on Canada - Market size and forecast 2023-2028 ($ million)
- Chart on Canada - Year-over-year growth 2023-2028 (%)
- Data Table on Canada - Year-over-year growth 2023-2028 (%)
- 9.10 Spain - Market size and forecast 2023-2028
- Chart on Spain - Market size and forecast 2023-2028 ($ million)
- Data Table on Spain - Market size and forecast 2023-2028 ($ million)
- Chart on Spain - Year-over-year growth 2023-2028 (%)
- Data Table on Spain - Year-over-year growth 2023-2028 (%)
- 9.11 China - Market size and forecast 2023-2028
- Chart on China - Market size and forecast 2023-2028 ($ million)
- Data Table on China - Market size and forecast 2023-2028 ($ million)
- Chart on China - Year-over-year growth 2023-2028 (%)
- Data Table on China - Year-over-year growth 2023-2028 (%)
- 9.12 Japan - Market size and forecast 2023-2028
- Chart on Japan - Market size and forecast 2023-2028 ($ million)
- Data Table on Japan - Market size and forecast 2023-2028 ($ million)
- Chart on Japan - Year-over-year growth 2023-2028 (%)
- Data Table on Japan - Year-over-year growth 2023-2028 (%)
- 9.13 Market opportunity By Geographical Landscape
- Market opportunity By Geographical Landscape ($ million)
- Data Tables on Market opportunity By Geographical Landscape ($ million)
10 Drivers, Challenges, and Opportunity/Restraints
- 10.1 Market drivers
- 10.2 Market challenges
- 10.3 Impact of drivers and challenges
- Impact of drivers and challenges in 2023 and 2028
- 10.4 Market opportunities/restraints
11 Competitive Landscape
- 11.1 Overview
- 11.2 Competitive Landscape
- Overview on criticality of inputs and factors of differentiation
- 11.3 Landscape disruption
- Overview on factors of disruption
- 11.4 Industry risks
- Impact of key risks on business
12 Competitive Analysis
- 12.1 Companies profiled
- Companies covered
- 12.2 Market positioning of companies
- Matrix on companies position and classification
- 12.3 Baker Hughes Co.
- Baker Hughes Co. - Overview
- Baker Hughes Co. - Business segments
- Baker Hughes Co. - Key news
- Baker Hughes Co. - Key offerings
- Baker Hughes Co. - Segment focus
- 12.4 ChampionX Corp.
- ChampionX Corp. - Overview
- ChampionX Corp. - Business segments
- ChampionX Corp. - Key offerings
- ChampionX Corp. - Segment focus
- 12.5 Halliburton Co.
- Halliburton Co. - Overview
- Halliburton Co. - Business segments
- Halliburton Co. - Key news
- Halliburton Co. - Key offerings
- Halliburton Co. - Segment focus
- 12.6 JJ Tech
- JJ Tech - Overview
- JJ Tech - Product / Service
- JJ Tech - Key offerings
- 12.7 Levare International
- Levare International - Overview
- Levare International - Product / Service
- Levare International - Key offerings
- 12.8 Liberty Lift Solutions LLC
- Liberty Lift Solutions LLC - Overview
- Liberty Lift Solutions LLC - Product / Service
- Liberty Lift Solutions LLC - Key offerings
- 12.9 NOV Inc.
- NOV Inc. - Overview
- NOV Inc. - Business segments
- NOV Inc. - Key news
- NOV Inc. - Key offerings
- NOV Inc. - Segment focus
- 12.10 Novomet Group
- Novomet Group - Overview
- Novomet Group - Product / Service
- Novomet Group - Key offerings
- 12.11 NOW Inc.
- NOW Inc. - Overview
- NOW Inc. - Business segments
- NOW Inc. - Key offerings
- NOW Inc. - Segment focus
- 12.12 OiLSERV
- OiLSERV - Overview
- OiLSERV - Product / Service
- OiLSERV - Key offerings
- 12.13 PCM Artificial Lift Solutions
- PCM Artificial Lift Solutions - Overview
- PCM Artificial Lift Solutions - Product / Service
- PCM Artificial Lift Solutions - Key offerings
- 12.14 Premium Artificial Lift Systems Ltd.
- Premium Artificial Lift Systems Ltd. - Overview
- Premium Artificial Lift Systems Ltd. - Product / Service
- Premium Artificial Lift Systems Ltd. - Key offerings
- 12.15 Rockwell Automation Inc.
- Rockwell Automation Inc. - Overview
- Rockwell Automation Inc. - Business segments
- Rockwell Automation Inc. - Key news
- Rockwell Automation Inc. - Key offerings
- Rockwell Automation Inc. - Segment focus
- 12.16 Schlumberger Ltd.
- Schlumberger Ltd. - Overview
- Schlumberger Ltd. - Business segments
- Schlumberger Ltd. - Key news
- Schlumberger Ltd. - Key offerings
- Schlumberger Ltd. - Segment focus
- 12.17 Weatherford International Plc
- Weatherford International Plc - Overview
- Weatherford International Plc - Business segments
- Weatherford International Plc - Key news
- Weatherford International Plc - Key offerings
- Weatherford International Plc - Segment focus
13 Appendix
- 13.1 Scope of the report
- 13.2 Inclusions and exclusions checklist
- Inclusions checklist
- Exclusions checklist
- 13.3 Currency conversion rates for US$
- Currency conversion rates for US$
- 13.4 Research methodology
- Research methodology
- 13.5 Data procurement
- Information sources
- 13.6 Data validation
- Data validation
- 13.7 Validation techniques employed for market sizing
- Validation techniques employed for market sizing
- 13.8 Data synthesis
- Data synthesis
- 13.9 360 degree market analysis
- 360 degree market analysis
- 13.10 List of abbreviations
- List of abbreviations

