|
|
市場調査レポート
商品コード
1544359
医療廃棄物管理の世界市場、2024~2028年Global Medical Waste Management Market 2024-2028 |
||||||

|
|||||||
カスタマイズ可能
|
|||||||

| 医療廃棄物管理の世界市場、2024~2028年 |
|
出版日: 2024年07月12日
発行: TechNavio
ページ情報: 英文 160 Pages
納期: 即納可能
|

全表示
- 概要
- 図表
- 目次
医療廃棄物管理市場は2023~2028年に38億2,160万米ドル、予測期間中のCAGRは5.97%で成長すると予測されます。
当レポートでは、医療廃棄物管理市場の全体的な分析、市場規模・予測、動向、成長促進要因、課題、約25のベンダーを網羅したベンダー分析などを掲載しています。
現在の市場シナリオ、最新動向と促進要因、市場環境全体に関する最新分析を提供しています。市場は、医療産業の成長、環境問題への関心の高まり、アウトソーシング導入の増加によって牽引されています。
| 市場範囲 | |
|---|---|
| 基準年 | 2024年 |
| 終了年 | 2028年 |
| 予測期間 | 2024~2028年 |
| 成長モメンタム | 加速 |
| 前年比[2024年] | 5.27% |
| CAGR | 5.97% |
| 増分額 | 38億2,160万米ドル |
本調査では、技術の進歩が今後数年間の医療廃棄物管理市場成長を促進する主要要因の1つであるとしています。また、持続可能で環境に優しいソリューションの採用や、医療廃棄物管理に関する厳しい規制は、市場の大きな需要につながります。
目次
第1章 エグゼクティブサマリー
- 市場概要
第2章 市場情勢
- 市場エコシステム
- 市場の特徴
- バリューチェーン分析
第3章 市場規模の評価
- 市場の定義
- 市場セグメント分析
- 市場規模 2023年
- 市場の展望 2023~2028年
第4章 市場規模実績
- 医療廃棄物管理の世界市場 2018~2022年
- タイプ別セグメント分析 2018~2022年
- 技術別セグメント分析 2018~2022年
- 地域別セグメント分析 2018~2022年
- 国別セグメント分析 2018~2022年
第5章 ファイブフォース分析
- ファイブフォースの要約
- 買い手の交渉力
- 供給企業の交渉力
- 新規参入業者の脅威
- 代替品の脅威
- 競争の脅威
- 市況
第6章 市場セグメンテーション:タイプ別
- 市場セグメンテーション
- 比較:タイプ別
- 非危険物:市場規模と予測 2023~2028年
- 危険物:市場規模と予測 2023~2028年
- 市場機会:タイプ別
第7章 市場セグメンテーション:技術別
- 市場セグメンテーション
- 比較:技術別
- オフサイト治療:市場規模と予測 2023~2028年
- オンサイト治療:市場規模と予測 2023~2028年
- 市場機会:技術別
第8章 顧客情勢
- 顧客情勢概要
第9章 地域別情勢
- 地域別セグメンテーション
- 比較:地域別
- 北米:市場規模と予測 2023~2028年
- 欧州:市場規模と予測 2023~2028年
- アジア太平洋:市場規模と予測 2023~2028年
- 南米:市場規模と予測 2023~2028年
- 中東・アフリカ:市場規模と予測 2023~2028年
- 米国:市場規模と予測 2023~2028年
- カナダ:市場規模と予測 2023~2028年
- ドイツ:市場規模と予測 2023~2028年
- 英国:市場規模と予測 2023~2028年
- 中国:市場規模と予測 2023~2028年
- 市場機会:地域情勢別
第10章 促進要因・課題・機会・抑制要因
- 市場促進要因
- 市場課題
- 促進要因と課題の影響
- 市場の機会・抑制要因
第11章 競合情勢
- 概要
- 競合情勢
- 混乱の状況
- 業界のリスク
第12章 競合分析
- 企業プロファイル
- 企業の市場ポジショニング
- All Medical Waste Australia Pty Ltd.
- BioMedical Waste Solutions LLC
- BWS Inc.
- Casella Waste Systems Inc.
- Clean Harbors Inc.
- Daniels Health
- EPCO
- Gamma Waste Systems
- Larson Miller Inc.
- MEDPRO Disposal LLC
- Stericycle Inc.
- Trilogy MedWaste Inc.
- Triumvirate Environmental
- Veolia Environnement SA
- Waste Management Inc.
第13章 付録
Exhibits:
- Exhibits1: Executive Summary - Chart on Market Overview
- Exhibits2: Executive Summary - Data Table on Market Overview
- Exhibits3: Executive Summary - Chart on Global Market Characteristics
- Exhibits4: Executive Summary - Chart on Market By Geographical Landscape
- Exhibits5: Executive Summary - Chart on Market Segmentation by Type
- Exhibits6: Executive Summary - Chart on Market Segmentation by Technique
- Exhibits7: Executive Summary - Chart on Incremental Growth
- Exhibits8: Executive Summary - Data Table on Incremental Growth
- Exhibits9: Executive Summary - Chart on Company Market Positioning
- Exhibits10: Parent Market
- Exhibits11: Data Table on - Parent Market
- Exhibits12: Market characteristics analysis
- Exhibits13: Value Chain Analysis
- Exhibits14: Offerings of companies included in the market definition
- Exhibits15: Market segments
- Exhibits16: Chart on Global - Market size and forecast 2023-2028 ($ million)
- Exhibits17: Data Table on Global - Market size and forecast 2023-2028 ($ million)
- Exhibits18: Chart on Global Market: Year-over-year growth 2023-2028 (%)
- Exhibits19: Data Table on Global Market: Year-over-year growth 2023-2028 (%)
- Exhibits20: Historic Market Size - Data Table on Global Medical Waste Management Market 2018 - 2022 ($ million)
- Exhibits21: Historic Market Size - Type Segment 2018 - 2022 ($ million)
- Exhibits22: Historic Market Size - Technique Segment 2018 - 2022 ($ million)
- Exhibits23: Historic Market Size - Geography Segment 2018 - 2022 ($ million)
- Exhibits24: Historic Market Size - Country Segment 2018 - 2022 ($ million)
- Exhibits25: Five forces analysis - Comparison between 2023 and 2028
- Exhibits26: Bargaining power of buyers - Impact of key factors 2023 and 2028
- Exhibits27: Bargaining power of suppliers - Impact of key factors in 2023 and 2028
- Exhibits28: Threat of new entrants - Impact of key factors in 2023 and 2028
- Exhibits29: Threat of substitutes - Impact of key factors in 2023 and 2028
- Exhibits30: Threat of rivalry - Impact of key factors in 2023 and 2028
- Exhibits31: Chart on Market condition - Five forces 2023 and 2028
- Exhibits32: Chart on Type - Market share 2023-2028 (%)
- Exhibits33: Data Table on Type - Market share 2023-2028 (%)
- Exhibits34: Chart on Comparison by Type
- Exhibits35: Data Table on Comparison by Type
- Exhibits36: Chart on Non-hazardous - Market size and forecast 2023-2028 ($ million)
- Exhibits37: Data Table on Non-hazardous - Market size and forecast 2023-2028 ($ million)
- Exhibits38: Chart on Non-hazardous - Year-over-year growth 2023-2028 (%)
- Exhibits39: Data Table on Non-hazardous - Year-over-year growth 2023-2028 (%)
- Exhibits40: Chart on Hazardous - Market size and forecast 2023-2028 ($ million)
- Exhibits41: Data Table on Hazardous - Market size and forecast 2023-2028 ($ million)
- Exhibits42: Chart on Hazardous - Year-over-year growth 2023-2028 (%)
- Exhibits43: Data Table on Hazardous - Year-over-year growth 2023-2028 (%)
- Exhibits44: Market opportunity by Type ($ million)
- Exhibits45: Data Table on Market opportunity by Type ($ million)
- Exhibits46: Chart on Technique - Market share 2023-2028 (%)
- Exhibits47: Data Table on Technique - Market share 2023-2028 (%)
- Exhibits48: Chart on Comparison by Technique
- Exhibits49: Data Table on Comparison by Technique
- Exhibits50: Chart on Offsite treatment - Market size and forecast 2023-2028 ($ million)
- Exhibits51: Data Table on Offsite treatment - Market size and forecast 2023-2028 ($ million)
- Exhibits52: Chart on Offsite treatment - Year-over-year growth 2023-2028 (%)
- Exhibits53: Data Table on Offsite treatment - Year-over-year growth 2023-2028 (%)
- Exhibits54: Chart on Onsite treatment - Market size and forecast 2023-2028 ($ million)
- Exhibits55: Data Table on Onsite treatment - Market size and forecast 2023-2028 ($ million)
- Exhibits56: Chart on Onsite treatment - Year-over-year growth 2023-2028 (%)
- Exhibits57: Data Table on Onsite treatment - Year-over-year growth 2023-2028 (%)
- Exhibits58: Market opportunity by Technique ($ million)
- Exhibits59: Data Table on Market opportunity by Technique ($ million)
- Exhibits60: Analysis of price sensitivity, lifecycle, customer purchase basket, adoption rates, and purchase criteria
- Exhibits61: Chart on Market share By Geographical Landscape 2023-2028 (%)
- Exhibits62: Data Table on Market share By Geographical Landscape 2023-2028 (%)
- Exhibits63: Chart on Geographic comparison
- Exhibits64: Data Table on Geographic comparison
- Exhibits65: Chart on North America - Market size and forecast 2023-2028 ($ million)
- Exhibits66: Data Table on North America - Market size and forecast 2023-2028 ($ million)
- Exhibits67: Chart on North America - Year-over-year growth 2023-2028 (%)
- Exhibits68: Data Table on North America - Year-over-year growth 2023-2028 (%)
- Exhibits69: Chart on Europe - Market size and forecast 2023-2028 ($ million)
- Exhibits70: Data Table on Europe - Market size and forecast 2023-2028 ($ million)
- Exhibits71: Chart on Europe - Year-over-year growth 2023-2028 (%)
- Exhibits72: Data Table on Europe - Year-over-year growth 2023-2028 (%)
- Exhibits73: Chart on APAC - Market size and forecast 2023-2028 ($ million)
- Exhibits74: Data Table on APAC - Market size and forecast 2023-2028 ($ million)
- Exhibits75: Chart on APAC - Year-over-year growth 2023-2028 (%)
- Exhibits76: Data Table on APAC - Year-over-year growth 2023-2028 (%)
- Exhibits77: Chart on South America - Market size and forecast 2023-2028 ($ million)
- Exhibits78: Data Table on South America - Market size and forecast 2023-2028 ($ million)
- Exhibits79: Chart on South America - Year-over-year growth 2023-2028 (%)
- Exhibits80: Data Table on South America - Year-over-year growth 2023-2028 (%)
- Exhibits81: Chart on Middle East and Africa - Market size and forecast 2023-2028 ($ million)
- Exhibits82: Data Table on Middle East and Africa - Market size and forecast 2023-2028 ($ million)
- Exhibits83: Chart on Middle East and Africa - Year-over-year growth 2023-2028 (%)
- Exhibits84: Data Table on Middle East and Africa - Year-over-year growth 2023-2028 (%)
- Exhibits85: Chart on US - Market size and forecast 2023-2028 ($ million)
- Exhibits86: Data Table on US - Market size and forecast 2023-2028 ($ million)
- Exhibits87: Chart on US - Year-over-year growth 2023-2028 (%)
- Exhibits88: Data Table on US - Year-over-year growth 2023-2028 (%)
- Exhibits89: Chart on Canada - Market size and forecast 2023-2028 ($ million)
- Exhibits90: Data Table on Canada - Market size and forecast 2023-2028 ($ million)
- Exhibits91: Chart on Canada - Year-over-year growth 2023-2028 (%)
- Exhibits92: Data Table on Canada - Year-over-year growth 2023-2028 (%)
- Exhibits93: Chart on Germany - Market size and forecast 2023-2028 ($ million)
- Exhibits94: Data Table on Germany - Market size and forecast 2023-2028 ($ million)
- Exhibits95: Chart on Germany - Year-over-year growth 2023-2028 (%)
- Exhibits96: Data Table on Germany - Year-over-year growth 2023-2028 (%)
- Exhibits97: Chart on UK - Market size and forecast 2023-2028 ($ million)
- Exhibits98: Data Table on UK - Market size and forecast 2023-2028 ($ million)
- Exhibits99: Chart on UK - Year-over-year growth 2023-2028 (%)
- Exhibits100: Data Table on UK - Year-over-year growth 2023-2028 (%)
- Exhibits101: Chart on China - Market size and forecast 2023-2028 ($ million)
- Exhibits102: Data Table on China - Market size and forecast 2023-2028 ($ million)
- Exhibits103: Chart on China - Year-over-year growth 2023-2028 (%)
- Exhibits104: Data Table on China - Year-over-year growth 2023-2028 (%)
- Exhibits105: Market opportunity By Geographical Landscape ($ million)
- Exhibits106: Data Tables on Market opportunity By Geographical Landscape ($ million)
- Exhibits107: Impact of drivers and challenges in 2023 and 2028
- Exhibits108: Overview on criticality of inputs and factors of differentiation
- Exhibits109: Overview on factors of disruption
- Exhibits110: Impact of key risks on business
- Exhibits111: Companies covered
- Exhibits112: Matrix on companies position and classification
- Exhibits113: All Medical Waste Australia Pty Ltd. - Overview
- Exhibits114: All Medical Waste Australia Pty Ltd. - Product / Service
- Exhibits115: All Medical Waste Australia Pty Ltd. - Key offerings
- Exhibits116: BioMedical Waste Solutions LLC - Overview
- Exhibits117: BioMedical Waste Solutions LLC - Product / Service
- Exhibits118: BioMedical Waste Solutions LLC - Key offerings
- Exhibits119: BWS Inc. - Overview
- Exhibits120: BWS Inc. - Product / Service
- Exhibits121: BWS Inc. - Key offerings
- Exhibits122: Casella Waste Systems Inc. - Overview
- Exhibits123: Casella Waste Systems Inc. - Business segments
- Exhibits124: Casella Waste Systems Inc. - Key offerings
- Exhibits125: Casella Waste Systems Inc. - Segment focus
- Exhibits126: Clean Harbors Inc. - Overview
- Exhibits127: Clean Harbors Inc. - Business segments
- Exhibits128: Clean Harbors Inc. - Key news
- Exhibits129: Clean Harbors Inc. - Key offerings
- Exhibits130: Clean Harbors Inc. - Segment focus
- Exhibits131: Daniels Health - Overview
- Exhibits132: Daniels Health - Product / Service
- Exhibits133: Daniels Health - Key offerings
- Exhibits134: EPCO - Overview
- Exhibits135: EPCO - Product / Service
- Exhibits136: EPCO - Key offerings
- Exhibits137: Gamma Waste Systems - Overview
- Exhibits138: Gamma Waste Systems - Product / Service
- Exhibits139: Gamma Waste Systems - Key offerings
- Exhibits140: Larson Miller Inc. - Overview
- Exhibits141: Larson Miller Inc. - Product / Service
- Exhibits142: Larson Miller Inc. - Key offerings
- Exhibits143: MEDPRO Disposal LLC - Overview
- Exhibits144: MEDPRO Disposal LLC - Product / Service
- Exhibits145: MEDPRO Disposal LLC - Key offerings
- Exhibits146: Stericycle Inc. - Overview
- Exhibits147: Stericycle Inc. - Business segments
- Exhibits148: Stericycle Inc. - Key offerings
- Exhibits149: Stericycle Inc. - Segment focus
- Exhibits150: Trilogy MedWaste Inc. - Overview
- Exhibits151: Trilogy MedWaste Inc. - Product / Service
- Exhibits152: Trilogy MedWaste Inc. - Key offerings
- Exhibits153: Triumvirate Environmental - Overview
- Exhibits154: Triumvirate Environmental - Product / Service
- Exhibits155: Triumvirate Environmental - Key offerings
- Exhibits156: Veolia Environnement SA - Overview
- Exhibits157: Veolia Environnement SA - Business segments
- Exhibits158: Veolia Environnement SA - Key news
- Exhibits159: Veolia Environnement SA - Key offerings
- Exhibits160: Veolia Environnement SA - Segment focus
- Exhibits161: Waste Management Inc. - Overview
- Exhibits162: Waste Management Inc. - Business segments
- Exhibits163: Waste Management Inc. - Key news
- Exhibits164: Waste Management Inc. - Key offerings
- Exhibits165: Waste Management Inc. - Segment focus
- Exhibits166: Inclusions checklist
- Exhibits167: Exclusions checklist
- Exhibits168: Currency conversion rates for US$
- Exhibits169: Research methodology
- Exhibits170: Information sources
- Exhibits171: Data validation
- Exhibits172: Validation techniques employed for market sizing
- Exhibits173: Data synthesis
- Exhibits174: 360 degree market analysis
- Exhibits175: List of abbreviations
The medical waste management market is forecasted to grow by USD 3821.6 mn during 2023-2028, accelerating at a CAGR of 5.97% during the forecast period. The report on the medical waste management market provides a holistic analysis, market size and forecast, trends, growth drivers, and challenges, as well as vendor analysis covering around 25 vendors.
The report offers an up-to-date analysis regarding the current market scenario, the latest trends and drivers, and the overall market environment. The market is driven by growing healthcare industry, growing environmental concerns, and increasing adoption of outsourcing.
Technavio's medical waste management market is segmented as below:
| Market Scope | |
|---|---|
| Base Year | 2024 |
| End Year | 2028 |
| Series Year | 2024-2028 |
| Growth Momentum | Accelerate |
| YOY 2024 | 5.27% |
| CAGR | 5.97% |
| Incremental Value | $3821.6 mn |
By Type
- Non-hazardous
- Hazardous
By Technique
- Offsite treatment
- Onsite treatment
By Geographical Landscape
- North America
- Europe
- APAC
- South America
- Middle East and Africa
This study identifies the advancement in technology as one of the prime reasons driving the medical waste management market growth during the next few years. Also, adoption of sustainable and eco-friendly solutions and stringent regulations on medical waste management will lead to sizable demand in the market.
The report on the medical waste management market covers the following areas:
- Medical waste management market sizing
- Medical waste management market forecast
- Medical waste management market industry analysis
The robust vendor analysis is designed to help clients improve their market position, and in line with this, this report provides a detailed analysis of several leading medical waste management market vendors that include Advanced Micro Devices Inc., All Medical Waste Australia Pty Ltd., BioMedical Waste Solutions LLC, BWS Inc., Casella Waste Systems Inc., Clean Harbors Inc., Daniels Health, EcoMed Services, EPCO, Gamma Waste Systems, GIC Medical Disposal Inc., GRP and Associates Inc., Hawaii Bio Waste Systems Inc., Larson Miller Inc., MEDPRO Disposal LLC, Stericycle Inc., Trilogy MedWaste Inc., Triumvirate Environmental, Veolia Environnement SA, and Waste Management Inc.. Also, the medical waste management market analysis report includes information on upcoming trends and challenges that will influence market growth. This is to help companies strategize and leverage all forthcoming growth opportunities.
The study was conducted using an objective combination of primary and secondary information including inputs from key participants in the industry. The report contains a comprehensive market and vendor landscape in addition to an analysis of the key vendors.
The publisher presents a detailed picture of the market by the way of study, synthesis, and summation of data from multiple sources by an analysis of key parameters such as profit, pricing, competition, and promotions. It presents various market facets by identifying the key industry influencers. The data presented is comprehensive, reliable, and a result of extensive research - both primary and secondary. The market research reports provide a complete competitive landscape and an in-depth vendor selection methodology and analysis using qualitative and quantitative research to forecast the accurate market growth.
Table of Contents
1 Executive Summary
- 1.1 Market overview
- Executive Summary - Chart on Market Overview
- Executive Summary - Data Table on Market Overview
- Executive Summary - Chart on Global Market Characteristics
- Executive Summary - Chart on Market By Geographical Landscape
- Executive Summary - Chart on Market Segmentation by Type
- Executive Summary - Chart on Market Segmentation by Technique
- Executive Summary - Chart on Incremental Growth
- Executive Summary - Data Table on Incremental Growth
- Executive Summary - Chart on Company Market Positioning
2 Market Landscape
- 2.1 Market ecosystem
- Parent Market
- Data Table on - Parent Market
- 2.2 Market characteristics
- Market characteristics analysis
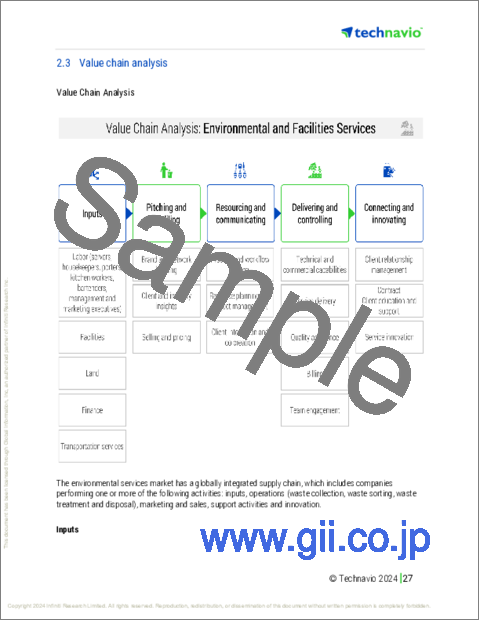
- 2.3 Value chain analysis
- Value Chain Analysis
3 Market Sizing
- 3.1 Market definition
- Offerings of companies included in the market definition
- 3.2 Market segment analysis
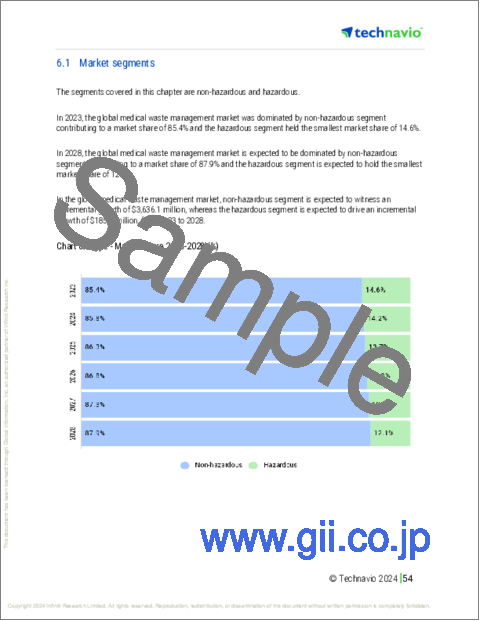
- Market segments
- 3.3 Market size 2023
- 3.4 Market outlook: Forecast for 2023-2028
- Chart on Global - Market size and forecast 2023-2028 ($ million)
- Data Table on Global - Market size and forecast 2023-2028 ($ million)
- Chart on Global Market: Year-over-year growth 2023-2028 (%)
- Data Table on Global Market: Year-over-year growth 2023-2028 (%)
4 Historic Market Size
- 4.1 Global Medical Waste Management Market 2018 - 2022
- Historic Market Size - Data Table on Global Medical Waste Management Market 2018 - 2022 ($ million)
- 4.2 Type segment analysis 2018 - 2022
- Historic Market Size - Type Segment 2018 - 2022 ($ million)
- 4.3 Technique segment analysis 2018 - 2022
- Historic Market Size - Technique Segment 2018 - 2022 ($ million)
- 4.4 Geography segment analysis 2018 - 2022
- Historic Market Size - Geography Segment 2018 - 2022 ($ million)
- 4.5 Country segment analysis 2018 - 2022
- Historic Market Size - Country Segment 2018 - 2022 ($ million)
5 Five Forces Analysis
- 5.1 Five forces summary
- Five forces analysis - Comparison between 2023 and 2028
- 5.2 Bargaining power of buyers
- Bargaining power of buyers - Impact of key factors 2023 and 2028
- 5.3 Bargaining power of suppliers
- Bargaining power of suppliers - Impact of key factors in 2023 and 2028
- 5.4 Threat of new entrants
- Threat of new entrants - Impact of key factors in 2023 and 2028
- 5.5 Threat of substitutes
- Threat of substitutes - Impact of key factors in 2023 and 2028
- 5.6 Threat of rivalry
- Threat of rivalry - Impact of key factors in 2023 and 2028
- 5.7 Market condition
- Chart on Market condition - Five forces 2023 and 2028
6 Market Segmentation by Type
- 6.1 Market segments
- Chart on Type - Market share 2023-2028 (%)
- Data Table on Type - Market share 2023-2028 (%)
- 6.2 Comparison by Type
- Chart on Comparison by Type
- Data Table on Comparison by Type
- 6.3 Non-hazardous - Market size and forecast 2023-2028
- Chart on Non-hazardous - Market size and forecast 2023-2028 ($ million)
- Data Table on Non-hazardous - Market size and forecast 2023-2028 ($ million)
- Chart on Non-hazardous - Year-over-year growth 2023-2028 (%)
- Data Table on Non-hazardous - Year-over-year growth 2023-2028 (%)
- 6.4 Hazardous - Market size and forecast 2023-2028
- Chart on Hazardous - Market size and forecast 2023-2028 ($ million)
- Data Table on Hazardous - Market size and forecast 2023-2028 ($ million)
- Chart on Hazardous - Year-over-year growth 2023-2028 (%)
- Data Table on Hazardous - Year-over-year growth 2023-2028 (%)
- 6.5 Market opportunity by Type
- Market opportunity by Type ($ million)
- Data Table on Market opportunity by Type ($ million)
7 Market Segmentation by Technique
- 7.1 Market segments
- Chart on Technique - Market share 2023-2028 (%)
- Data Table on Technique - Market share 2023-2028 (%)
- 7.2 Comparison by Technique
- Chart on Comparison by Technique
- Data Table on Comparison by Technique
- 7.3 Offsite treatment - Market size and forecast 2023-2028
- Chart on Offsite treatment - Market size and forecast 2023-2028 ($ million)
- Data Table on Offsite treatment - Market size and forecast 2023-2028 ($ million)
- Chart on Offsite treatment - Year-over-year growth 2023-2028 (%)
- Data Table on Offsite treatment - Year-over-year growth 2023-2028 (%)
- 7.4 Onsite treatment - Market size and forecast 2023-2028
- Chart on Onsite treatment - Market size and forecast 2023-2028 ($ million)
- Data Table on Onsite treatment - Market size and forecast 2023-2028 ($ million)
- Chart on Onsite treatment - Year-over-year growth 2023-2028 (%)
- Data Table on Onsite treatment - Year-over-year growth 2023-2028 (%)
- 7.5 Market opportunity by Technique
- Market opportunity by Technique ($ million)
- Data Table on Market opportunity by Technique ($ million)
8 Customer Landscape
- 8.1 Customer landscape overview
- Analysis of price sensitivity, lifecycle, customer purchase basket, adoption rates, and purchase criteria
9 Geographic Landscape
- 9.1 Geographic segmentation
- Chart on Market share By Geographical Landscape 2023-2028 (%)
- Data Table on Market share By Geographical Landscape 2023-2028 (%)
- 9.2 Geographic comparison
- Chart on Geographic comparison
- Data Table on Geographic comparison
- 9.3 North America - Market size and forecast 2023-2028
- Chart on North America - Market size and forecast 2023-2028 ($ million)
- Data Table on North America - Market size and forecast 2023-2028 ($ million)
- Chart on North America - Year-over-year growth 2023-2028 (%)
- Data Table on North America - Year-over-year growth 2023-2028 (%)
- 9.4 Europe - Market size and forecast 2023-2028
- Chart on Europe - Market size and forecast 2023-2028 ($ million)
- Data Table on Europe - Market size and forecast 2023-2028 ($ million)
- Chart on Europe - Year-over-year growth 2023-2028 (%)
- Data Table on Europe - Year-over-year growth 2023-2028 (%)
- 9.5 APAC - Market size and forecast 2023-2028
- Chart on APAC - Market size and forecast 2023-2028 ($ million)
- Data Table on APAC - Market size and forecast 2023-2028 ($ million)
- Chart on APAC - Year-over-year growth 2023-2028 (%)
- Data Table on APAC - Year-over-year growth 2023-2028 (%)
- 9.6 South America - Market size and forecast 2023-2028
- Chart on South America - Market size and forecast 2023-2028 ($ million)
- Data Table on South America - Market size and forecast 2023-2028 ($ million)
- Chart on South America - Year-over-year growth 2023-2028 (%)
- Data Table on South America - Year-over-year growth 2023-2028 (%)
- 9.7 Middle East and Africa - Market size and forecast 2023-2028
- Chart on Middle East and Africa - Market size and forecast 2023-2028 ($ million)
- Data Table on Middle East and Africa - Market size and forecast 2023-2028 ($ million)
- Chart on Middle East and Africa - Year-over-year growth 2023-2028 (%)
- Data Table on Middle East and Africa - Year-over-year growth 2023-2028 (%)
- 9.8 US - Market size and forecast 2023-2028
- Chart on US - Market size and forecast 2023-2028 ($ million)
- Data Table on US - Market size and forecast 2023-2028 ($ million)
- Chart on US - Year-over-year growth 2023-2028 (%)
- Data Table on US - Year-over-year growth 2023-2028 (%)
- 9.9 Canada - Market size and forecast 2023-2028
- Chart on Canada - Market size and forecast 2023-2028 ($ million)
- Data Table on Canada - Market size and forecast 2023-2028 ($ million)
- Chart on Canada - Year-over-year growth 2023-2028 (%)
- Data Table on Canada - Year-over-year growth 2023-2028 (%)
- 9.10 Germany - Market size and forecast 2023-2028
- Chart on Germany - Market size and forecast 2023-2028 ($ million)
- Data Table on Germany - Market size and forecast 2023-2028 ($ million)
- Chart on Germany - Year-over-year growth 2023-2028 (%)
- Data Table on Germany - Year-over-year growth 2023-2028 (%)
- 9.11 UK - Market size and forecast 2023-2028
- Chart on UK - Market size and forecast 2023-2028 ($ million)
- Data Table on UK - Market size and forecast 2023-2028 ($ million)
- Chart on UK - Year-over-year growth 2023-2028 (%)
- Data Table on UK - Year-over-year growth 2023-2028 (%)
- 9.12 China - Market size and forecast 2023-2028
- Chart on China - Market size and forecast 2023-2028 ($ million)
- Data Table on China - Market size and forecast 2023-2028 ($ million)
- Chart on China - Year-over-year growth 2023-2028 (%)
- Data Table on China - Year-over-year growth 2023-2028 (%)
- 9.13 Market opportunity By Geographical Landscape
- Market opportunity By Geographical Landscape ($ million)
- Data Tables on Market opportunity By Geographical Landscape ($ million)
10 Drivers, Challenges, and Opportunity/Restraints
- 10.1 Market drivers
- 10.2 Market challenges
- 10.3 Impact of drivers and challenges
- Impact of drivers and challenges in 2023 and 2028
- 10.4 Market opportunities/restraints
11 Competitive Landscape
- 11.1 Overview
- 11.2 Competitive Landscape
- Overview on criticality of inputs and factors of differentiation
- 11.3 Landscape disruption
- Overview on factors of disruption
- 11.4 Industry risks
- Impact of key risks on business
12 Competitive Analysis
- 12.1 Companies profiled
- Companies covered
- 12.2 Market positioning of companies
- Matrix on companies position and classification
- 12.3 All Medical Waste Australia Pty Ltd.
- All Medical Waste Australia Pty Ltd. - Overview
- All Medical Waste Australia Pty Ltd. - Product / Service
- All Medical Waste Australia Pty Ltd. - Key offerings
- 12.4 BioMedical Waste Solutions LLC
- BioMedical Waste Solutions LLC - Overview
- BioMedical Waste Solutions LLC - Product / Service
- BioMedical Waste Solutions LLC - Key offerings
- 12.5 BWS Inc.
- BWS Inc. - Overview
- BWS Inc. - Product / Service
- BWS Inc. - Key offerings
- 12.6 Casella Waste Systems Inc.
- Casella Waste Systems Inc. - Overview
- Casella Waste Systems Inc. - Business segments
- Casella Waste Systems Inc. - Key offerings
- Casella Waste Systems Inc. - Segment focus
- 12.7 Clean Harbors Inc.
- Clean Harbors Inc. - Overview
- Clean Harbors Inc. - Business segments
- Clean Harbors Inc. - Key news
- Clean Harbors Inc. - Key offerings
- Clean Harbors Inc. - Segment focus
- 12.8 Daniels Health
- Daniels Health - Overview
- Daniels Health - Product / Service
- Daniels Health - Key offerings
- 12.9 EPCO
- EPCO - Overview
- EPCO - Product / Service
- EPCO - Key offerings
- 12.10 Gamma Waste Systems
- Gamma Waste Systems - Overview
- Gamma Waste Systems - Product / Service
- Gamma Waste Systems - Key offerings
- 12.11 Larson Miller Inc.
- Larson Miller Inc. - Overview
- Larson Miller Inc. - Product / Service
- Larson Miller Inc. - Key offerings
- 12.12 MEDPRO Disposal LLC
- MEDPRO Disposal LLC - Overview
- MEDPRO Disposal LLC - Product / Service
- MEDPRO Disposal LLC - Key offerings
- 12.13 Stericycle Inc.
- Stericycle Inc. - Overview
- Stericycle Inc. - Business segments
- Stericycle Inc. - Key offerings
- Stericycle Inc. - Segment focus
- 12.14 Trilogy MedWaste Inc.
- Trilogy MedWaste Inc. - Overview
- Trilogy MedWaste Inc. - Product / Service
- Trilogy MedWaste Inc. - Key offerings
- 12.15 Triumvirate Environmental
- Triumvirate Environmental - Overview
- Triumvirate Environmental - Product / Service
- Triumvirate Environmental - Key offerings
- 12.16 Veolia Environnement SA
- Veolia Environnement SA - Overview
- Veolia Environnement SA - Business segments
- Veolia Environnement SA - Key news
- Veolia Environnement SA - Key offerings
- Veolia Environnement SA - Segment focus
- 12.17 Waste Management Inc.
- Waste Management Inc. - Overview
- Waste Management Inc. - Business segments
- Waste Management Inc. - Key news
- Waste Management Inc. - Key offerings
- Waste Management Inc. - Segment focus
13 Appendix
- 13.1 Scope of the report
- 13.2 Inclusions and exclusions checklist
- Inclusions checklist
- Exclusions checklist
- 13.3 Currency conversion rates for US$
- Currency conversion rates for US$
- 13.4 Research methodology
- Research methodology
- 13.5 Data procurement
- Information sources
- 13.6 Data validation
- Data validation
- 13.7 Validation techniques employed for market sizing
- Validation techniques employed for market sizing
- 13.8 Data synthesis
- Data synthesis
- 13.9 360 degree market analysis
- 360 degree market analysis
- 13.10 List of abbreviations
- List of abbreviations

