|
|
市場調査レポート
商品コード
1524890
抗血栓薬の世界市場 2024-2028Global antithrombotic drugs market 2024-2028 |
||||||

|
|||||||
カスタマイズ可能
|
|||||||

| 抗血栓薬の世界市場 2024-2028 |
|
出版日: 2024年07月03日
発行: TechNavio
ページ情報: 英文 161 Pages
納期: 即納可能
|

全表示
- 概要
- 図表
- 目次
抗血栓薬市場は2023-2028年に217億8,380万米ドル、予測期間中のCAGRは7.68%で成長すると予測されます。
当レポートでは、抗血栓薬市場の全体的な分析、市場規模・予測、動向、成長促進要因、課題、約25のベンダーを網羅したベンダー分析などを掲載しています。
現在の市場シナリオ、最新動向と促進要因、市場環境全体に関する最新分析を提供しています。凝固障害の有病率の増加、新規経口抗凝固薬のイントロダクション、強力なR&Dパイプラインの構築などが市場を牽引しています。
| 市場範囲 | |
|---|---|
| 基準年 | 2024 |
| 終了年 | 2028 |
| 予測期間 | 2024-2028 |
| 成長モメンタム | 加速 |
| 前年比2024年 | 7.32% |
| CAGR | 7.68% |
| 増分額 | 217億8,380万米ドル |
本調査では、今後数年間の抗血栓薬市場成長を牽引する主要因の1つとして、抗凝固解毒剤の登場を挙げています。また、市場重視の企業の戦略的提携や買収、市場重視の発展が市場の大きな需要につながります。
目次
第1章 エグゼクティブサマリー
- 市場概要
第2章 市場情勢
- 市場エコシステム
- 市場の特徴
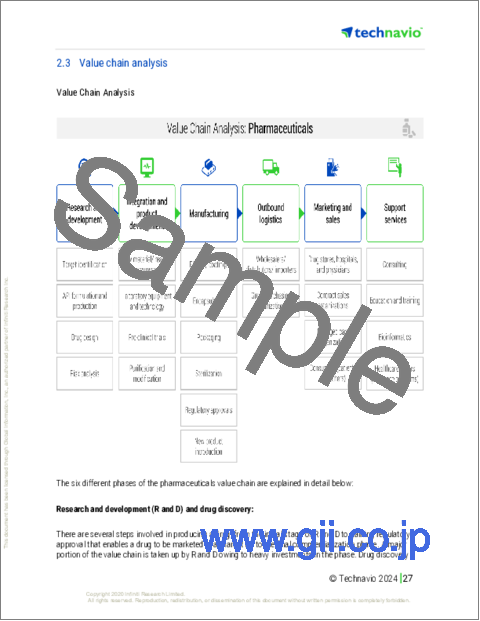
- バリューチェーン分析
第3章 市場規模の評価
- 市場の定義
- 市場セグメント分析
- 市場規模 2023
- 市場の見通し 2023-2028
第4章 市場規模実績
- 世界抗血栓薬市場 2018-2022
- 投与経路別セグメント分析 2018-2022
- 流通チャネル別セグメント分析 2018-2022
- 地域別セグメント分析 2018-2022
- 国別セグメント分析 2018-2022
第5章 ファイブフォース分析
- ファイブフォースの要約
- 買い手の交渉力
- 供給企業の交渉力
- 新規参入業者の脅威
- 代替品の脅威
- 競争の脅威
- 市況
第6章 市場セグメンテーション:投与経路別
- 市場セグメンテーション
- 比較:投与経路別
- 経口:市場規模と予測 2023-2028
- 注射可能:市場規模と予測 2023-2028
- 市場機会:投与経路別
第7章 市場セグメンテーション:流通チャネル別
- 市場セグメンテーション
- 比較:流通チャネル別
- 病院薬局:市場規模と予測 2023-2028
- 小売薬局:市場規模と予測 2023-2028
- オンライン薬局:市場規模と予測 2023-2028
- 市場機会:流通チャネル別
第8章 顧客情勢
- 顧客情勢の概要
第9章 地域別情勢
- 地域別セグメンテーション
- 地域別比較
- 北米:市場規模と予測 2023-2028
- 欧州:市場規模と予測 2023-2028
- アジア:市場規模と予測 2023-2028
- 世界のその他の地域:市場規模と予測 2023-2028
- 米国:市場規模と予測 2023-2028
- ドイツ:市場規模と予測 2023-2028
- 英国:市場規模と予測 2023-2028
- 日本:市場規模と予測 2023-2028
- カナダ:市場規模と予測 2023-2028
- 市場機会:地域情勢別
第10章 促進要因・課題・機会・抑制要因
- 市場促進要因
- 市場の課題
- 促進要因と課題の影響
- 市場の機会・抑制要因
第11章 競合情勢
- 概要
- 競合情勢
- 混乱の状況
- 業界のリスク
第12章 競合分析
- 企業プロファイル
- 企業の市場ポジショニング
- Aspen Pharmacare Holdings Ltd.
- AstraZeneca Plc
- Bayer AG
- Boehringer Ingelheim International GmbH
- Bristol Myers Squibb Co.
- Daiichi Sankyo Co. Ltd.
- Eli Lilly and Co.
- F. Hoffmann La Roche Ltd.
- Fresenius Kabi AG
- Hikma Pharmaceuticals Plc
- Novartis AG
- Otsuka Pharmaceutical Co. Ltd.
- Sanofi SA
- Teva Pharmaceutical Industries Ltd.
- Viatris Inc.
第13章 付録
Exhibits:
- Exhibits1: Executive Summary - Chart on Market Overview
- Exhibits2: Executive Summary - Data Table on Market Overview
- Exhibits3: Executive Summary - Chart on Global Market Characteristics
- Exhibits4: Executive Summary - Chart on Market By Geographical Landscape
- Exhibits5: Executive Summary - Chart on Market Segmentation by Route of Administration
- Exhibits6: Executive Summary - Chart on Market Segmentation by Distribution Channel
- Exhibits7: Executive Summary - Chart on Incremental Growth
- Exhibits8: Executive Summary - Data Table on Incremental Growth
- Exhibits9: Executive Summary - Chart on Company Market Positioning
- Exhibits10: Parent Market
- Exhibits11: Data Table on - Parent Market
- Exhibits12: Market characteristics analysis
- Exhibits13: Value Chain Analysis
- Exhibits14: Offerings of companies included in the market definition
- Exhibits15: Market segments
- Exhibits16: Chart on Global - Market size and forecast 2023-2028 ($ million)
- Exhibits17: Data Table on Global - Market size and forecast 2023-2028 ($ million)
- Exhibits18: Chart on Global Market: Year-over-year growth 2023-2028 (%)
- Exhibits19: Data Table on Global Market: Year-over-year growth 2023-2028 (%)
- Exhibits20: Historic Market Size - Data Table on Global Antithrombotic Drugs Market 2018 - 2022 ($ million)
- Exhibits21: Historic Market Size - Route of Administration Segment 2018 - 2022 ($ million)
- Exhibits22: Historic Market Size - Distribution Channel Segment 2018 - 2022 ($ million)
- Exhibits23: Historic Market Size - Geography Segment 2018 - 2022 ($ million)
- Exhibits24: Historic Market Size - Country Segment 2018 - 2022 ($ million)
- Exhibits25: Five forces analysis - Comparison between 2023 and 2028
- Exhibits26: Bargaining power of buyers - Impact of key factors 2023 and 2028
- Exhibits27: Bargaining power of suppliers - Impact of key factors in 2023 and 2028
- Exhibits28: Threat of new entrants - Impact of key factors in 2023 and 2028
- Exhibits29: Threat of substitutes - Impact of key factors in 2023 and 2028
- Exhibits30: Threat of rivalry - Impact of key factors in 2023 and 2028
- Exhibits31: Chart on Market condition - Five forces 2023 and 2028
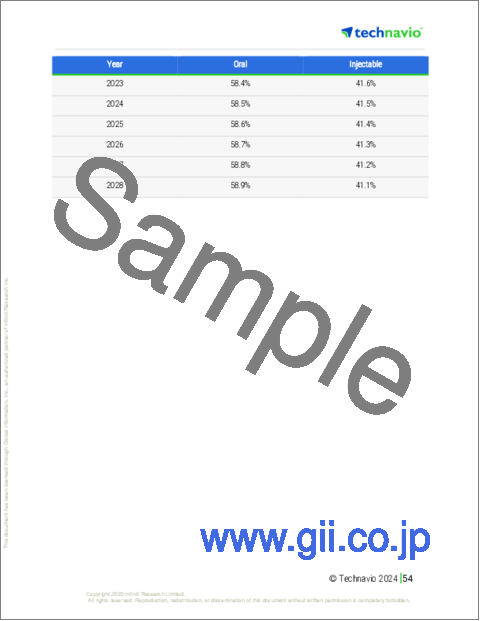
- Exhibits32: Chart on Route of Administration - Market share 2023-2028 (%)
- Exhibits33: Data Table on Route of Administration - Market share 2023-2028 (%)
- Exhibits34: Chart on Comparison by Route of Administration
- Exhibits35: Data Table on Comparison by Route of Administration
- Exhibits36: Chart on Oral - Market size and forecast 2023-2028 ($ million)
- Exhibits37: Data Table on Oral - Market size and forecast 2023-2028 ($ million)
- Exhibits38: Chart on Oral - Year-over-year growth 2023-2028 (%)
- Exhibits39: Data Table on Oral - Year-over-year growth 2023-2028 (%)
- Exhibits40: Chart on Injectable - Market size and forecast 2023-2028 ($ million)
- Exhibits41: Data Table on Injectable - Market size and forecast 2023-2028 ($ million)
- Exhibits42: Chart on Injectable - Year-over-year growth 2023-2028 (%)
- Exhibits43: Data Table on Injectable - Year-over-year growth 2023-2028 (%)
- Exhibits44: Market opportunity by Route of Administration ($ million)
- Exhibits45: Data Table on Market opportunity by Route of Administration ($ million)
- Exhibits46: Chart on Distribution Channel - Market share 2023-2028 (%)
- Exhibits47: Data Table on Distribution Channel - Market share 2023-2028 (%)
- Exhibits48: Chart on Comparison by Distribution Channel
- Exhibits49: Data Table on Comparison by Distribution Channel
- Exhibits50: Chart on Hospital pharmacy - Market size and forecast 2023-2028 ($ million)
- Exhibits51: Data Table on Hospital pharmacy - Market size and forecast 2023-2028 ($ million)
- Exhibits52: Chart on Hospital pharmacy - Year-over-year growth 2023-2028 (%)
- Exhibits53: Data Table on Hospital pharmacy - Year-over-year growth 2023-2028 (%)
- Exhibits54: Chart on Retail pharmacy - Market size and forecast 2023-2028 ($ million)
- Exhibits55: Data Table on Retail pharmacy - Market size and forecast 2023-2028 ($ million)
- Exhibits56: Chart on Retail pharmacy - Year-over-year growth 2023-2028 (%)
- Exhibits57: Data Table on Retail pharmacy - Year-over-year growth 2023-2028 (%)
- Exhibits58: Chart on Online pharmacy - Market size and forecast 2023-2028 ($ million)
- Exhibits59: Data Table on Online pharmacy - Market size and forecast 2023-2028 ($ million)
- Exhibits60: Chart on Online pharmacy - Year-over-year growth 2023-2028 (%)
- Exhibits61: Data Table on Online pharmacy - Year-over-year growth 2023-2028 (%)
- Exhibits62: Market opportunity by Distribution Channel ($ million)
- Exhibits63: Data Table on Market opportunity by Distribution Channel ($ million)
- Exhibits64: Analysis of price sensitivity, lifecycle, customer purchase basket, adoption rates, and purchase criteria
- Exhibits65: Chart on Market share By Geographical Landscape 2023-2028 (%)
- Exhibits66: Data Table on Market share By Geographical Landscape 2023-2028 (%)
- Exhibits67: Chart on Geographic comparison
- Exhibits68: Data Table on Geographic comparison
- Exhibits69: Chart on North America - Market size and forecast 2023-2028 ($ million)
- Exhibits70: Data Table on North America - Market size and forecast 2023-2028 ($ million)
- Exhibits71: Chart on North America - Year-over-year growth 2023-2028 (%)
- Exhibits72: Data Table on North America - Year-over-year growth 2023-2028 (%)
- Exhibits73: Chart on Europe - Market size and forecast 2023-2028 ($ million)
- Exhibits74: Data Table on Europe - Market size and forecast 2023-2028 ($ million)
- Exhibits75: Chart on Europe - Year-over-year growth 2023-2028 (%)
- Exhibits76: Data Table on Europe - Year-over-year growth 2023-2028 (%)
- Exhibits77: Chart on Asia - Market size and forecast 2023-2028 ($ million)
- Exhibits78: Data Table on Asia - Market size and forecast 2023-2028 ($ million)
- Exhibits79: Chart on Asia - Year-over-year growth 2023-2028 (%)
- Exhibits80: Data Table on Asia - Year-over-year growth 2023-2028 (%)
- Exhibits81: Chart on Rest of World (ROW) - Market size and forecast 2023-2028 ($ million)
- Exhibits82: Data Table on Rest of World (ROW) - Market size and forecast 2023-2028 ($ million)
- Exhibits83: Chart on Rest of World (ROW) - Year-over-year growth 2023-2028 (%)
- Exhibits84: Data Table on Rest of World (ROW) - Year-over-year growth 2023-2028 (%)
- Exhibits85: Chart on US - Market size and forecast 2023-2028 ($ million)
- Exhibits86: Data Table on US - Market size and forecast 2023-2028 ($ million)
- Exhibits87: Chart on US - Year-over-year growth 2023-2028 (%)
- Exhibits88: Data Table on US - Year-over-year growth 2023-2028 (%)
- Exhibits89: Chart on Germany - Market size and forecast 2023-2028 ($ million)
- Exhibits90: Data Table on Germany - Market size and forecast 2023-2028 ($ million)
- Exhibits91: Chart on Germany - Year-over-year growth 2023-2028 (%)
- Exhibits92: Data Table on Germany - Year-over-year growth 2023-2028 (%)
- Exhibits93: Chart on UK - Market size and forecast 2023-2028 ($ million)
- Exhibits94: Data Table on UK - Market size and forecast 2023-2028 ($ million)
- Exhibits95: Chart on UK - Year-over-year growth 2023-2028 (%)
- Exhibits96: Data Table on UK - Year-over-year growth 2023-2028 (%)
- Exhibits97: Chart on Japan - Market size and forecast 2023-2028 ($ million)
- Exhibits98: Data Table on Japan - Market size and forecast 2023-2028 ($ million)
- Exhibits99: Chart on Japan - Year-over-year growth 2023-2028 (%)
- Exhibits100: Data Table on Japan - Year-over-year growth 2023-2028 (%)
- Exhibits101: Chart on Canada - Market size and forecast 2023-2028 ($ million)
- Exhibits102: Data Table on Canada - Market size and forecast 2023-2028 ($ million)
- Exhibits103: Chart on Canada - Year-over-year growth 2023-2028 (%)
- Exhibits104: Data Table on Canada - Year-over-year growth 2023-2028 (%)
- Exhibits105: Market opportunity By Geographical Landscape ($ million)
- Exhibits106: Data Tables on Market opportunity By Geographical Landscape ($ million)
- Exhibits107: Impact of drivers and challenges in 2023 and 2028
- Exhibits108: Overview on criticality of inputs and factors of differentiation
- Exhibits109: Overview on factors of disruption
- Exhibits110: Impact of key risks on business
- Exhibits111: Companies covered
- Exhibits112: Matrix on companies position and classification
- Exhibits113: Aspen Pharmacare Holdings Ltd. - Overview
- Exhibits114: Aspen Pharmacare Holdings Ltd. - Business segments
- Exhibits115: Aspen Pharmacare Holdings Ltd. - Key offerings
- Exhibits116: Aspen Pharmacare Holdings Ltd. - Segment focus
- Exhibits117: AstraZeneca Plc - Overview
- Exhibits118: AstraZeneca Plc - Product / Service
- Exhibits119: AstraZeneca Plc - Key news
- Exhibits120: AstraZeneca Plc - Key offerings
- Exhibits121: Bayer AG - Overview
- Exhibits122: Bayer AG - Business segments
- Exhibits123: Bayer AG - Key news
- Exhibits124: Bayer AG - Key offerings
- Exhibits125: Bayer AG - Segment focus
- Exhibits126: Boehringer Ingelheim International GmbH - Overview
- Exhibits127: Boehringer Ingelheim International GmbH - Product / Service
- Exhibits128: Boehringer Ingelheim International GmbH - Key news
- Exhibits129: Boehringer Ingelheim International GmbH - Key offerings
- Exhibits130: Bristol Myers Squibb Co. - Overview
- Exhibits131: Bristol Myers Squibb Co. - Product / Service
- Exhibits132: Bristol Myers Squibb Co. - Key news
- Exhibits133: Bristol Myers Squibb Co. - Key offerings
- Exhibits134: Daiichi Sankyo Co. Ltd. - Overview
- Exhibits135: Daiichi Sankyo Co. Ltd. - Product / Service
- Exhibits136: Daiichi Sankyo Co. Ltd. - Key news
- Exhibits137: Daiichi Sankyo Co. Ltd. - Key offerings
- Exhibits138: Eli Lilly and Co. - Overview
- Exhibits139: Eli Lilly and Co. - Product / Service
- Exhibits140: Eli Lilly and Co. - Key news
- Exhibits141: Eli Lilly and Co. - Key offerings
- Exhibits142: F. Hoffmann La Roche Ltd. - Overview
- Exhibits143: F. Hoffmann La Roche Ltd. - Business segments
- Exhibits144: F. Hoffmann La Roche Ltd. - Key news
- Exhibits145: F. Hoffmann La Roche Ltd. - Key offerings
- Exhibits146: F. Hoffmann La Roche Ltd. - Segment focus
- Exhibits147: Fresenius Kabi AG - Overview
- Exhibits148: Fresenius Kabi AG - Business segments
- Exhibits149: Fresenius Kabi AG - Key offerings
- Exhibits150: Fresenius Kabi AG - Segment focus
- Exhibits151: Hikma Pharmaceuticals Plc - Overview
- Exhibits152: Hikma Pharmaceuticals Plc - Business segments
- Exhibits153: Hikma Pharmaceuticals Plc - Key news
- Exhibits154: Hikma Pharmaceuticals Plc - Key offerings
- Exhibits155: Hikma Pharmaceuticals Plc - Segment focus
- Exhibits156: Novartis AG - Overview
- Exhibits157: Novartis AG - Business segments
- Exhibits158: Novartis AG - Key news
- Exhibits159: Novartis AG - Key offerings
- Exhibits160: Novartis AG - Segment focus
- Exhibits161: Otsuka Pharmaceutical Co. Ltd. - Overview
- Exhibits162: Otsuka Pharmaceutical Co. Ltd. - Product / Service
- Exhibits163: Otsuka Pharmaceutical Co. Ltd. - Key offerings
- Exhibits164: Sanofi SA - Overview
- Exhibits165: Sanofi SA - Business segments
- Exhibits166: Sanofi SA - Key news
- Exhibits167: Sanofi SA - Key offerings
- Exhibits168: Sanofi SA - Segment focus
- Exhibits169: Teva Pharmaceutical Industries Ltd. - Overview
- Exhibits170: Teva Pharmaceutical Industries Ltd. - Business segments
- Exhibits171: Teva Pharmaceutical Industries Ltd. - Key news
- Exhibits172: Teva Pharmaceutical Industries Ltd. - Key offerings
- Exhibits173: Teva Pharmaceutical Industries Ltd. - Segment focus
- Exhibits174: Viatris Inc. - Overview
- Exhibits175: Viatris Inc. - Business segments
- Exhibits176: Viatris Inc. - Key news
- Exhibits177: Viatris Inc. - Key offerings
- Exhibits178: Viatris Inc. - Segment focus
- Exhibits179: Inclusions checklist
- Exhibits180: Exclusions checklist
- Exhibits181: Currency conversion rates for US$
- Exhibits182: Research methodology
- Exhibits183: Information sources
- Exhibits184: Data validation
- Exhibits185: Validation techniques employed for market sizing
- Exhibits186: Data synthesis
- Exhibits187: 360 degree market analysis
- Exhibits188: List of abbreviations
The antithrombotic drugs market is forecasted to grow by USD 21783.8 mn during 2023-2028, accelerating at a CAGR of 7.68% during the forecast period. The report on the antithrombotic drugs market provides a holistic analysis, market size and forecast, trends, growth drivers, and challenges, as well as vendor analysis covering around 25 vendors.
The report offers an up-to-date analysis regarding the current market scenario, the latest trends and drivers, and the overall market environment. The market is driven by growing prevalence of coagulation disorders, introduction of novel oral anticoagulants, and strong R and D pipeline in building.
Technavio's antithrombotic drugs market is segmented as below:
| Market Scope | |
|---|---|
| Base Year | 2024 |
| End Year | 2028 |
| Series Year | 2024-2028 |
| Growth Momentum | Accelerate |
| YOY 2024 | 7.32% |
| CAGR | 7.68% |
| Incremental Value | $21783.8mn |
By Route Of Administration
- Oral
- Injectable
By Distribution Channel
- Hospital pharmacy
- Retail pharmacy
- Online pharmacy
By Geographical Landscape
- North America
- Europe
- Asia
- Rest of World (ROW)
This study identifies the advent of anticoagulant antidotes as one of the prime reasons driving the antithrombotic drugs market growth during the next few years. Also, strategic partnerships and acquisitions of companies in market focus and growing new developments in market focus will lead to sizable demand in the market.
The report on the antithrombotic drugs market covers the following areas:
- Antithrombotic drugs market sizing
- Antithrombotic drugs market forecast
- Antithrombotic drugs market industry analysis
The robust vendor analysis is designed to help clients improve their market position, and in line with this, this report provides a detailed analysis of several leading antithrombotic drugs market vendors that include AbbVie Inc., Aspen Pharmacare Holdings Ltd., AstraZeneca PLC, Bayer AG, Boehringer Ingelheim International GmbH, Bristol Myers Squibb Co., Daiichi Sankyo Co. Ltd., Eli Lilly and Co., F. Hoffmann La Roche Ltd., Fresenius Kabi AG, GlaxoSmithKline PLC, Hikma Pharmaceuticals PLC, Johnson and Johnson Services Inc., Merck and Co. Inc., Novartis AG, Otsuka Pharmaceutical Co. Ltd., Pfizer Inc., Sanofi SA, Teva Pharmaceutical Industries Ltd., and Viatris Inc.. Also, the antithrombotic drugs market analysis report includes information on upcoming trends and challenges that will influence market growth. This is to help companies strategize and leverage all forthcoming growth opportunities.
The study was conducted using an objective combination of primary and secondary information including inputs from key participants in the industry. The report contains a comprehensive market and vendor landscape in addition to an analysis of the key vendors.
The publisher presents a detailed picture of the market by the way of study, synthesis, and summation of data from multiple sources by an analysis of key parameters such as profit, pricing, competition, and promotions. It presents various market facets by identifying the key industry influencers. The data presented is comprehensive, reliable, and a result of extensive research - both primary and secondary. The market research reports provide a complete competitive landscape and an in-depth vendor selection methodology and analysis using qualitative and quantitative research to forecast the accurate market growth.
Table of Contents
1 Executive Summary
- 1.1 Market overview
- Executive Summary - Chart on Market Overview
- Executive Summary - Data Table on Market Overview
- Executive Summary - Chart on Global Market Characteristics
- Executive Summary - Chart on Market By Geographical Landscape
- Executive Summary - Chart on Market Segmentation by Route of Administration
- Executive Summary - Chart on Market Segmentation by Distribution Channel
- Executive Summary - Chart on Incremental Growth
- Executive Summary - Data Table on Incremental Growth
- Executive Summary - Chart on Company Market Positioning
2 Market Landscape
- 2.1 Market ecosystem
- Parent Market
- Data Table on - Parent Market
- 2.2 Market characteristics
- Market characteristics analysis
- 2.3 Value chain analysis
- Value Chain Analysis
3 Market Sizing
- 3.1 Market definition
- Offerings of companies included in the market definition
- 3.2 Market segment analysis
- Market segments
- 3.3 Market size 2023
- 3.4 Market outlook: Forecast for 2023-2028
- Chart on Global - Market size and forecast 2023-2028 ($ million)
- Data Table on Global - Market size and forecast 2023-2028 ($ million)
- Chart on Global Market: Year-over-year growth 2023-2028 (%)
- Data Table on Global Market: Year-over-year growth 2023-2028 (%)
4 Historic Market Size
- 4.1 Global Antithrombotic Drugs Market 2018 - 2022
- Historic Market Size - Data Table on Global Antithrombotic Drugs Market 2018 - 2022 ($ million)
- 4.2 Route of Administration segment analysis 2018 - 2022
- Historic Market Size - Route of Administration Segment 2018 - 2022 ($ million)
- 4.3 Distribution Channel segment analysis 2018 - 2022
- Historic Market Size - Distribution Channel Segment 2018 - 2022 ($ million)
- 4.4 Geography segment analysis 2018 - 2022
- Historic Market Size - Geography Segment 2018 - 2022 ($ million)
- 4.5 Country segment analysis 2018 - 2022
- Historic Market Size - Country Segment 2018 - 2022 ($ million)
5 Five Forces Analysis
- 5.1 Five forces summary
- Five forces analysis - Comparison between 2023 and 2028
- 5.2 Bargaining power of buyers
- Bargaining power of buyers - Impact of key factors 2023 and 2028
- 5.3 Bargaining power of suppliers
- Bargaining power of suppliers - Impact of key factors in 2023 and 2028
- 5.4 Threat of new entrants
- Threat of new entrants - Impact of key factors in 2023 and 2028
- 5.5 Threat of substitutes
- Threat of substitutes - Impact of key factors in 2023 and 2028
- 5.6 Threat of rivalry
- Threat of rivalry - Impact of key factors in 2023 and 2028
- 5.7 Market condition
- Chart on Market condition - Five forces 2023 and 2028
6 Market Segmentation by Route of Administration
- 6.1 Market segments
- Chart on Route of Administration - Market share 2023-2028 (%)
- Data Table on Route of Administration - Market share 2023-2028 (%)
- 6.2 Comparison by Route of Administration
- Chart on Comparison by Route of Administration
- Data Table on Comparison by Route of Administration
- 6.3 Oral - Market size and forecast 2023-2028
- Chart on Oral - Market size and forecast 2023-2028 ($ million)
- Data Table on Oral - Market size and forecast 2023-2028 ($ million)
- Chart on Oral - Year-over-year growth 2023-2028 (%)
- Data Table on Oral - Year-over-year growth 2023-2028 (%)
- 6.4 Injectable - Market size and forecast 2023-2028
- Chart on Injectable - Market size and forecast 2023-2028 ($ million)
- Data Table on Injectable - Market size and forecast 2023-2028 ($ million)
- Chart on Injectable - Year-over-year growth 2023-2028 (%)
- Data Table on Injectable - Year-over-year growth 2023-2028 (%)
- 6.5 Market opportunity by Route of Administration
- Market opportunity by Route of Administration ($ million)
- Data Table on Market opportunity by Route of Administration ($ million)
7 Market Segmentation by Distribution Channel
- 7.1 Market segments
- Chart on Distribution Channel - Market share 2023-2028 (%)
- Data Table on Distribution Channel - Market share 2023-2028 (%)
- 7.2 Comparison by Distribution Channel
- Chart on Comparison by Distribution Channel
- Data Table on Comparison by Distribution Channel
- 7.3 Hospital pharmacy - Market size and forecast 2023-2028
- Chart on Hospital pharmacy - Market size and forecast 2023-2028 ($ million)
- Data Table on Hospital pharmacy - Market size and forecast 2023-2028 ($ million)
- Chart on Hospital pharmacy - Year-over-year growth 2023-2028 (%)
- Data Table on Hospital pharmacy - Year-over-year growth 2023-2028 (%)
- 7.4 Retail pharmacy - Market size and forecast 2023-2028
- Chart on Retail pharmacy - Market size and forecast 2023-2028 ($ million)
- Data Table on Retail pharmacy - Market size and forecast 2023-2028 ($ million)
- Chart on Retail pharmacy - Year-over-year growth 2023-2028 (%)
- Data Table on Retail pharmacy - Year-over-year growth 2023-2028 (%)
- 7.5 Online pharmacy - Market size and forecast 2023-2028
- Chart on Online pharmacy - Market size and forecast 2023-2028 ($ million)
- Data Table on Online pharmacy - Market size and forecast 2023-2028 ($ million)
- Chart on Online pharmacy - Year-over-year growth 2023-2028 (%)
- Data Table on Online pharmacy - Year-over-year growth 2023-2028 (%)
- 7.6 Market opportunity by Distribution Channel
- Market opportunity by Distribution Channel ($ million)
- Data Table on Market opportunity by Distribution Channel ($ million)
8 Customer Landscape
- 8.1 Customer landscape overview
- Analysis of price sensitivity, lifecycle, customer purchase basket, adoption rates, and purchase criteria
9 Geographic Landscape
- 9.1 Geographic segmentation
- Chart on Market share By Geographical Landscape 2023-2028 (%)
- Data Table on Market share By Geographical Landscape 2023-2028 (%)
- 9.2 Geographic comparison
- Chart on Geographic comparison
- Data Table on Geographic comparison
- 9.3 North America - Market size and forecast 2023-2028
- Chart on North America - Market size and forecast 2023-2028 ($ million)
- Data Table on North America - Market size and forecast 2023-2028 ($ million)
- Chart on North America - Year-over-year growth 2023-2028 (%)
- Data Table on North America - Year-over-year growth 2023-2028 (%)
- 9.4 Europe - Market size and forecast 2023-2028
- Chart on Europe - Market size and forecast 2023-2028 ($ million)
- Data Table on Europe - Market size and forecast 2023-2028 ($ million)
- Chart on Europe - Year-over-year growth 2023-2028 (%)
- Data Table on Europe - Year-over-year growth 2023-2028 (%)
- 9.5 Asia - Market size and forecast 2023-2028
- Chart on Asia - Market size and forecast 2023-2028 ($ million)
- Data Table on Asia - Market size and forecast 2023-2028 ($ million)
- Chart on Asia - Year-over-year growth 2023-2028 (%)
- Data Table on Asia - Year-over-year growth 2023-2028 (%)
- 9.6 Rest of World (ROW) - Market size and forecast 2023-2028
- Chart on Rest of World (ROW) - Market size and forecast 2023-2028 ($ million)
- Data Table on Rest of World (ROW) - Market size and forecast 2023-2028 ($ million)
- Chart on Rest of World (ROW) - Year-over-year growth 2023-2028 (%)
- Data Table on Rest of World (ROW) - Year-over-year growth 2023-2028 (%)
- 9.7 US - Market size and forecast 2023-2028
- Chart on US - Market size and forecast 2023-2028 ($ million)
- Data Table on US - Market size and forecast 2023-2028 ($ million)
- Chart on US - Year-over-year growth 2023-2028 (%)
- Data Table on US - Year-over-year growth 2023-2028 (%)
- 9.8 Germany - Market size and forecast 2023-2028
- Chart on Germany - Market size and forecast 2023-2028 ($ million)
- Data Table on Germany - Market size and forecast 2023-2028 ($ million)
- Chart on Germany - Year-over-year growth 2023-2028 (%)
- Data Table on Germany - Year-over-year growth 2023-2028 (%)
- 9.9 UK - Market size and forecast 2023-2028
- Chart on UK - Market size and forecast 2023-2028 ($ million)
- Data Table on UK - Market size and forecast 2023-2028 ($ million)
- Chart on UK - Year-over-year growth 2023-2028 (%)
- Data Table on UK - Year-over-year growth 2023-2028 (%)
- 9.10 Japan - Market size and forecast 2023-2028
- Chart on Japan - Market size and forecast 2023-2028 ($ million)
- Data Table on Japan - Market size and forecast 2023-2028 ($ million)
- Chart on Japan - Year-over-year growth 2023-2028 (%)
- Data Table on Japan - Year-over-year growth 2023-2028 (%)
- 9.11 Canada - Market size and forecast 2023-2028
- Chart on Canada - Market size and forecast 2023-2028 ($ million)
- Data Table on Canada - Market size and forecast 2023-2028 ($ million)
- Chart on Canada - Year-over-year growth 2023-2028 (%)
- Data Table on Canada - Year-over-year growth 2023-2028 (%)
- 9.12 Market opportunity By Geographical Landscape
- Market opportunity By Geographical Landscape ($ million)
- Data Tables on Market opportunity By Geographical Landscape ($ million)
10 Drivers, Challenges, and Opportunity/Restraints
- 10.1 Market drivers
- 10.2 Market challenges
- 10.3 Impact of drivers and challenges
- Impact of drivers and challenges in 2023 and 2028
- 10.4 Market opportunities/restraints
11 Competitive Landscape
- 11.1 Overview
- 11.2 Competitive Landscape
- Overview on criticality of inputs and factors of differentiation
- 11.3 Landscape disruption
- Overview on factors of disruption
- 11.4 Industry risks
- Impact of key risks on business
12 Competitive Analysis
- 12.1 Companies profiled
- Companies covered
- 12.2 Market positioning of companies
- Matrix on companies position and classification
- 12.3 Aspen Pharmacare Holdings Ltd.
- Aspen Pharmacare Holdings Ltd. - Overview
- Aspen Pharmacare Holdings Ltd. - Business segments
- Aspen Pharmacare Holdings Ltd. - Key offerings
- Aspen Pharmacare Holdings Ltd. - Segment focus
- 12.4 AstraZeneca Plc
- AstraZeneca Plc - Overview
- AstraZeneca Plc - Product / Service
- AstraZeneca Plc - Key news
- AstraZeneca Plc - Key offerings
- 12.5 Bayer AG
- Bayer AG - Overview
- Bayer AG - Business segments
- Bayer AG - Key news
- Bayer AG - Key offerings
- Bayer AG - Segment focus
- 12.6 Boehringer Ingelheim International GmbH
- Boehringer Ingelheim International GmbH - Overview
- Boehringer Ingelheim International GmbH - Product / Service
- Boehringer Ingelheim International GmbH - Key news
- Boehringer Ingelheim International GmbH - Key offerings
- 12.7 Bristol Myers Squibb Co.
- Bristol Myers Squibb Co. - Overview
- Bristol Myers Squibb Co. - Product / Service
- Bristol Myers Squibb Co. - Key news
- Bristol Myers Squibb Co. - Key offerings
- 12.8 Daiichi Sankyo Co. Ltd.
- Daiichi Sankyo Co. Ltd. - Overview
- Daiichi Sankyo Co. Ltd. - Product / Service
- Daiichi Sankyo Co. Ltd. - Key news
- Daiichi Sankyo Co. Ltd. - Key offerings
- 12.9 Eli Lilly and Co.
- Eli Lilly and Co. - Overview
- Eli Lilly and Co. - Product / Service
- Eli Lilly and Co. - Key news
- Eli Lilly and Co. - Key offerings
- 12.10 F. Hoffmann La Roche Ltd.
- F. Hoffmann La Roche Ltd. - Overview
- F. Hoffmann La Roche Ltd. - Business segments
- F. Hoffmann La Roche Ltd. - Key news
- F. Hoffmann La Roche Ltd. - Key offerings
- F. Hoffmann La Roche Ltd. - Segment focus
- 12.11 Fresenius Kabi AG
- Fresenius Kabi AG - Overview
- Fresenius Kabi AG - Business segments
- Fresenius Kabi AG - Key offerings
- Fresenius Kabi AG - Segment focus
- 12.12 Hikma Pharmaceuticals Plc
- Hikma Pharmaceuticals Plc - Overview
- Hikma Pharmaceuticals Plc - Business segments
- Hikma Pharmaceuticals Plc - Key news
- Hikma Pharmaceuticals Plc - Key offerings
- Hikma Pharmaceuticals Plc - Segment focus
- 12.13 Novartis AG
- Novartis AG - Overview
- Novartis AG - Business segments
- Novartis AG - Key news
- Novartis AG - Key offerings
- Novartis AG - Segment focus
- 12.14 Otsuka Pharmaceutical Co. Ltd.
- Otsuka Pharmaceutical Co. Ltd. - Overview
- Otsuka Pharmaceutical Co. Ltd. - Product / Service
- Otsuka Pharmaceutical Co. Ltd. - Key offerings
- 12.15 Sanofi SA
- Sanofi SA - Overview
- Sanofi SA - Business segments
- Sanofi SA - Key news
- Sanofi SA - Key offerings
- Sanofi SA - Segment focus
- 12.16 Teva Pharmaceutical Industries Ltd.
- Teva Pharmaceutical Industries Ltd. - Overview
- Teva Pharmaceutical Industries Ltd. - Business segments
- Teva Pharmaceutical Industries Ltd. - Key news
- Teva Pharmaceutical Industries Ltd. - Key offerings
- Teva Pharmaceutical Industries Ltd. - Segment focus
- 12.17 Viatris Inc.
- Viatris Inc. - Overview
- Viatris Inc. - Business segments
- Viatris Inc. - Key news
- Viatris Inc. - Key offerings
- Viatris Inc. - Segment focus
13 Appendix
- 13.1 Scope of the report
- 13.2 Inclusions and exclusions checklist
- Inclusions checklist
- Exclusions checklist
- 13.3 Currency conversion rates for US$
- Currency conversion rates for US$
- 13.4 Research methodology
- Research methodology
- 13.5 Data procurement
- Information sources
- 13.6 Data validation
- Data validation
- 13.7 Validation techniques employed for market sizing
- Validation techniques employed for market sizing
- 13.8 Data synthesis
- Data synthesis
- 13.9 360 degree market analysis
- 360 degree market analysis
- 13.10 List of abbreviations
- List of abbreviations

