|
|
市場調査レポート
商品コード
1557531
金属粉末床融合(PBF)の世界市場 2024-2028Global Metal Powder Bed Fusion Market 2024-2028 |
||||||

|
|||||||
カスタマイズ可能
|
|||||||

| 金属粉末床融合(PBF)の世界市場 2024-2028 |
|
出版日: 2024年08月14日
発行: TechNavio
ページ情報: 英文 192 Pages
納期: 即納可能
|

全表示
- 概要
- 図表
- 目次
金属粉末床融合(PBF)市場は2023-2028年に7億9,360万米ドル、予測期間中のCAGRは9.45%で成長すると予測されます。
当レポートでは、金属粉末床融合市場の全体的な分析、市場規模・予測、動向、成長促進要因、課題、約25のベンダーを網羅したベンダー分析などを掲載しています。
現在の市場シナリオ、最新動向と促進要因、市場環境全体に関する最新分析を提供しています。市場は、積層造形への嗜好の高まり、新興諸国からの金属PBF技術への需要の高まり、自動車産業からの金属PBF積層造形への需要の高まりによって牽引されています。
| 市場範囲 | |
|---|---|
| 基準年 | 2024 |
| 終了年 | 2028 |
| 予測期間 | 2024-2028 |
| 成長モメンタム | 加速 |
| 前年比2024年 | 8.42% |
| CAGR | 9.45% |
| 増分額 | 7億9,360万米ドル |
本調査では、付加製造における自動化の統合が、今後数年間の金属粉末床融合市場成長を促進する主要な理由の1つであるとしています。また、航空宇宙分野でのPBF方式金属3Dプリンターの需要増加、医療やヘルスケア産業でのPBF方式金属3Dプリンターの新たな用途は、市場の大きな需要につながります。
目次
第1章 エグゼクティブサマリー
- 市場概要
第2章 市場情勢
- 市場エコシステム
- 市場の特徴
- バリューチェーン分析
第3章 市場規模の評価
- 市場の定義
- 市場セグメント分析
- 市場規模 2023
- 市場の見通し 2023-2028
第4章 市場規模実績
- 金属粉末床融合の世界市場 2018-2022
- 用途別セグメント分析 2018-2022
- タイプ別セグメント分析 2018-2022
- 地域別セグメント分析 2018-2022
- 国別セグメント分析 2018-2022
第5章 ファイブフォース分析
- ファイブフォースの要約
- 買い手の交渉力
- 供給企業の交渉力
- 新規参入業者の脅威
- 代替品の脅威
- 競争の脅威
- 市況
第6章 市場セグメンテーション:用途別
- 市場セグメンテーション
- 比較:用途別
- 医療・ヘルスケア:市場規模と予測 2023-2028
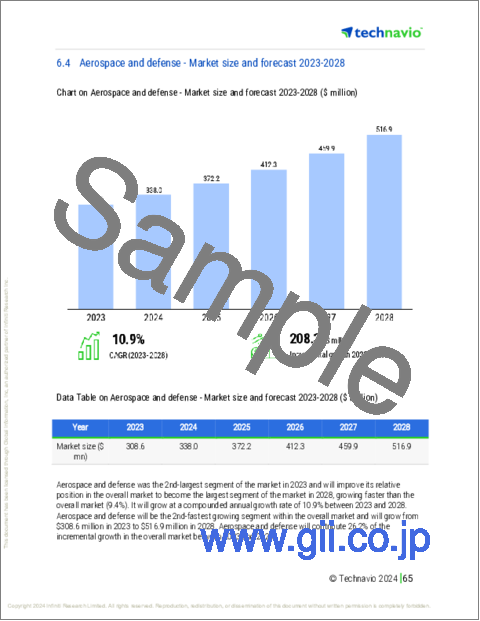
- 航空宇宙・防衛:市場規模と予測 2023-2028
- 自動車:市場規模と予測 2023-2028
- 石油・ガス:市場規模と予測 2023-2028
- その他:市場規模と予測 2023-2028
- 市場機会:用途別
第7章 市場セグメンテーション:タイプ別
- 市場セグメンテーション
- 比較:タイプ別
- 直接金属レーザー焼結(DMLS):市場規模と予測 2023-2028
- 選択的レーザー焼結(SLS):市場規模と予測 2023-2028
- 電子ビーム溶解法(EBM):市場規模と予測 2023-2028
- 選択的レーザー溶融(SLM):市場規模と予測 2023-2028
- 市場機会:タイプ別
第8章 顧客情勢
- 顧客情勢の概要
第9章 地域別情勢
- 地域別セグメンテーション
- 地域別比較
- 北米:市場規模と予測 2023-2028
- 欧州:市場規模と予測 2023-2028
- アジア太平洋:市場規模と予測 2023-2028
- 南米:市場規模と予測 2023-2028
- 中東・アフリカ:市場規模と予測 2023-2028
- 米国:市場規模と予測 2023-2028
- 中国:市場規模と予測 2023-2028
- ドイツ:市場規模と予測 2023-2028
- 英国:市場規模と予測 2023-2028
- フランス:市場規模と予測 2023-2028
- 市場機会:地域情勢別
第10章 促進要因・課題・機会・抑制要因
- 市場促進要因
- 市場の課題
- 促進要因と課題の影響
- 市場の機会・抑制要因
第11章 競合情勢
- 概要
- 競合情勢
- 混乱の状況
- 業界のリスク
第12章 競合分析
- 企業プロファイル
- 企業の市場ポジショニング
- Additive Industries BV
- Desktop Metal Inc.
- EOS GmbH
- FIVES SAS
- General Electric Co.
- Hoganas AB
- Markforged Holding Corp.
- MATERIALISE NV
- Nikon Corp.
- Renishaw Plc
- Stratasys Ltd.
- TRUMPF SE Co. KG
- Velo3D Inc.
- voxeljet AG
第13章 付録
Exhibits:
- Exhibits1: Executive Summary - Chart on Market Overview
- Exhibits2: Executive Summary - Data Table on Market Overview
- Exhibits3: Executive Summary - Chart on Global Market Characteristics
- Exhibits4: Executive Summary - Chart on Market By Geographical Landscape
- Exhibits5: Executive Summary - Chart on Market Segmentation by Application
- Exhibits6: Executive Summary - Chart on Market Segmentation by Type
- Exhibits7: Executive Summary - Chart on Incremental Growth
- Exhibits8: Executive Summary - Data Table on Incremental Growth
- Exhibits9: Executive Summary - Chart on Company Market Positioning
- Exhibits10: Parent Market
- Exhibits11: Data Table on - Parent Market
- Exhibits12: Market characteristics analysis
- Exhibits13: Value Chain Analysis
- Exhibits14: Offerings of companies included in the market definition
- Exhibits15: Market segments
- Exhibits16: Chart on Global - Market size and forecast 2023-2028 ($ million)
- Exhibits17: Data Table on Global - Market size and forecast 2023-2028 ($ million)
- Exhibits18: Chart on Global Market: Year-over-year growth 2023-2028 (%)
- Exhibits19: Data Table on Global Market: Year-over-year growth 2023-2028 (%)
- Exhibits20: Historic Market Size - Data Table on Global Metal Powder Bed Fusion Market 2018 - 2022 ($ million)
- Exhibits21: Historic Market Size - Application Segment 2018 - 2022 ($ million)
- Exhibits22: Historic Market Size - Type Segment 2018 - 2022 ($ million)
- Exhibits23: Historic Market Size - Geography Segment 2018 - 2022 ($ million)
- Exhibits24: Historic Market Size - Country Segment 2018 - 2022 ($ million)
- Exhibits25: Five forces analysis - Comparison between 2023 and 2028
- Exhibits26: Bargaining power of buyers - Impact of key factors 2023 and 2028
- Exhibits27: Bargaining power of suppliers - Impact of key factors in 2023 and 2028
- Exhibits28: Threat of new entrants - Impact of key factors in 2023 and 2028
- Exhibits29: Threat of substitutes - Impact of key factors in 2023 and 2028
- Exhibits30: Threat of rivalry - Impact of key factors in 2023 and 2028
- Exhibits31: Chart on Market condition - Five forces 2023 and 2028
- Exhibits32: Chart on Application - Market share 2023-2028 (%)
- Exhibits33: Data Table on Application - Market share 2023-2028 (%)
- Exhibits34: Chart on Comparison by Application
- Exhibits35: Data Table on Comparison by Application
- Exhibits36: Chart on Medical and healthcare - Market size and forecast 2023-2028 ($ million)
- Exhibits37: Data Table on Medical and healthcare - Market size and forecast 2023-2028 ($ million)
- Exhibits38: Chart on Medical and healthcare - Year-over-year growth 2023-2028 (%)
- Exhibits39: Data Table on Medical and healthcare - Year-over-year growth 2023-2028 (%)
- Exhibits40: Chart on Aerospace and defense - Market size and forecast 2023-2028 ($ million)
- Exhibits41: Data Table on Aerospace and defense - Market size and forecast 2023-2028 ($ million)
- Exhibits42: Chart on Aerospace and defense - Year-over-year growth 2023-2028 (%)
- Exhibits43: Data Table on Aerospace and defense - Year-over-year growth 2023-2028 (%)
- Exhibits44: Chart on Automotive - Market size and forecast 2023-2028 ($ million)
- Exhibits45: Data Table on Automotive - Market size and forecast 2023-2028 ($ million)
- Exhibits46: Chart on Automotive - Year-over-year growth 2023-2028 (%)
- Exhibits47: Data Table on Automotive - Year-over-year growth 2023-2028 (%)
- Exhibits48: Chart on Oil and gas - Market size and forecast 2023-2028 ($ million)
- Exhibits49: Data Table on Oil and gas - Market size and forecast 2023-2028 ($ million)
- Exhibits50: Chart on Oil and gas - Year-over-year growth 2023-2028 (%)
- Exhibits51: Data Table on Oil and gas - Year-over-year growth 2023-2028 (%)
- Exhibits52: Chart on Others - Market size and forecast 2023-2028 ($ million)
- Exhibits53: Data Table on Others - Market size and forecast 2023-2028 ($ million)
- Exhibits54: Chart on Others - Year-over-year growth 2023-2028 (%)
- Exhibits55: Data Table on Others - Year-over-year growth 2023-2028 (%)
- Exhibits56: Market opportunity by Application ($ million)
- Exhibits57: Data Table on Market opportunity by Application ($ million)
- Exhibits58: Chart on Type - Market share 2023-2028 (%)
- Exhibits59: Data Table on Type - Market share 2023-2028 (%)
- Exhibits60: Chart on Comparison by Type
- Exhibits61: Data Table on Comparison by Type
- Exhibits62: Chart on Direct metal laser sintering (DMLS) - Market size and forecast 2023-2028 ($ million)
- Exhibits63: Data Table on Direct metal laser sintering (DMLS) - Market size and forecast 2023-2028 ($ million)
- Exhibits64: Chart on Direct metal laser sintering (DMLS) - Year-over-year growth 2023-2028 (%)
- Exhibits65: Data Table on Direct metal laser sintering (DMLS) - Year-over-year growth 2023-2028 (%)
- Exhibits66: Chart on Selective laser sintering (SLS) - Market size and forecast 2023-2028 ($ million)
- Exhibits67: Data Table on Selective laser sintering (SLS) - Market size and forecast 2023-2028 ($ million)
- Exhibits68: Chart on Selective laser sintering (SLS) - Year-over-year growth 2023-2028 (%)
- Exhibits69: Data Table on Selective laser sintering (SLS) - Year-over-year growth 2023-2028 (%)
- Exhibits70: Chart on Electron beam melting (EBM) - Market size and forecast 2023-2028 ($ million)
- Exhibits71: Data Table on Electron beam melting (EBM) - Market size and forecast 2023-2028 ($ million)
- Exhibits72: Chart on Electron beam melting (EBM) - Year-over-year growth 2023-2028 (%)
- Exhibits73: Data Table on Electron beam melting (EBM) - Year-over-year growth 2023-2028 (%)
- Exhibits74: Chart on Selective laser melting (SLM) - Market size and forecast 2023-2028 ($ million)
- Exhibits75: Data Table on Selective laser melting (SLM) - Market size and forecast 2023-2028 ($ million)
- Exhibits76: Chart on Selective laser melting (SLM) - Year-over-year growth 2023-2028 (%)
- Exhibits77: Data Table on Selective laser melting (SLM) - Year-over-year growth 2023-2028 (%)
- Exhibits78: Market opportunity by Type ($ million)
- Exhibits79: Data Table on Market opportunity by Type ($ million)
- Exhibits80: Analysis of price sensitivity, lifecycle, customer purchase basket, adoption rates, and purchase criteria
- Exhibits81: Chart on Market share By Geographical Landscape 2023-2028 (%)
- Exhibits82: Data Table on Market share By Geographical Landscape 2023-2028 (%)
- Exhibits83: Chart on Geographic comparison
- Exhibits84: Data Table on Geographic comparison
- Exhibits85: Chart on North America - Market size and forecast 2023-2028 ($ million)
- Exhibits86: Data Table on North America - Market size and forecast 2023-2028 ($ million)
- Exhibits87: Chart on North America - Year-over-year growth 2023-2028 (%)
- Exhibits88: Data Table on North America - Year-over-year growth 2023-2028 (%)
- Exhibits89: Chart on Europe - Market size and forecast 2023-2028 ($ million)
- Exhibits90: Data Table on Europe - Market size and forecast 2023-2028 ($ million)
- Exhibits91: Chart on Europe - Year-over-year growth 2023-2028 (%)
- Exhibits92: Data Table on Europe - Year-over-year growth 2023-2028 (%)
- Exhibits93: Chart on APAC - Market size and forecast 2023-2028 ($ million)
- Exhibits94: Data Table on APAC - Market size and forecast 2023-2028 ($ million)
- Exhibits95: Chart on APAC - Year-over-year growth 2023-2028 (%)
- Exhibits96: Data Table on APAC - Year-over-year growth 2023-2028 (%)
- Exhibits97: Chart on South America - Market size and forecast 2023-2028 ($ million)
- Exhibits98: Data Table on South America - Market size and forecast 2023-2028 ($ million)
- Exhibits99: Chart on South America - Year-over-year growth 2023-2028 (%)
- Exhibits100: Data Table on South America - Year-over-year growth 2023-2028 (%)
- Exhibits101: Chart on Middle East and Africa - Market size and forecast 2023-2028 ($ million)
- Exhibits102: Data Table on Middle East and Africa - Market size and forecast 2023-2028 ($ million)
- Exhibits103: Chart on Middle East and Africa - Year-over-year growth 2023-2028 (%)
- Exhibits104: Data Table on Middle East and Africa - Year-over-year growth 2023-2028 (%)
- Exhibits105: Chart on US - Market size and forecast 2023-2028 ($ million)
- Exhibits106: Data Table on US - Market size and forecast 2023-2028 ($ million)
- Exhibits107: Chart on US - Year-over-year growth 2023-2028 (%)
- Exhibits108: Data Table on US - Year-over-year growth 2023-2028 (%)
- Exhibits109: Chart on China - Market size and forecast 2023-2028 ($ million)
- Exhibits110: Data Table on China - Market size and forecast 2023-2028 ($ million)
- Exhibits111: Chart on China - Year-over-year growth 2023-2028 (%)
- Exhibits112: Data Table on China - Year-over-year growth 2023-2028 (%)
- Exhibits113: Chart on Germany - Market size and forecast 2023-2028 ($ million)
- Exhibits114: Data Table on Germany - Market size and forecast 2023-2028 ($ million)
- Exhibits115: Chart on Germany - Year-over-year growth 2023-2028 (%)
- Exhibits116: Data Table on Germany - Year-over-year growth 2023-2028 (%)
- Exhibits117: Chart on UK - Market size and forecast 2023-2028 ($ million)
- Exhibits118: Data Table on UK - Market size and forecast 2023-2028 ($ million)
- Exhibits119: Chart on UK - Year-over-year growth 2023-2028 (%)
- Exhibits120: Data Table on UK - Year-over-year growth 2023-2028 (%)
- Exhibits121: Chart on France - Market size and forecast 2023-2028 ($ million)
- Exhibits122: Data Table on France - Market size and forecast 2023-2028 ($ million)
- Exhibits123: Chart on France - Year-over-year growth 2023-2028 (%)
- Exhibits124: Data Table on France - Year-over-year growth 2023-2028 (%)
- Exhibits125: Market opportunity By Geographical Landscape ($ million)
- Exhibits126: Data Tables on Market opportunity By Geographical Landscape ($ million)
- Exhibits127: Impact of drivers and challenges in 2023 and 2028
- Exhibits128: Overview on criticality of inputs and factors of differentiation
- Exhibits129: Overview on factors of disruption
- Exhibits130: Impact of key risks on business
- Exhibits131: Companies covered
- Exhibits132: Matrix on companies position and classification
- Exhibits133: 3D Systems Corp. - Overview
- Exhibits134: 3D Systems Corp. - Business segments
- Exhibits135: 3D Systems Corp. - Key news
- Exhibits136: 3D Systems Corp. - Key offerings
- Exhibits137: 3D Systems Corp. - Segment focus
- Exhibits138: Additive Industries BV - Overview
- Exhibits139: Additive Industries BV - Product / Service
- Exhibits140: Additive Industries BV - Key offerings
- Exhibits141: Desktop Metal Inc. - Overview
- Exhibits142: Desktop Metal Inc. - Business segments
- Exhibits143: Desktop Metal Inc. - Key news
- Exhibits144: Desktop Metal Inc. - Key offerings
- Exhibits145: Desktop Metal Inc. - Segment focus
- Exhibits146: EOS GmbH - Overview
- Exhibits147: EOS GmbH - Product / Service
- Exhibits148: EOS GmbH - Key news
- Exhibits149: EOS GmbH - Key offerings
- Exhibits150: FIVES SAS - Overview
- Exhibits151: FIVES SAS - Business segments
- Exhibits152: FIVES SAS - Key offerings
- Exhibits153: FIVES SAS - Segment focus
- Exhibits154: General Electric Co. - Overview
- Exhibits155: General Electric Co. - Business segments
- Exhibits156: General Electric Co. - Key news
- Exhibits157: General Electric Co. - Key offerings
- Exhibits158: General Electric Co. - Segment focus
- Exhibits159: Hoganas AB - Overview
- Exhibits160: Hoganas AB - Product / Service
- Exhibits161: Hoganas AB - Key offerings
- Exhibits162: Markforged Holding Corp. - Overview
- Exhibits163: Markforged Holding Corp. - Product / Service
- Exhibits164: Markforged Holding Corp. - Key offerings
- Exhibits165: MATERIALISE NV - Overview
- Exhibits166: MATERIALISE NV - Business segments
- Exhibits167: MATERIALISE NV - Key news
- Exhibits168: MATERIALISE NV - Key offerings
- Exhibits169: MATERIALISE NV - Segment focus
- Exhibits170: Nikon Corp. - Overview
- Exhibits171: Nikon Corp. - Business segments
- Exhibits172: Nikon Corp. - Key news
- Exhibits173: Nikon Corp. - Key offerings
- Exhibits174: Nikon Corp. - Segment focus
- Exhibits175: Renishaw Plc - Overview
- Exhibits176: Renishaw Plc - Business segments
- Exhibits177: Renishaw Plc - Key offerings
- Exhibits178: Renishaw Plc - Segment focus
- Exhibits179: Stratasys Ltd. - Overview
- Exhibits180: Stratasys Ltd. - Product / Service
- Exhibits181: Stratasys Ltd. - Key news
- Exhibits182: Stratasys Ltd. - Key offerings
- Exhibits183: TRUMPF SE Co. KG - Overview
- Exhibits184: TRUMPF SE Co. KG - Product / Service
- Exhibits185: TRUMPF SE Co. KG - Key offerings
- Exhibits186: Velo3D Inc. - Overview
- Exhibits187: Velo3D Inc. - Product / Service
- Exhibits188: Velo3D Inc. - Key offerings
- Exhibits189: voxeljet AG - Overview
- Exhibits190: voxeljet AG - Business segments
- Exhibits191: voxeljet AG - Key news
- Exhibits192: voxeljet AG - Key offerings
- Exhibits193: voxeljet AG - Segment focus
- Exhibits194: Inclusions checklist
- Exhibits195: Exclusions checklist
- Exhibits196: Currency conversion rates for US$
- Exhibits197: Research methodology
- Exhibits198: Information sources
- Exhibits199: Data validation
- Exhibits200: Validation techniques employed for market sizing
- Exhibits201: Data synthesis
- Exhibits202: 360 degree market analysis
- Exhibits203: List of abbreviations
The metal powder bed fusion market is forecasted to grow by USD 793.6 mn during 2023-2028, accelerating at a CAGR of 9.45% during the forecast period. The report on the metal powder bed fusion market provides a holistic analysis, market size and forecast, trends, growth drivers, and challenges, as well as vendor analysis covering around 25 vendors.
The report offers an up-to-date analysis regarding the current market scenario, the latest trends and drivers, and the overall market environment. The market is driven by increased preference for additive manufacturing, rise in demand for metal pbf technology from developing countries, and increase in demand for metal pbf additive manufacturing from automotive industry.
Technavio's metal powder bed fusion market is segmented as below:
| Market Scope | |
|---|---|
| Base Year | 2024 |
| End Year | 2028 |
| Series Year | 2024-2028 |
| Growth Momentum | Accelerate |
| YOY 2024 | 8.42% |
| CAGR | 9.45% |
| Incremental Value | $793.6 mn |
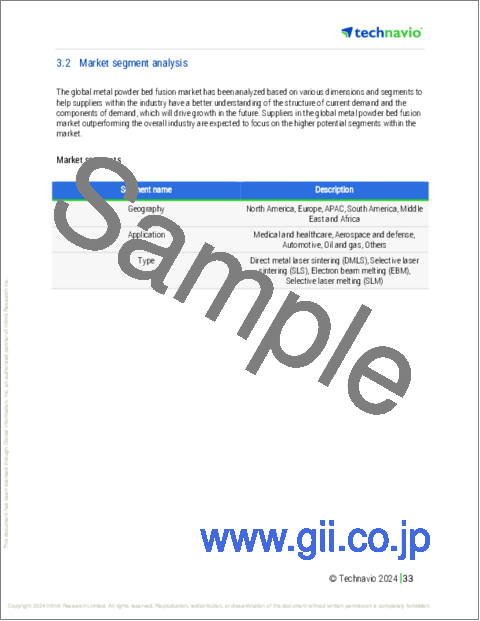
By Application
- Medical and healthcare
- Aerospace and defense
- Automotive
- Oil and gas
- Others
By Type
- Direct metal laser sintering (DMLS)
- Selective laser sintering (SLS)
- Electron beam melting (EBM)
- Selective laser melting (SLM)
By Geographical Landscape
- North America
- Europe
- APAC
- South America
- Middle East and Africa
This study identifies the integration of automation in additive manufacturing as one of the prime reasons driving the metal powder bed fusion market growth during the next few years. Also, increased demand for metal pbf 3d printing in aerospace sector and emerging applications of metal pbf 3d printing in medical and healthcare industries will lead to sizable demand in the market.
The report on the metal powder bed fusion market covers the following areas:
- Metal powder bed fusion market sizing
- Metal powder bed fusion market forecast
- Metal powder bed fusion market industry analysis
The robust vendor analysis is designed to help clients improve their market position, and in line with this, this report provides a detailed analysis of several leading metal powder bed fusion market vendors that include 3D Systems Corp., Additive Industries BV, Desktop Metal Inc., EOS GmbH, Eplus 3D, FIVES SAS, General Electric Co., Heimerle Meule GmbH, Hoganas AB, Markforged Holding Corp., MATERIALISE NV, Nikon Corp., Renishaw Plc, Sandvik AB, Sisma SpA, Stratasys Ltd., TRUMPF SE Co. KG, Velo3D Inc., voxeljet AG, and Xact Metal Inc.. Also, the metal powder bed fusion market analysis report includes information on upcoming trends and challenges that will influence market growth. This is to help companies strategize and leverage all forthcoming growth opportunities.
The study was conducted using an objective combination of primary and secondary information including inputs from key participants in the industry. The report contains a comprehensive market and vendor landscape in addition to an analysis of the key vendors.
The publisher presents a detailed picture of the market by the way of study, synthesis, and summation of data from multiple sources by an analysis of key parameters such as profit, pricing, competition, and promotions. It presents various market facets by identifying the key industry influencers. The data presented is comprehensive, reliable, and a result of extensive research - both primary and secondary. The market research reports provide a complete competitive landscape and an in-depth vendor selection methodology and analysis using qualitative and quantitative research to forecast the accurate market growth.
Table of Contents
1 Executive Summary
- 1.1 Market overview
- Executive Summary - Chart on Market Overview
- Executive Summary - Data Table on Market Overview
- Executive Summary - Chart on Global Market Characteristics
- Executive Summary - Chart on Market By Geographical Landscape
- Executive Summary - Chart on Market Segmentation by Application
- Executive Summary - Chart on Market Segmentation by Type
- Executive Summary - Chart on Incremental Growth
- Executive Summary - Data Table on Incremental Growth
- Executive Summary - Chart on Company Market Positioning
2 Market Landscape
- 2.1 Market ecosystem
- Parent Market
- Data Table on - Parent Market
- 2.2 Market characteristics
- Market characteristics analysis
- 2.3 Value chain analysis
- Value Chain Analysis
3 Market Sizing
- 3.1 Market definition
- Offerings of companies included in the market definition
- 3.2 Market segment analysis
- Market segments
- 3.3 Market size 2023
- 3.4 Market outlook: Forecast for 2023-2028
- Chart on Global - Market size and forecast 2023-2028 ($ million)
- Data Table on Global - Market size and forecast 2023-2028 ($ million)
- Chart on Global Market: Year-over-year growth 2023-2028 (%)
- Data Table on Global Market: Year-over-year growth 2023-2028 (%)
4 Historic Market Size
- 4.1 Global Metal Powder Bed Fusion Market 2018 - 2022
- Historic Market Size - Data Table on Global Metal Powder Bed Fusion Market 2018 - 2022 ($ million)
- 4.2 Application segment analysis 2018 - 2022
- Historic Market Size - Application Segment 2018 - 2022 ($ million)
- 4.3 Type segment analysis 2018 - 2022
- Historic Market Size - Type Segment 2018 - 2022 ($ million)
- 4.4 Geography segment analysis 2018 - 2022
- Historic Market Size - Geography Segment 2018 - 2022 ($ million)
- 4.5 Country segment analysis 2018 - 2022
- Historic Market Size - Country Segment 2018 - 2022 ($ million)
5 Five Forces Analysis
- 5.1 Five forces summary
- Five forces analysis - Comparison between 2023 and 2028
- 5.2 Bargaining power of buyers
- Bargaining power of buyers - Impact of key factors 2023 and 2028
- 5.3 Bargaining power of suppliers
- Bargaining power of suppliers - Impact of key factors in 2023 and 2028
- 5.4 Threat of new entrants
- Threat of new entrants - Impact of key factors in 2023 and 2028
- 5.5 Threat of substitutes
- Threat of substitutes - Impact of key factors in 2023 and 2028
- 5.6 Threat of rivalry
- Threat of rivalry - Impact of key factors in 2023 and 2028
- 5.7 Market condition
- Chart on Market condition - Five forces 2023 and 2028
6 Market Segmentation by Application
- 6.1 Market segments
- Chart on Application - Market share 2023-2028 (%)
- Data Table on Application - Market share 2023-2028 (%)
- 6.2 Comparison by Application
- Chart on Comparison by Application
- Data Table on Comparison by Application
- 6.3 Medical and healthcare - Market size and forecast 2023-2028
- Chart on Medical and healthcare - Market size and forecast 2023-2028 ($ million)
- Data Table on Medical and healthcare - Market size and forecast 2023-2028 ($ million)
- Chart on Medical and healthcare - Year-over-year growth 2023-2028 (%)
- Data Table on Medical and healthcare - Year-over-year growth 2023-2028 (%)
- 6.4 Aerospace and defense - Market size and forecast 2023-2028
- Chart on Aerospace and defense - Market size and forecast 2023-2028 ($ million)
- Data Table on Aerospace and defense - Market size and forecast 2023-2028 ($ million)
- Chart on Aerospace and defense - Year-over-year growth 2023-2028 (%)
- Data Table on Aerospace and defense - Year-over-year growth 2023-2028 (%)
- 6.5 Automotive - Market size and forecast 2023-2028
- Chart on Automotive - Market size and forecast 2023-2028 ($ million)
- Data Table on Automotive - Market size and forecast 2023-2028 ($ million)
- Chart on Automotive - Year-over-year growth 2023-2028 (%)
- Data Table on Automotive - Year-over-year growth 2023-2028 (%)
- 6.6 Oil and gas - Market size and forecast 2023-2028
- Chart on Oil and gas - Market size and forecast 2023-2028 ($ million)
- Data Table on Oil and gas - Market size and forecast 2023-2028 ($ million)
- Chart on Oil and gas - Year-over-year growth 2023-2028 (%)
- Data Table on Oil and gas - Year-over-year growth 2023-2028 (%)
- 6.7 Others - Market size and forecast 2023-2028
- Chart on Others - Market size and forecast 2023-2028 ($ million)
- Data Table on Others - Market size and forecast 2023-2028 ($ million)
- Chart on Others - Year-over-year growth 2023-2028 (%)
- Data Table on Others - Year-over-year growth 2023-2028 (%)
- 6.8 Market opportunity by Application
- Market opportunity by Application ($ million)
- Data Table on Market opportunity by Application ($ million)
7 Market Segmentation by Type
- 7.1 Market segments
- Chart on Type - Market share 2023-2028 (%)
- Data Table on Type - Market share 2023-2028 (%)
- 7.2 Comparison by Type
- Chart on Comparison by Type
- Data Table on Comparison by Type
- 7.3 Direct metal laser sintering (DMLS) - Market size and forecast 2023-2028
- Chart on Direct metal laser sintering (DMLS) - Market size and forecast 2023-2028 ($ million)
- Data Table on Direct metal laser sintering (DMLS) - Market size and forecast 2023-2028 ($ million)
- Chart on Direct metal laser sintering (DMLS) - Year-over-year growth 2023-2028 (%)
- Data Table on Direct metal laser sintering (DMLS) - Year-over-year growth 2023-2028 (%)
- 7.4 Selective laser sintering (SLS) - Market size and forecast 2023-2028
- Chart on Selective laser sintering (SLS) - Market size and forecast 2023-2028 ($ million)
- Data Table on Selective laser sintering (SLS) - Market size and forecast 2023-2028 ($ million)
- Chart on Selective laser sintering (SLS) - Year-over-year growth 2023-2028 (%)
- Data Table on Selective laser sintering (SLS) - Year-over-year growth 2023-2028 (%)
- 7.5 Electron beam melting (EBM) - Market size and forecast 2023-2028
- Chart on Electron beam melting (EBM) - Market size and forecast 2023-2028 ($ million)
- Data Table on Electron beam melting (EBM) - Market size and forecast 2023-2028 ($ million)
- Chart on Electron beam melting (EBM) - Year-over-year growth 2023-2028 (%)
- Data Table on Electron beam melting (EBM) - Year-over-year growth 2023-2028 (%)
- 7.6 Selective laser melting (SLM) - Market size and forecast 2023-2028
- Chart on Selective laser melting (SLM) - Market size and forecast 2023-2028 ($ million)
- Data Table on Selective laser melting (SLM) - Market size and forecast 2023-2028 ($ million)
- Chart on Selective laser melting (SLM) - Year-over-year growth 2023-2028 (%)
- Data Table on Selective laser melting (SLM) - Year-over-year growth 2023-2028 (%)
- 7.7 Market opportunity by Type
- Market opportunity by Type ($ million)
- Data Table on Market opportunity by Type ($ million)
8 Customer Landscape
- 8.1 Customer landscape overview
- Analysis of price sensitivity, lifecycle, customer purchase basket, adoption rates, and purchase criteria
9 Geographic Landscape
- 9.1 Geographic segmentation
- Chart on Market share By Geographical Landscape 2023-2028 (%)
- Data Table on Market share By Geographical Landscape 2023-2028 (%)
- 9.2 Geographic comparison
- Chart on Geographic comparison
- Data Table on Geographic comparison
- 9.3 North America - Market size and forecast 2023-2028
- Chart on North America - Market size and forecast 2023-2028 ($ million)
- Data Table on North America - Market size and forecast 2023-2028 ($ million)
- Chart on North America - Year-over-year growth 2023-2028 (%)
- Data Table on North America - Year-over-year growth 2023-2028 (%)
- 9.4 Europe - Market size and forecast 2023-2028
- Chart on Europe - Market size and forecast 2023-2028 ($ million)
- Data Table on Europe - Market size and forecast 2023-2028 ($ million)
- Chart on Europe - Year-over-year growth 2023-2028 (%)
- Data Table on Europe - Year-over-year growth 2023-2028 (%)
- 9.5 APAC - Market size and forecast 2023-2028
- Chart on APAC - Market size and forecast 2023-2028 ($ million)
- Data Table on APAC - Market size and forecast 2023-2028 ($ million)
- Chart on APAC - Year-over-year growth 2023-2028 (%)
- Data Table on APAC - Year-over-year growth 2023-2028 (%)
- 9.6 South America - Market size and forecast 2023-2028
- Chart on South America - Market size and forecast 2023-2028 ($ million)
- Data Table on South America - Market size and forecast 2023-2028 ($ million)
- Chart on South America - Year-over-year growth 2023-2028 (%)
- Data Table on South America - Year-over-year growth 2023-2028 (%)
- 9.7 Middle East and Africa - Market size and forecast 2023-2028
- Chart on Middle East and Africa - Market size and forecast 2023-2028 ($ million)
- Data Table on Middle East and Africa - Market size and forecast 2023-2028 ($ million)
- Chart on Middle East and Africa - Year-over-year growth 2023-2028 (%)
- Data Table on Middle East and Africa - Year-over-year growth 2023-2028 (%)
- 9.8 US - Market size and forecast 2023-2028
- Chart on US - Market size and forecast 2023-2028 ($ million)
- Data Table on US - Market size and forecast 2023-2028 ($ million)
- Chart on US - Year-over-year growth 2023-2028 (%)
- Data Table on US - Year-over-year growth 2023-2028 (%)
- 9.9 China - Market size and forecast 2023-2028
- Chart on China - Market size and forecast 2023-2028 ($ million)
- Data Table on China - Market size and forecast 2023-2028 ($ million)
- Chart on China - Year-over-year growth 2023-2028 (%)
- Data Table on China - Year-over-year growth 2023-2028 (%)
- 9.10 Germany - Market size and forecast 2023-2028
- Chart on Germany - Market size and forecast 2023-2028 ($ million)
- Data Table on Germany - Market size and forecast 2023-2028 ($ million)
- Chart on Germany - Year-over-year growth 2023-2028 (%)
- Data Table on Germany - Year-over-year growth 2023-2028 (%)
- 9.11 UK - Market size and forecast 2023-2028
- Chart on UK - Market size and forecast 2023-2028 ($ million)
- Data Table on UK - Market size and forecast 2023-2028 ($ million)
- Chart on UK - Year-over-year growth 2023-2028 (%)
- Data Table on UK - Year-over-year growth 2023-2028 (%)
- 9.12 France - Market size and forecast 2023-2028
- Chart on France - Market size and forecast 2023-2028 ($ million)
- Data Table on France - Market size and forecast 2023-2028 ($ million)
- Chart on France - Year-over-year growth 2023-2028 (%)
- Data Table on France - Year-over-year growth 2023-2028 (%)
- 9.13 Market opportunity By Geographical Landscape
- Market opportunity By Geographical Landscape ($ million)
- Data Tables on Market opportunity By Geographical Landscape ($ million)
10 Drivers, Challenges, and Opportunity/Restraints
- 10.1 Market drivers
- 10.2 Market challenges
- 10.3 Impact of drivers and challenges
- Impact of drivers and challenges in 2023 and 2028
- 10.4 Market opportunities/restraints
11 Competitive Landscape
- 11.1 Overview
- 11.2 Competitive Landscape
- Overview on criticality of inputs and factors of differentiation
- 11.3 Landscape disruption
- Overview on factors of disruption
- 11.4 Industry risks
- Impact of key risks on business
12 Competitive Analysis
- 12.1 Companies profiled
- Companies covered
- 12.2 Market positioning of companies
- Matrix on companies position and classification
- 3D Systems Corp.
- 3D Systems Corp. - Overview
- 3D Systems Corp. - Business segments
- 3D Systems Corp. - Key news
- 3D Systems Corp. - Key offerings
- 3D Systems Corp. - Segment focus
- 12.4 Additive Industries BV
- Additive Industries BV - Overview
- Additive Industries BV - Product / Service
- Additive Industries BV - Key offerings
- 12.5 Desktop Metal Inc.
- Desktop Metal Inc. - Overview
- Desktop Metal Inc. - Business segments
- Desktop Metal Inc. - Key news
- Desktop Metal Inc. - Key offerings
- Desktop Metal Inc. - Segment focus
- 12.6 EOS GmbH
- EOS GmbH - Overview
- EOS GmbH - Product / Service
- EOS GmbH - Key news
- EOS GmbH - Key offerings
- 12.7 FIVES SAS
- FIVES SAS - Overview
- FIVES SAS - Business segments
- FIVES SAS - Key offerings
- FIVES SAS - Segment focus
- 12.8 General Electric Co.
- General Electric Co. - Overview
- General Electric Co. - Business segments
- General Electric Co. - Key news
- General Electric Co. - Key offerings
- General Electric Co. - Segment focus
- 12.9 Hoganas AB
- Hoganas AB - Overview
- Hoganas AB - Product / Service
- Hoganas AB - Key offerings
- 12.10 Markforged Holding Corp.
- Markforged Holding Corp. - Overview
- Markforged Holding Corp. - Product / Service
- Markforged Holding Corp. - Key offerings
- 12.11 MATERIALISE NV
- MATERIALISE NV - Overview
- MATERIALISE NV - Business segments
- MATERIALISE NV - Key news
- MATERIALISE NV - Key offerings
- MATERIALISE NV - Segment focus
- 12.12 Nikon Corp.
- Nikon Corp. - Overview
- Nikon Corp. - Business segments
- Nikon Corp. - Key news
- Nikon Corp. - Key offerings
- Nikon Corp. - Segment focus
- 12.13 Renishaw Plc
- Renishaw Plc - Overview
- Renishaw Plc - Business segments
- Renishaw Plc - Key offerings
- Renishaw Plc - Segment focus
- 12.14 Stratasys Ltd.
- Stratasys Ltd. - Overview
- Stratasys Ltd. - Product / Service
- Stratasys Ltd. - Key news
- Stratasys Ltd. - Key offerings
- 12.15 TRUMPF SE Co. KG
- TRUMPF SE Co. KG - Overview
- TRUMPF SE Co. KG - Product / Service
- TRUMPF SE Co. KG - Key offerings
- 12.16 Velo3D Inc.
- Velo3D Inc. - Overview
- Velo3D Inc. - Product / Service
- Velo3D Inc. - Key offerings
- 12.17 voxeljet AG
- voxeljet AG - Overview
- voxeljet AG - Business segments
- voxeljet AG - Key news
- voxeljet AG - Key offerings
- voxeljet AG - Segment focus
13 Appendix
- 13.1 Scope of the report
- 13.2 Inclusions and exclusions checklist
- Inclusions checklist
- Exclusions checklist
- 13.3 Currency conversion rates for US$
- Currency conversion rates for US$
- 13.4 Research methodology
- Research methodology
- 13.5 Data procurement
- Information sources
- 13.6 Data validation
- Data validation
- 13.7 Validation techniques employed for market sizing
- Validation techniques employed for market sizing
- 13.8 Data synthesis
- Data synthesis
- 13.9 360 degree market analysis
- 360 degree market analysis
- 13.10 List of abbreviations
- List of abbreviations

