|
|
市場調査レポート
商品コード
1911130
テレコムクラウドの世界市場、2026年~2030年Global Telecom Cloud Market 2026-2030 |
||||||
|
|||||||
カスタマイズ可能
|
|||||||

| テレコムクラウドの世界市場、2026年~2030年 |
|
出版日: 2026年01月14日
発行: TechNavio
ページ情報: 英文 295 Pages
納期: 即納可能
|

概要
世界のテレコムクラウド市場は、2025年から2030年の間に1,260億80万米ドルの成長が見込まれ、予測期間中のCAGRは34.9%と予測されています。
本報告書では、世界のテレコムクラウド市場に関する包括的な分析、市場規模と予測、動向、成長要因、課題に加え、約25社のベンダー分析を提供しています。
本レポートは、現在の市場状況、最新の動向と促進要因、市場環境全般に関する最新の分析を提供します。市場は、企業モビリティの増加と効率性向上の必要性、企業による研究開発投資、5G技術の台頭によって牽引されています。
本調査は、業界の主要関係者からの情報を含む一次情報と二次情報を客観的に組み合わせて実施されました。本レポートには、主要企業の分析に加え、包括的な市場規模データ、地域別分析を伴うセグメント、ベンダー情勢が含まれています。レポートには過去データと予測データが記載されています。
| 市場範囲 | |
|---|---|
| 基準年 | 2026年 |
| 終了年 | 2030年 |
| 予測期間 | 2026年~2030年 |
| 成長モメンタム | 加速 |
| 前年比2026年 | 27.4% |
| CAGR | 34.9% |
| 増分額 | 1,260億80万米ドル |
本調査では、COVID-19後の通信依存度の高まりが、今後数年間における世界のテレコムクラウド市場成長を牽引する主要な要因の一つであると特定しています。また、IoTやAIなどの技術進歩、ならびにテレコムクラウド管理ソフトウェアの導入拡大が、市場における相当な需要を生み出すものと見込まれます。
目次
第1章 エグゼクティブサマリー
- 市場概要
第2章 Technavio分析
- 価格反応性・ライフサイクル・顧客購入バスケット・採用率・購入基準の分析
- インプットの重要性と差別化の要因
- 混乱の要因
- 促進要因と課題の影響
第3章 市場情勢
- 市場エコシステム
- 市場の特徴
- バリューチェーン分析
第4章 市場規模
- 市場の定義
- 市場セグメント分析
- 市場規模、2025年
- 市場の見通し、2025年~2030年
第5章 市場規模実績
- 世界のテレコムクラウド市場、2020年~2024年
- 展開セグメント分析、2020年~2024年
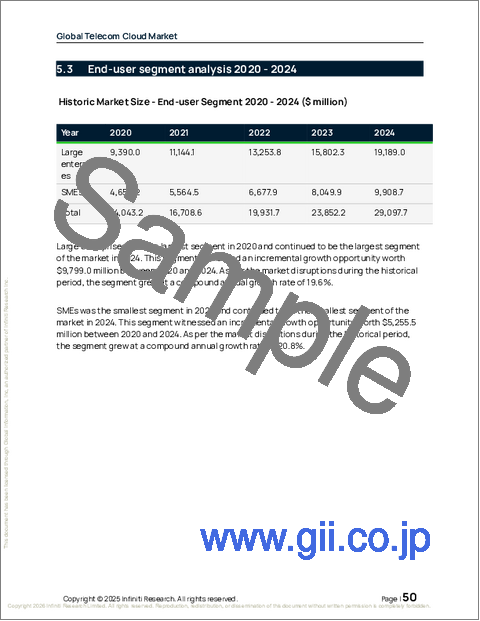
- エンドユーザーセグメント分析、2020年~2024年
- サービスセグメント分析、2020年~2024年
- 地域別セグメント分析、2020年~2024年
- 国別セグメント分析、2020年~2024年
第6章 定性分析
- AIの影響:世界のテレコムクラウド市場
第7章 ファイブフォース分析
- ファイブフォースの要約
- 買い手の交渉力
- 供給企業の交渉力
- 新規参入業者の脅威
- 代替品の脅威
- 競争の脅威
- 市況
第8章 市場セグメンテーション:展開別
- 市場セグメント
- 比較:展開別
- パブリック:市場規模と予測、2025年~2030年
- プライベート:市場規模と予測、2025年~2030年
- ハイブリッド:市場規模と予測、2025年~2030年
- 市場機会:展開別
第9章 市場セグメンテーション:エンドユーザー別
- 市場セグメント
- 比較:エンドユーザー別
- 大企業:市場規模と予測、2025年~2030年
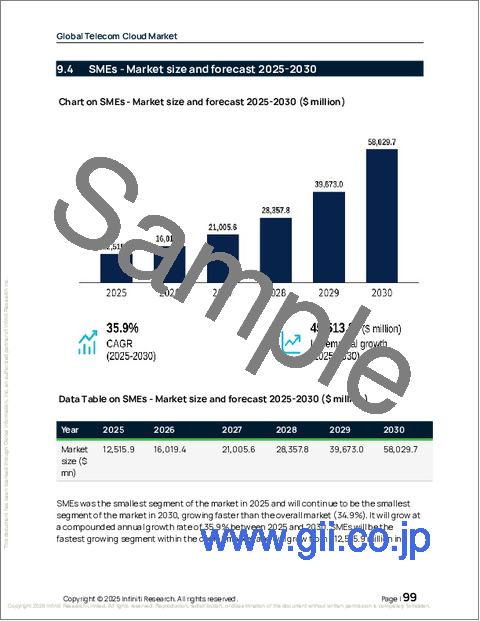
- 中小企業:市場規模と予測、2025年~2030年
- 市場機会:エンドユーザー別
第10章 市場セグメンテーション:サービス別
- 市場セグメント
- 比較:サービス別
- IaaS:市場規模と予測、2025年~2030年
- SaaS:市場規模と予測、2025年~2030年
- PaaS:市場規模と予測、2025年~2030年
- NaaS:市場規模と予測、2025年~2030年
- 市場機会:サービス別
第11章 顧客情勢
- 顧客情勢の概要
第12章 地域別情勢
- 地域別セグメンテーション
- 地域別比較
- 北米:市場規模と予測、2025年~2030年
- 欧州:市場規模と予測、2025年~2030年
- アジア太平洋地域:市場規模と予測、2025年~2030年
- 南米:市場規模と予測、2025年~2030年
- 中東・アフリカ:市場規模と予測、2025年~2030年
- 市場機会:地域別
第13章 促進要因、課題、機会
- 市場促進要因
- 市場の課題
- 促進要因と課題の影響
- 市場機会
第14章 競合情勢
- 概要
- 競合情勢
- 混乱の状況
- 業界のリスク
第15章 競合分析
- 企業プロファイル
- 企業ランキング指標
- 企業の市場ポジショニング
- Amazon Web Services Inc.
- AT and T Inc.
- BT Group Plc
- Cisco Systems Inc.
- Deutsche Telekom AG
- Fortinet Inc.
- Google LLC
- Huawei Technologies Co. Ltd.
- IBM Corp.
- Juniper Networks Inc.
- Mavenir Systems Inc.
- Microsoft Corp.
- Oracle Corp.
- Orange SA
- VMware Inc.

