|
|
市場調査レポート
商品コード
1502065
リグノセルロース原料ベースバイオ燃料の世界市場 2024-2028Global lignocellulosic feedstock-based biofuel market 2024-2028 |
||||||
|
|||||||
カスタマイズ可能
|
|||||||

| リグノセルロース原料ベースバイオ燃料の世界市場 2024-2028 |
|
出版日: 2024年05月22日
発行: TechNavio
ページ情報: 英文 172 Pages
納期: 即納可能
|

全表示
- 概要
- 図表
- 目次
リグノセルロース原料ベースバイオ燃料市場は2023-2028年に336億4,820万米ドル、予測期間中のCAGRは50.35%で成長すると予測されます。
当レポートでは、リグノセルロース原料ベースバイオ燃料市場について、市場規模や予測、動向、成長促進要因、25社前後のベンダーを網羅した総合的な分析を掲載しています。
現在の市場シナリオ、最新動向と促進要因、市場環境全体に関する最新分析を提供しています。リグノセルロース原料の非農耕地への影響、輸送燃料としてのバイオエタノールの採用拡大、温室効果ガス排出削減に関する厳しい規制などが市場を牽引しています。
| 市場範囲 | |
|---|---|
| 基準年 | 2024 |
| 終了年 | 2028 |
| 予測期間 | 2024-2028 |
| 成長モメンタム | 加速 |
| 前年比2024年 | 38.86% |
| CAGR | 50.35% |
| 増分額 | 336億4,820万米ドル |
本調査では、今後数年間のリグノセルロース原料ベースバイオ燃料市場の成長を牽引する主な要因の一つとして、エタノール混合率の目標値の上昇を挙げています。また、第二世代バイオ燃料を生産するための政府支援の増加や、統合廃棄物管理システムの出現は、市場の大きな需要につながります。
目次
第1章 エグゼクティブサマリー
- 市場概要
第2章 市場情勢
- 市場エコシステム
- 市場の特徴
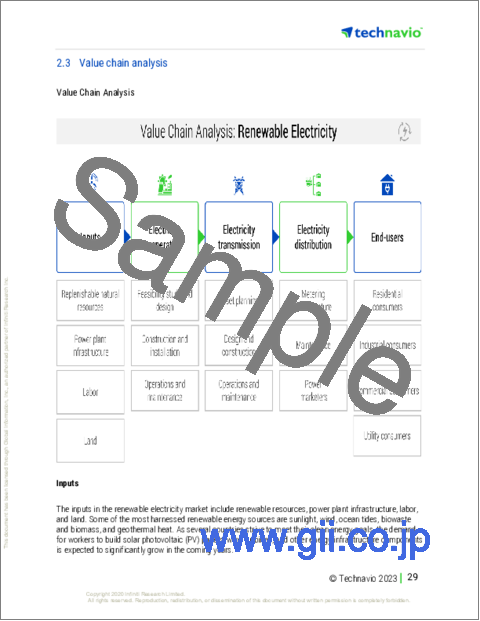
- バリューチェーン分析
第3章 市場規模の評価
- 市場の定義
- 市場セグメント分析
- 市場規模 2023
- 市場の見通し 2023-2028
第4章 市場規模実績
- 世界のリグノセルロース原料ベースバイオ燃料市場 2018-2022
- 変換プロセス別セグメント分析 2018-2022
- 用途別セグメント分析 2018-2022
- 地域別セグメント分析 2018-2022
- 国別セグメント分析 2018-2022
第5章 ファイブフォース分析
- ファイブフォースの要約
- 買い手の交渉力
- 供給企業の交渉力
- 新規参入業者の脅威
- 代替品の脅威
- 競争の脅威
- 市況
第6章 市場セグメンテーション:変換プロセス別
- 市場セグメンテーション
- 比較:変換プロセス別
- 生化学的:市場規模と予測 2023-2028
- 熱化学:市場規模と予測 2023-2028
- 市場機会:変換プロセス別
第7章 市場セグメンテーション:用途別
- 市場セグメンテーション
- 比較:用途別
- 自動車:市場規模と予測 2023-2028
- 航空:市場規模と予測 2023-2028
- その他:市場規模と予測 2023-2028
- 市場機会:用途別
第8章 顧客情勢
- 顧客情勢の概要
第9章 地域別情勢
- 地域別セグメンテーション
- 地域別比較
- 北米:市場規模と予測 2023-2028
- 南米:市場規模と予測 2023-2028
- 欧州:市場規模と予測 2023-2028
- アジア太平洋:市場規模と予測 2023-2028
- 中東・アフリカ:市場規模と予測 2023-2028
- 米国:市場規模と予測 2023-2028
- 中国:市場規模と予測 2023-2028
- ブラジル:市場規模と予測 2023-2028
- カナダ:市場規模と予測 2023-2028
- ドイツ:市場規模と予測 2023-2028
- 市場機会:地域別
第10章 促進要因・課題・機会・抑制要因
- 市場促進要因
- 市場の課題
- 促進要因と課題の影響
- 市場の機会・抑制要因
第11章 競合情勢
- 概要
- 競合情勢
- 混乱の状況
- 業界のリスク
第12章 競合分析
- 企業プロファイル
- 企業の市場ポジショニング
- Aemetis Inc.
- ALTRET GREENFUELS Ltd
- BDI BioEnergy International GmbH
- Blue Biofuels Inc.
- Borregaard ASA
- China Petrochemical Corp.
- Clariant International Ltd.
- COSAN S.A.
- DuPont de Nemours Inc.
- ENERKEM Inc.
- Gevo Inc.
- GranBio Investimentos SA
- New Energy Blue LLC
- Novozymes AS
- VERBIO Vereinigte BioEnergie AG
第13章 付録
Exhibits:
- Exhibits1: Executive Summary - Chart on Market Overview
- Exhibits2: Executive Summary - Data Table on Market Overview
- Exhibits3: Executive Summary - Chart on Global Market Characteristics
- Exhibits4: Executive Summary - Chart on Market by Geography
- Exhibits5: Executive Summary - Chart on Market Segmentation by Conversion Process
- Exhibits6: Executive Summary - Chart on Market Segmentation by Application
- Exhibits7: Executive Summary - Chart on Incremental Growth
- Exhibits8: Executive Summary - Data Table on Incremental Growth
- Exhibits9: Executive Summary - Chart on Company Market Positioning
- Exhibits10: Parent Market
- Exhibits11: Data Table on - Parent Market
- Exhibits12: Market characteristics analysis
- Exhibits13: Value Chain Analysis
- Exhibits14: Offerings of companies included in the market definition
- Exhibits15: Market segments
- Exhibits16: Chart on Global - Market size and forecast 2023-2028 ($ million)
- Exhibits17: Data Table on Global - Market size and forecast 2023-2028 ($ million)
- Exhibits18: Chart on Global Market: Year-over-year growth 2023-2028 (%)
- Exhibits19: Data Table on Global Market: Year-over-year growth 2023-2028 (%)
- Exhibits20: Historic Market Size - Data Table on Global Lignocellulosic Feedstock-Based Biofuel Market 2018 - 2022 ($ million)
- Exhibits21: Historic Market Size - Conversion Process Segment 2018 - 2022 ($ million)
- Exhibits22: Historic Market Size - Application Segment 2018 - 2022 ($ million)
- Exhibits23: Historic Market Size - Geography Segment 2018 - 2022 ($ million)
- Exhibits24: Historic Market Size - Country Segment 2018 - 2022 ($ million)
- Exhibits25: Five forces analysis - Comparison between 2023 and 2028
- Exhibits26: Bargaining power of buyers - Impact of key factors 2023 and 2028
- Exhibits27: Bargaining power of suppliers - Impact of key factors in 2023 and 2028
- Exhibits28: Threat of new entrants - Impact of key factors in 2023 and 2028
- Exhibits29: Threat of substitutes - Impact of key factors in 2023 and 2028
- Exhibits30: Threat of rivalry - Impact of key factors in 2023 and 2028
- Exhibits31: Chart on Market condition - Five forces 2023 and 2028
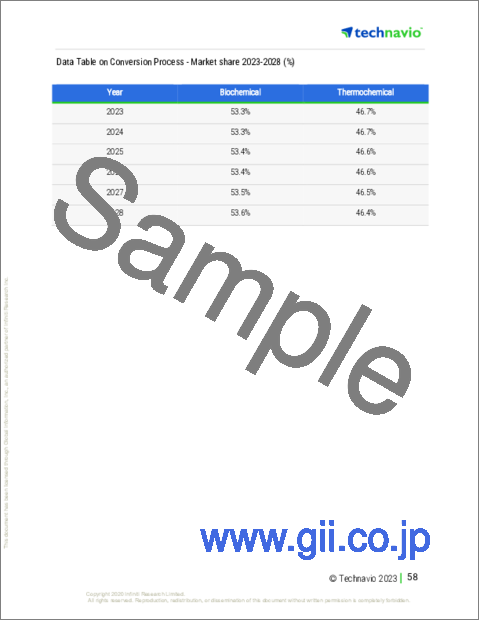
- Exhibits32: Chart on Conversion Process - Market share 2023-2028 (%)
- Exhibits33: Data Table on Conversion Process - Market share 2023-2028 (%)
- Exhibits34: Chart on Comparison by Conversion Process
- Exhibits35: Data Table on Comparison by Conversion Process
- Exhibits36: Chart on Biochemical - Market size and forecast 2023-2028 ($ million)
- Exhibits37: Data Table on Biochemical - Market size and forecast 2023-2028 ($ million)
- Exhibits38: Chart on Biochemical - Year-over-year growth 2023-2028 (%)
- Exhibits39: Data Table on Biochemical - Year-over-year growth 2023-2028 (%)
- Exhibits40: Chart on Thermochemical - Market size and forecast 2023-2028 ($ million)
- Exhibits41: Data Table on Thermochemical - Market size and forecast 2023-2028 ($ million)
- Exhibits42: Chart on Thermochemical - Year-over-year growth 2023-2028 (%)
- Exhibits43: Data Table on Thermochemical - Year-over-year growth 2023-2028 (%)
- Exhibits44: Market opportunity by Conversion Process ($ million)
- Exhibits45: Data Table on Market opportunity by Conversion Process ($ million)
- Exhibits46: Chart on Application - Market share 2023-2028 (%)
- Exhibits47: Data Table on Application - Market share 2023-2028 (%)
- Exhibits48: Chart on Comparison by Application
- Exhibits49: Data Table on Comparison by Application
- Exhibits50: Chart on Automotive - Market size and forecast 2023-2028 ($ million)
- Exhibits51: Data Table on Automotive - Market size and forecast 2023-2028 ($ million)
- Exhibits52: Chart on Automotive - Year-over-year growth 2023-2028 (%)
- Exhibits53: Data Table on Automotive - Year-over-year growth 2023-2028 (%)
- Exhibits54: Chart on Aviation - Market size and forecast 2023-2028 ($ million)
- Exhibits55: Data Table on Aviation - Market size and forecast 2023-2028 ($ million)
- Exhibits56: Chart on Aviation - Year-over-year growth 2023-2028 (%)
- Exhibits57: Data Table on Aviation - Year-over-year growth 2023-2028 (%)
- Exhibits58: Chart on Others - Market size and forecast 2023-2028 ($ million)
- Exhibits59: Data Table on Others - Market size and forecast 2023-2028 ($ million)
- Exhibits60: Chart on Others - Year-over-year growth 2023-2028 (%)
- Exhibits61: Data Table on Others - Year-over-year growth 2023-2028 (%)
- Exhibits62: Market opportunity by Application ($ million)
- Exhibits63: Data Table on Market opportunity by Application ($ million)
- Exhibits64: Analysis of price sensitivity, lifecycle, customer purchase basket, adoption rates, and purchase criteria
- Exhibits65: Chart on Market share By Geographical Landscape2023-2028 (%)
- Exhibits66: Data Table on Market share By Geographical Landscape2023-2028 (%)
- Exhibits67: Chart on Geographic comparison
- Exhibits68: Data Table on Geographic comparison
- Exhibits69: Chart on North America - Market size and forecast 2023-2028 ($ million)
- Exhibits70: Data Table on North America - Market size and forecast 2023-2028 ($ million)
- Exhibits71: Chart on North America - Year-over-year growth 2023-2028 (%)
- Exhibits72: Data Table on North America - Year-over-year growth 2023-2028 (%)
- Exhibits73: Chart on South America - Market size and forecast 2023-2028 ($ million)
- Exhibits74: Data Table on South America - Market size and forecast 2023-2028 ($ million)
- Exhibits75: Chart on South America - Year-over-year growth 2023-2028 (%)
- Exhibits76: Data Table on South America - Year-over-year growth 2023-2028 (%)
- Exhibits77: Chart on Europe - Market size and forecast 2023-2028 ($ million)
- Exhibits78: Data Table on Europe - Market size and forecast 2023-2028 ($ million)
- Exhibits79: Chart on Europe - Year-over-year growth 2023-2028 (%)
- Exhibits80: Data Table on Europe - Year-over-year growth 2023-2028 (%)
- Exhibits81: Chart on APAC - Market size and forecast 2023-2028 ($ million)
- Exhibits82: Data Table on APAC - Market size and forecast 2023-2028 ($ million)
- Exhibits83: Chart on APAC - Year-over-year growth 2023-2028 (%)
- Exhibits84: Data Table on APAC - Year-over-year growth 2023-2028 (%)
- Exhibits85: Chart on Middle East and Africa - Market size and forecast 2023-2028 ($ million)
- Exhibits86: Data Table on Middle East and Africa - Market size and forecast 2023-2028 ($ million)
- Exhibits87: Chart on Middle East and Africa - Year-over-year growth 2023-2028 (%)
- Exhibits88: Data Table on Middle East and Africa - Year-over-year growth 2023-2028 (%)
- Exhibits89: Chart on US - Market size and forecast 2023-2028 ($ million)
- Exhibits90: Data Table on US - Market size and forecast 2023-2028 ($ million)
- Exhibits91: Chart on US - Year-over-year growth 2023-2028 (%)
- Exhibits92: Data Table on US - Year-over-year growth 2023-2028 (%)
- Exhibits93: Chart on China - Market size and forecast 2023-2028 ($ million)
- Exhibits94: Data Table on China - Market size and forecast 2023-2028 ($ million)
- Exhibits95: Chart on China - Year-over-year growth 2023-2028 (%)
- Exhibits96: Data Table on China - Year-over-year growth 2023-2028 (%)
- Exhibits97: Chart on Brazil - Market size and forecast 2023-2028 ($ million)
- Exhibits98: Data Table on Brazil - Market size and forecast 2023-2028 ($ million)
- Exhibits99: Chart on Brazil - Year-over-year growth 2023-2028 (%)
- Exhibits100: Data Table on Brazil - Year-over-year growth 2023-2028 (%)
- Exhibits101: Chart on Canada - Market size and forecast 2023-2028 ($ million)
- Exhibits102: Data Table on Canada - Market size and forecast 2023-2028 ($ million)
- Exhibits103: Chart on Canada - Year-over-year growth 2023-2028 (%)
- Exhibits104: Data Table on Canada - Year-over-year growth 2023-2028 (%)
- Exhibits105: Chart on Germany - Market size and forecast 2023-2028 ($ million)
- Exhibits106: Data Table on Germany - Market size and forecast 2023-2028 ($ million)
- Exhibits107: Chart on Germany - Year-over-year growth 2023-2028 (%)
- Exhibits108: Data Table on Germany - Year-over-year growth 2023-2028 (%)
- Exhibits109: Market opportunity By Geographical Landscape($ million)
- Exhibits110: Data Tables on Market opportunity By Geographical Landscape($ million)
- Exhibits111: Impact of drivers and challenges in 2023 and 2028
- Exhibits112: Overview on criticality of inputs and factors of differentiation
- Exhibits113: Overview on factors of disruption
- Exhibits114: Impact of key risks on business
- Exhibits115: Companies covered
- Exhibits116: Matrix on companies position and classification
- Exhibits117: Aemetis Inc. - Overview
- Exhibits118: Aemetis Inc. - Business segments
- Exhibits119: Aemetis Inc. - Key offerings
- Exhibits120: Aemetis Inc. - Segment focus
- Exhibits121: ALTRET GREENFUELS Ltd - Overview
- Exhibits122: ALTRET GREENFUELS Ltd - Product / Service
- Exhibits123: ALTRET GREENFUELS Ltd - Key offerings
- Exhibits124: BDI BioEnergy International GmbH - Overview
- Exhibits125: BDI BioEnergy International GmbH - Product / Service
- Exhibits126: BDI BioEnergy International GmbH - Key offerings
- Exhibits127: Blue Biofuels Inc. - Overview
- Exhibits128: Blue Biofuels Inc. - Product / Service
- Exhibits129: Blue Biofuels Inc. - Key offerings
- Exhibits130: Borregaard ASA - Overview
- Exhibits131: Borregaard ASA - Business segments
- Exhibits132: Borregaard ASA - Key offerings
- Exhibits133: Borregaard ASA - Segment focus
- Exhibits134: China Petrochemical Corp. - Overview
- Exhibits135: China Petrochemical Corp. - Business segments
- Exhibits136: China Petrochemical Corp. - Key news
- Exhibits137: China Petrochemical Corp. - Key offerings
- Exhibits138: China Petrochemical Corp. - Segment focus
- Exhibits139: Clariant International Ltd. - Overview
- Exhibits140: Clariant International Ltd. - Business segments
- Exhibits141: Clariant International Ltd. - Key news
- Exhibits142: Clariant International Ltd. - Key offerings
- Exhibits143: Clariant International Ltd. - Segment focus
- Exhibits144: COSAN S.A. - Overview
- Exhibits145: COSAN S.A. - Product / Service
- Exhibits146: COSAN S.A. - Key offerings
- Exhibits147: DuPont de Nemours Inc. - Overview
- Exhibits148: DuPont de Nemours Inc. - Business segments
- Exhibits149: DuPont de Nemours Inc. - Key news
- Exhibits150: DuPont de Nemours Inc. - Key offerings
- Exhibits151: DuPont de Nemours Inc. - Segment focus
- Exhibits152: ENERKEM Inc. - Overview
- Exhibits153: ENERKEM Inc. - Product / Service
- Exhibits154: ENERKEM Inc. - Key offerings
- Exhibits155: Gevo Inc. - Overview
- Exhibits156: Gevo Inc. - Business segments
- Exhibits157: Gevo Inc. - Key offerings
- Exhibits158: Gevo Inc. - Segment focus
- Exhibits159: GranBio Investimentos SA - Overview
- Exhibits160: GranBio Investimentos SA - Product / Service
- Exhibits161: GranBio Investimentos SA - Key offerings
- Exhibits162: New Energy Blue LLC - Overview
- Exhibits163: New Energy Blue LLC - Product / Service
- Exhibits164: New Energy Blue LLC - Key offerings
- Exhibits165: Novozymes AS - Overview
- Exhibits166: Novozymes AS - Product / Service
- Exhibits167: Novozymes AS - Key offerings
- Exhibits168: VERBIO Vereinigte BioEnergie AG - Overview
- Exhibits169: VERBIO Vereinigte BioEnergie AG - Business segments
- Exhibits170: VERBIO Vereinigte BioEnergie AG - Key offerings
- Exhibits171: VERBIO Vereinigte BioEnergie AG - Segment focus
- Exhibits172: Inclusions checklist
- Exhibits173: Exclusions checklist
- Exhibits174: Currency conversion rates for US$
- Exhibits175: Research methodology
- Exhibits176: Information sources
- Exhibits177: Data validation
- Exhibits178: Validation techniques employed for market sizing
- Exhibits179: Data synthesis
- Exhibits180: 360 degree market analysis
- Exhibits181: List of abbreviations
The lignocellulosic feedstock-based biofuel market is forecasted to grow by USD 33648.2 mn during 2023-2028, accelerating at a CAGR of 50.35% during the forecast period. The report on the lignocellulosic feedstock-based biofuel market provides a holistic analysis, market size and forecast, trends, growth drivers, and challenges, as well as vendor analysis covering around 25 vendors.
The report offers an up-to-date analysis regarding the current market scenario, the latest trends and drivers, and the overall market environment. The market is driven by non-cropland affecting nature of lignocellulosic feedstock, growing adoption of bioethanol as transport fuel, and stringent regulations pertaining to reduction of ghg emissions.
Technavio's lignocellulosic feedstock-based biofuel market is segmented as below:
| Market Scope | |
|---|---|
| Base Year | 2024 |
| End Year | 2028 |
| Series Year | 2024-2028 |
| Growth Momentum | Accelerate |
| YOY 2024 | 38.86% |
| CAGR | 50.35% |
| Incremental Value | $33648.2mn |
By Conversion Process
- Biochemical
- Thermochemical
By Application
- Automotive
- Aviation
- Others
By Geography
- North America
- South America
- Europe
- APAC
- Middle East and Africa
This study identifies the rising ethanol blending rate targets as one of the prime reasons driving the lignocellulosic feedstock-based biofuel market growth during the next few years. Also, increasing government support to produce second-generation biofuels and emergence of integrated waste management system will lead to sizable demand in the market.
The report on the lignocellulosic feedstock-based biofuel market covers the following areas:
- Lignocellulosic feedstock-based biofuel market sizing
- Lignocellulosic feedstock-based biofuel market forecast
- Lignocellulosic feedstock-based biofuel market industry analysis
The robust vendor analysis is designed to help clients improve their market position, and in line with this, this report provides a detailed analysis of several leading lignocellulosic feedstock-based biofuel market vendors that include Aemetis Inc., ALTRET GREENFUELS Ltd, BDI BioEnergy International GmbH, Blue Biofuels Inc., Borregaard ASA, China Petrochemical Corp., Clariant International Ltd., COSAN S.A., DuPont de Nemours Inc., ENERKEM Inc., Genera Inc., Gevo Inc., GranBio Investimentos SA, New Energy Blue LLC, Novozymes AS, and VERBIO Vereinigte BioEnergie AG. Also, the lignocellulosic feedstock-based biofuel market analysis report includes information on upcoming trends and challenges that will influence market growth. This is to help companies strategize and leverage all forthcoming growth opportunities.
The study was conducted using an objective combination of primary and secondary information including inputs from key participants in the industry. The report contains a comprehensive market and vendor landscape in addition to an analysis of the key vendors.
The publisher presents a detailed picture of the market by the way of study, synthesis, and summation of data from multiple sources by an analysis of key parameters such as profit, pricing, competition, and promotions. It presents various market facets by identifying the key industry influencers. The data presented is comprehensive, reliable, and a result of extensive research - both primary and secondary. The market research reports provide a complete competitive landscape and an in-depth vendor selection methodology and analysis using qualitative and quantitative research to forecast the accurate market growth.
Table of Contents
1 Executive Summary
- 1.1 Market overview
- Executive Summary - Chart on Market Overview
- Executive Summary - Data Table on Market Overview
- Executive Summary - Chart on Global Market Characteristics
- Executive Summary - Chart on Market by Geography
- Executive Summary - Chart on Market Segmentation by Conversion Process
- Executive Summary - Chart on Market Segmentation by Application
- Executive Summary - Chart on Incremental Growth
- Executive Summary - Data Table on Incremental Growth
- Executive Summary - Chart on Company Market Positioning
2 Market Landscape
- 2.1 Market ecosystem
- Parent Market
- Data Table on - Parent Market
- 2.2 Market characteristics
- Market characteristics analysis
- 2.3 Value chain analysis
- Value Chain Analysis
3 Market Sizing
- 3.1 Market definition
- Offerings of companies included in the market definition
- 3.2 Market segment analysis
- Market segments
- 3.3 Market size 2023
- 3.4 Market outlook: Forecast for 2023-2028
- Chart on Global - Market size and forecast 2023-2028 ($ million)
- Data Table on Global - Market size and forecast 2023-2028 ($ million)
- Chart on Global Market: Year-over-year growth 2023-2028 (%)
- Data Table on Global Market: Year-over-year growth 2023-2028 (%)
4 Historic Market Size
- 4.1 Global Lignocellulosic Feedstock-Based Biofuel Market 2018 - 2022
- Historic Market Size - Data Table on Global Lignocellulosic Feedstock-Based Biofuel Market 2018 - 2022 ($ million)
- 4.2 Conversion Process segment analysis 2018 - 2022
- Historic Market Size - Conversion Process Segment 2018 - 2022 ($ million)
- 4.3 Application segment analysis 2018 - 2022
- Historic Market Size - Application Segment 2018 - 2022 ($ million)
- 4.4 Geography segment analysis 2018 - 2022
- Historic Market Size - Geography Segment 2018 - 2022 ($ million)
- 4.5 Country segment analysis 2018 - 2022
- Historic Market Size - Country Segment 2018 - 2022 ($ million)
5 Five Forces Analysis
- 5.1 Five forces summary
- Five forces analysis - Comparison between 2023 and 2028
- 5.2 Bargaining power of buyers
- Bargaining power of buyers - Impact of key factors 2023 and 2028
- 5.3 Bargaining power of suppliers
- Bargaining power of suppliers - Impact of key factors in 2023 and 2028
- 5.4 Threat of new entrants
- Threat of new entrants - Impact of key factors in 2023 and 2028
- 5.5 Threat of substitutes
- Threat of substitutes - Impact of key factors in 2023 and 2028
- 5.6 Threat of rivalry
- Threat of rivalry - Impact of key factors in 2023 and 2028
- 5.7 Market condition
- Chart on Market condition - Five forces 2023 and 2028
6 Market Segmentation by Conversion Process
- 6.1 Market segments
- Chart on Conversion Process - Market share 2023-2028 (%)
- Data Table on Conversion Process - Market share 2023-2028 (%)
- 6.2 Comparison by Conversion Process
- Chart on Comparison by Conversion Process
- Data Table on Comparison by Conversion Process
- 6.3 Biochemical - Market size and forecast 2023-2028
- Chart on Biochemical - Market size and forecast 2023-2028 ($ million)
- Data Table on Biochemical - Market size and forecast 2023-2028 ($ million)
- Chart on Biochemical - Year-over-year growth 2023-2028 (%)
- Data Table on Biochemical - Year-over-year growth 2023-2028 (%)
- 6.4 Thermochemical - Market size and forecast 2023-2028
- Chart on Thermochemical - Market size and forecast 2023-2028 ($ million)
- Data Table on Thermochemical - Market size and forecast 2023-2028 ($ million)
- Chart on Thermochemical - Year-over-year growth 2023-2028 (%)
- Data Table on Thermochemical - Year-over-year growth 2023-2028 (%)
- 6.5 Market opportunity by Conversion Process
- Market opportunity by Conversion Process ($ million)
- Data Table on Market opportunity by Conversion Process ($ million)
7 Market Segmentation by Application
- 7.1 Market segments
- Chart on Application - Market share 2023-2028 (%)
- Data Table on Application - Market share 2023-2028 (%)
- 7.2 Comparison by Application
- Chart on Comparison by Application
- Data Table on Comparison by Application
- 7.3 Automotive - Market size and forecast 2023-2028
- Chart on Automotive - Market size and forecast 2023-2028 ($ million)
- Data Table on Automotive - Market size and forecast 2023-2028 ($ million)
- Chart on Automotive - Year-over-year growth 2023-2028 (%)
- Data Table on Automotive - Year-over-year growth 2023-2028 (%)
- 7.4 Aviation - Market size and forecast 2023-2028
- Chart on Aviation - Market size and forecast 2023-2028 ($ million)
- Data Table on Aviation - Market size and forecast 2023-2028 ($ million)
- Chart on Aviation - Year-over-year growth 2023-2028 (%)
- Data Table on Aviation - Year-over-year growth 2023-2028 (%)
- 7.5 Others - Market size and forecast 2023-2028
- Chart on Others - Market size and forecast 2023-2028 ($ million)
- Data Table on Others - Market size and forecast 2023-2028 ($ million)
- Chart on Others - Year-over-year growth 2023-2028 (%)
- Data Table on Others - Year-over-year growth 2023-2028 (%)
- 7.6 Market opportunity by Application
- Market opportunity by Application ($ million)
- Data Table on Market opportunity by Application ($ million)
8 Customer Landscape
- 8.1 Customer landscape overview
- Analysis of price sensitivity, lifecycle, customer purchase basket, adoption rates, and purchase criteria
9 Geographic Landscape
- 9.1 Geographic segmentation
- Chart on Market share By Geographical Landscape2023-2028 (%)
- Data Table on Market share By Geographical Landscape2023-2028 (%)
- 9.2 Geographic comparison
- Chart on Geographic comparison
- Data Table on Geographic comparison
- 9.3 North America - Market size and forecast 2023-2028
- Chart on North America - Market size and forecast 2023-2028 ($ million)
- Data Table on North America - Market size and forecast 2023-2028 ($ million)
- Chart on North America - Year-over-year growth 2023-2028 (%)
- Data Table on North America - Year-over-year growth 2023-2028 (%)
- 9.4 South America - Market size and forecast 2023-2028
- Chart on South America - Market size and forecast 2023-2028 ($ million)
- Data Table on South America - Market size and forecast 2023-2028 ($ million)
- Chart on South America - Year-over-year growth 2023-2028 (%)
- Data Table on South America - Year-over-year growth 2023-2028 (%)
- 9.5 Europe - Market size and forecast 2023-2028
- Chart on Europe - Market size and forecast 2023-2028 ($ million)
- Data Table on Europe - Market size and forecast 2023-2028 ($ million)
- Chart on Europe - Year-over-year growth 2023-2028 (%)
- Data Table on Europe - Year-over-year growth 2023-2028 (%)
- 9.6 APAC - Market size and forecast 2023-2028
- Chart on APAC - Market size and forecast 2023-2028 ($ million)
- Data Table on APAC - Market size and forecast 2023-2028 ($ million)
- Chart on APAC - Year-over-year growth 2023-2028 (%)
- Data Table on APAC - Year-over-year growth 2023-2028 (%)
- 9.7 Middle East and Africa - Market size and forecast 2023-2028
- Chart on Middle East and Africa - Market size and forecast 2023-2028 ($ million)
- Data Table on Middle East and Africa - Market size and forecast 2023-2028 ($ million)
- Chart on Middle East and Africa - Year-over-year growth 2023-2028 (%)
- Data Table on Middle East and Africa - Year-over-year growth 2023-2028 (%)
- 9.8 US - Market size and forecast 2023-2028
- Chart on US - Market size and forecast 2023-2028 ($ million)
- Data Table on US - Market size and forecast 2023-2028 ($ million)
- Chart on US - Year-over-year growth 2023-2028 (%)
- Data Table on US - Year-over-year growth 2023-2028 (%)
- 9.9 China - Market size and forecast 2023-2028
- Chart on China - Market size and forecast 2023-2028 ($ million)
- Data Table on China - Market size and forecast 2023-2028 ($ million)
- Chart on China - Year-over-year growth 2023-2028 (%)
- Data Table on China - Year-over-year growth 2023-2028 (%)
- 9.10 Brazil - Market size and forecast 2023-2028
- Chart on Brazil - Market size and forecast 2023-2028 ($ million)
- Data Table on Brazil - Market size and forecast 2023-2028 ($ million)
- Chart on Brazil - Year-over-year growth 2023-2028 (%)
- Data Table on Brazil - Year-over-year growth 2023-2028 (%)
- 9.11 Canada - Market size and forecast 2023-2028
- Chart on Canada - Market size and forecast 2023-2028 ($ million)
- Data Table on Canada - Market size and forecast 2023-2028 ($ million)
- Chart on Canada - Year-over-year growth 2023-2028 (%)
- Data Table on Canada - Year-over-year growth 2023-2028 (%)
- 9.12 Germany - Market size and forecast 2023-2028
- Chart on Germany - Market size and forecast 2023-2028 ($ million)
- Data Table on Germany - Market size and forecast 2023-2028 ($ million)
- Chart on Germany - Year-over-year growth 2023-2028 (%)
- Data Table on Germany - Year-over-year growth 2023-2028 (%)
- 9.13 Market opportunity by geography
- Market opportunity By Geographical Landscape($ million)
- Data Tables on Market opportunity By Geographical Landscape($ million)
10 Drivers, Challenges, and Opportunity/Restraints
- 10.1 Market drivers
- 10.2 Market challenges
- 10.3 Impact of drivers and challenges
- Impact of drivers and challenges in 2023 and 2028
- 10.4 Market opportunities/restraints
11 Competitive Landscape
- 11.1 Overview
- 11.2 Competitive Landscape
- Overview on criticality of inputs and factors of differentiation
- 11.3 Landscape disruption
- Overview on factors of disruption
- 11.4 Industry risks
- Impact of key risks on business
12 Competitive Analysis
- 12.1 Companies profiled
- Companies covered
- 12.2 Market positioning of companies
- Matrix on companies position and classification
- 12.3 Aemetis Inc.
- Aemetis Inc. - Overview
- Aemetis Inc. - Business segments
- Aemetis Inc. - Key offerings
- Aemetis Inc. - Segment focus
- 12.4 ALTRET GREENFUELS Ltd
- ALTRET GREENFUELS Ltd - Overview
- ALTRET GREENFUELS Ltd - Product / Service
- ALTRET GREENFUELS Ltd - Key offerings
- 12.5 BDI BioEnergy International GmbH
- BDI BioEnergy International GmbH - Overview
- BDI BioEnergy International GmbH - Product / Service
- BDI BioEnergy International GmbH - Key offerings
- 12.6 Blue Biofuels Inc.
- Blue Biofuels Inc. - Overview
- Blue Biofuels Inc. - Product / Service
- Blue Biofuels Inc. - Key offerings
- 12.7 Borregaard ASA
- Borregaard ASA - Overview
- Borregaard ASA - Business segments
- Borregaard ASA - Key offerings
- Borregaard ASA - Segment focus
- 12.8 China Petrochemical Corp.
- China Petrochemical Corp. - Overview
- China Petrochemical Corp. - Business segments
- China Petrochemical Corp. - Key news
- China Petrochemical Corp. - Key offerings
- China Petrochemical Corp. - Segment focus
- 12.9 Clariant International Ltd.
- Clariant International Ltd. - Overview
- Clariant International Ltd. - Business segments
- Clariant International Ltd. - Key news
- Clariant International Ltd. - Key offerings
- Clariant International Ltd. - Segment focus
- 12.10 COSAN S.A.
- COSAN S.A. - Overview
- COSAN S.A. - Product / Service
- COSAN S.A. - Key offerings
- 12.11 DuPont de Nemours Inc.
- DuPont de Nemours Inc. - Overview
- DuPont de Nemours Inc. - Business segments
- DuPont de Nemours Inc. - Key news
- DuPont de Nemours Inc. - Key offerings
- DuPont de Nemours Inc. - Segment focus
- 12.12 ENERKEM Inc.
- ENERKEM Inc. - Overview
- ENERKEM Inc. - Product / Service
- ENERKEM Inc. - Key offerings
- 12.13 Gevo Inc.
- Gevo Inc. - Overview
- Gevo Inc. - Business segments
- Gevo Inc. - Key offerings
- Gevo Inc. - Segment focus
- 12.14 GranBio Investimentos SA
- GranBio Investimentos SA - Overview
- GranBio Investimentos SA - Product / Service
- GranBio Investimentos SA - Key offerings
- 12.15 New Energy Blue LLC
- New Energy Blue LLC - Overview
- New Energy Blue LLC - Product / Service
- New Energy Blue LLC - Key offerings
- 12.16 Novozymes AS
- Novozymes AS - Overview
- Novozymes AS - Product / Service
- Novozymes AS - Key offerings
- 12.17 VERBIO Vereinigte BioEnergie AG
- VERBIO Vereinigte BioEnergie AG - Overview
- VERBIO Vereinigte BioEnergie AG - Business segments
- VERBIO Vereinigte BioEnergie AG - Key offerings
- VERBIO Vereinigte BioEnergie AG - Segment focus
13 Appendix
- 13.1 Scope of the report
- 13.2 Inclusions and exclusions checklist
- Inclusions checklist
- Exclusions checklist
- 13.3 Currency conversion rates for US$
- Currency conversion rates for US$
- 13.4 Research methodology
- Research methodology
- 13.5 Data procurement
- Information sources
- 13.6 Data validation
- Data validation
- 13.7 Validation techniques employed for market sizing
- Validation techniques employed for market sizing
- 13.8 Data synthesis
- Data synthesis
- 13.9 360 degree market analysis
- 360 degree market analysis
- 13.10 List of abbreviations
- List of abbreviations

