|
|
市場調査レポート
商品コード
1502286
救急車サービスの世界市場 2024-2028Global ambulance services market 2024-2028 |
||||||

|
|||||||
カスタマイズ可能
|
|||||||

| 救急車サービスの世界市場 2024-2028 |
|
出版日: 2024年05月20日
発行: TechNavio
ページ情報: 英文 164 Pages
納期: 即納可能
|

全表示
- 概要
- 図表
- 目次
救急車サービス市場は2023-2028年に137億4,730万米ドル、予測期間中のCAGRは6.79%で成長すると予測されています。
この調査レポートは、救急車サービス市場の全体分析、市場規模・予測、動向、成長促進要因、課題、約25のベンダーを網羅したベンダー分析などを掲載しています。
現在の市場シナリオ、最新動向と促進要因、市場環境全体に関する最新分析を提供しています。交通事故の増加、老人人口の増加、救急車サービスにおける有利な償還政策などが市場を牽引しています。
| 市場範囲 | |
|---|---|
| 基準年 | 2024 |
| 終了年 | 2028 |
| 予測期間 | 2024-2028 |
| 成長モメンタム | 加速 |
| 前年比2024年 | 5.91% |
| CAGR | 6.79% |
| 増分額 | 137億4,730万米ドル |
本調査では、新興諸国における航空救急車サービス人気の高まりが、今後数年間の救急車サービス市場成長を牽引する主要因の1つであるとしています。また、感染症の流行や高度な機内治療の採用が増加していることも、同市場の大きな需要につながっています。
目次
第1章 エグゼクティブサマリー
- 市場概要
第2章 市場情勢
- 市場エコシステム
- 市場の特徴
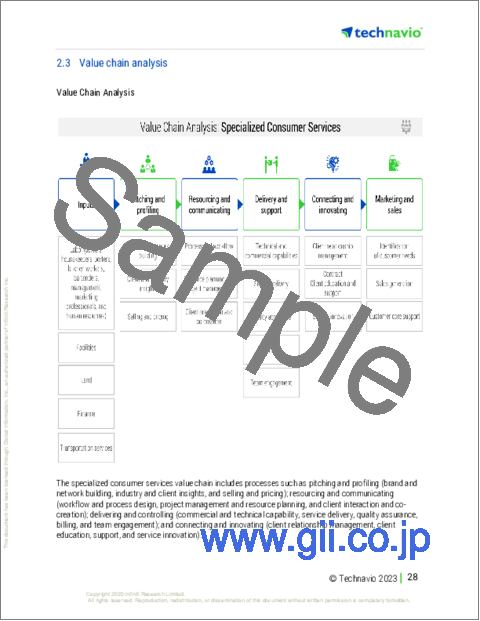
- バリューチェーン分析
第3章 市場規模の評価
- 市場の定義
- 市場セグメント分析
- 市場規模 2023
- 市場の見通し 2023-2028
第4章 市場規模実績
- 世界救急車サービス市場 2018-2022
- サービスタイプ別セグメント分析 2018-2022
- タイプ別セグメント分析 2018-2022
- 地域別セグメント分析 2018-2022
- 国別セグメント分析 2018-2022
第5章 ファイブフォース分析
- ファイブフォースの要約
- 買い手の交渉力
- 供給企業の交渉力
- 新規参入業者の脅威
- 代替品の脅威
- 競争の脅威
- 市況
第6章 市場セグメンテーション:サービスタイプ別
- 市場セグメンテーション
- 比較:サービスタイプ別
- 高度救命処置(ALS)救急車サービス:市場規模と予測 2023-2028
- 一次救命処置(BLS)救急車サービス:市場規模と予測 2023-2028
- 市場機会:サービスタイプ別
第7章 市場セグメンテーション:タイプ別
- 市場セグメンテーション
- 比較:タイプ別
- 緊急:市場規模と予測 2023-2028
- 非緊急:市場規模と予測 2023-2028
- 市場機会:タイプ別
第8章 顧客情勢
- 顧客情勢の概要
第9章 地域別情勢
- 地域別セグメンテーション
- 地域別比較
- 北米:市場規模と予測 2023-2028
- 欧州:市場規模と予測 2023-2028
- アジア太平洋:市場規模と予測 2023-2028
- 南米:市場規模と予測 2023-2028
- 中東・アフリカ:市場規模と予測 2023-2028
- 米国:市場規模と予測 2023-2028
- 中国:市場規模と予測 2023-2028
- ドイツ:市場規模と予測 2023-2028
- フランス:市場規模と予測 2023-2028
- 日本:市場規模と予測 2023-2028
- 市場機会:地域別
第10章 促進要因・課題・機会・抑制要因
- 市場促進要因
- 市場の課題
- 促進要因と課題の影響
- 市場の機会・抑制要因
第11章 競合情勢
- 概要
- 競合情勢
- 混乱の状況
- 業界のリスク
第12章 競合分析
- 企業プロファイル
- 企業の市場ポジショニング
- Acadian Ambulance Service Inc.
- Air Charter Service Group Ltd.
- Air Methods Corp.
- Air Rescuers World Wide Pvt Ltd.
- American Air Ambulance
- American Ambulance Service Inc.
- Babcock International Group Plc
- BVG India Ltd.
- Envision Healthcare
- Falck Danmark AS
- Harmonie Ambulance
- MEDIVIC PHARMACEUTICAL PVT. LTD.
- Netcare ltd.
- PHI Group Inc.
- Priority Ambulance
第13章 付録
Exhibits:
- Exhibits1: Executive Summary - Chart on Market Overview
- Exhibits2: Executive Summary - Data Table on Market Overview
- Exhibits3: Executive Summary - Chart on Global Market Characteristics
- Exhibits4: Executive Summary - Chart on Market by Geography
- Exhibits5: Executive Summary - Chart on Market Segmentation by Service Type
- Exhibits6: Executive Summary - Chart on Market Segmentation by Type
- Exhibits7: Executive Summary - Chart on Incremental Growth
- Exhibits8: Executive Summary - Data Table on Incremental Growth
- Exhibits9: Executive Summary - Chart on Company Market Positioning
- Exhibits10: Parent Market
- Exhibits11: Data Table on - Parent Market
- Exhibits12: Market characteristics analysis
- Exhibits13: Value Chain Analysis
- Exhibits14: Offerings of companies included in the market definition
- Exhibits15: Market segments
- Exhibits16: Chart on Global - Market size and forecast 2023-2028 ($ million)
- Exhibits17: Data Table on Global - Market size and forecast 2023-2028 ($ million)
- Exhibits18: Chart on Global Market: Year-over-year growth 2023-2028 (%)
- Exhibits19: Data Table on Global Market: Year-over-year growth 2023-2028 (%)
- Exhibits20: Historic Market Size - Data Table on Global Ambulance Services Market 2018 - 2022 ($ million)
- Exhibits21: Historic Market Size - Service Type Segment 2018 - 2022 ($ million)
- Exhibits22: Historic Market Size - Type Segment 2018 - 2022 ($ million)
- Exhibits23: Historic Market Size - Geography Segment 2018 - 2022 ($ million)
- Exhibits24: Historic Market Size - Country Segment 2018 - 2022 ($ million)
- Exhibits25: Five forces analysis - Comparison between 2023 and 2028
- Exhibits26: Bargaining power of buyers - Impact of key factors 2023 and 2028
- Exhibits27: Bargaining power of suppliers - Impact of key factors in 2023 and 2028
- Exhibits28: Threat of new entrants - Impact of key factors in 2023 and 2028
- Exhibits29: Threat of substitutes - Impact of key factors in 2023 and 2028
- Exhibits30: Threat of rivalry - Impact of key factors in 2023 and 2028
- Exhibits31: Chart on Market condition - Five forces 2023 and 2028
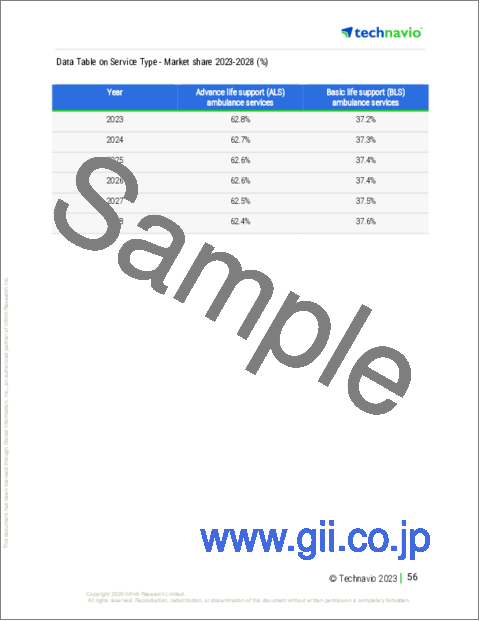
- Exhibits32: Chart on Service Type - Market share 2023-2028 (%)
- Exhibits33: Data Table on Service Type - Market share 2023-2028 (%)
- Exhibits34: Chart on Comparison by Service Type
- Exhibits35: Data Table on Comparison by Service Type
- Exhibits36: Chart on Advance life support (ALS) ambulance services - Market size and forecast 2023-2028 ($ million)
- Exhibits37: Data Table on Advance life support (ALS) ambulance services - Market size and forecast 2023-2028 ($ million)
- Exhibits38: Chart on Advance life support (ALS) ambulance services - Year-over-year growth 2023-2028 (%)
- Exhibits39: Data Table on Advance life support (ALS) ambulance services - Year-over-year growth 2023-2028 (%)
- Exhibits40: Chart on Basic life support (BLS) ambulance services - Market size and forecast 2023-2028 ($ million)
- Exhibits41: Data Table on Basic life support (BLS) ambulance services - Market size and forecast 2023-2028 ($ million)
- Exhibits42: Chart on Basic life support (BLS) ambulance services - Year-over-year growth 2023-2028 (%)
- Exhibits43: Data Table on Basic life support (BLS) ambulance services - Year-over-year growth 2023-2028 (%)
- Exhibits44: Market opportunity by Service Type ($ million)
- Exhibits45: Data Table on Market opportunity by Service Type ($ million)
- Exhibits46: Chart on Type - Market share 2023-2028 (%)
- Exhibits47: Data Table on Type - Market share 2023-2028 (%)
- Exhibits48: Chart on Comparison by Type
- Exhibits49: Data Table on Comparison by Type
- Exhibits50: Chart on Emergency - Market size and forecast 2023-2028 ($ million)
- Exhibits51: Data Table on Emergency - Market size and forecast 2023-2028 ($ million)
- Exhibits52: Chart on Emergency - Year-over-year growth 2023-2028 (%)
- Exhibits53: Data Table on Emergency - Year-over-year growth 2023-2028 (%)
- Exhibits54: Chart on Non-emergency - Market size and forecast 2023-2028 ($ million)
- Exhibits55: Data Table on Non-emergency - Market size and forecast 2023-2028 ($ million)
- Exhibits56: Chart on Non-emergency - Year-over-year growth 2023-2028 (%)
- Exhibits57: Data Table on Non-emergency - Year-over-year growth 2023-2028 (%)
- Exhibits58: Market opportunity by Type ($ million)
- Exhibits59: Data Table on Market opportunity by Type ($ million)
- Exhibits60: Analysis of price sensitivity, lifecycle, customer purchase basket, adoption rates, and purchase criteria
- Exhibits61: Chart on Market share By Geographical Landscape2023-2028 (%)
- Exhibits62: Data Table on Market share By Geographical Landscape2023-2028 (%)
- Exhibits63: Chart on Geographic comparison
- Exhibits64: Data Table on Geographic comparison
- Exhibits65: Chart on North America - Market size and forecast 2023-2028 ($ million)
- Exhibits66: Data Table on North America - Market size and forecast 2023-2028 ($ million)
- Exhibits67: Chart on North America - Year-over-year growth 2023-2028 (%)
- Exhibits68: Data Table on North America - Year-over-year growth 2023-2028 (%)
- Exhibits69: Chart on Europe - Market size and forecast 2023-2028 ($ million)
- Exhibits70: Data Table on Europe - Market size and forecast 2023-2028 ($ million)
- Exhibits71: Chart on Europe - Year-over-year growth 2023-2028 (%)
- Exhibits72: Data Table on Europe - Year-over-year growth 2023-2028 (%)
- Exhibits73: Chart on APAC - Market size and forecast 2023-2028 ($ million)
- Exhibits74: Data Table on APAC - Market size and forecast 2023-2028 ($ million)
- Exhibits75: Chart on APAC - Year-over-year growth 2023-2028 (%)
- Exhibits76: Data Table on APAC - Year-over-year growth 2023-2028 (%)
- Exhibits77: Chart on South America - Market size and forecast 2023-2028 ($ million)
- Exhibits78: Data Table on South America - Market size and forecast 2023-2028 ($ million)
- Exhibits79: Chart on South America - Year-over-year growth 2023-2028 (%)
- Exhibits80: Data Table on South America - Year-over-year growth 2023-2028 (%)
- Exhibits81: Chart on Middle East and Africa - Market size and forecast 2023-2028 ($ million)
- Exhibits82: Data Table on Middle East and Africa - Market size and forecast 2023-2028 ($ million)
- Exhibits83: Chart on Middle East and Africa - Year-over-year growth 2023-2028 (%)
- Exhibits84: Data Table on Middle East and Africa - Year-over-year growth 2023-2028 (%)
- Exhibits85: Chart on US - Market size and forecast 2023-2028 ($ million)
- Exhibits86: Data Table on US - Market size and forecast 2023-2028 ($ million)
- Exhibits87: Chart on US - Year-over-year growth 2023-2028 (%)
- Exhibits88: Data Table on US - Year-over-year growth 2023-2028 (%)
- Exhibits89: Chart on China - Market size and forecast 2023-2028 ($ million)
- Exhibits90: Data Table on China - Market size and forecast 2023-2028 ($ million)
- Exhibits91: Chart on China - Year-over-year growth 2023-2028 (%)
- Exhibits92: Data Table on China - Year-over-year growth 2023-2028 (%)
- Exhibits93: Chart on Germany - Market size and forecast 2023-2028 ($ million)
- Exhibits94: Data Table on Germany - Market size and forecast 2023-2028 ($ million)
- Exhibits95: Chart on Germany - Year-over-year growth 2023-2028 (%)
- Exhibits96: Data Table on Germany - Year-over-year growth 2023-2028 (%)
- Exhibits97: Chart on France - Market size and forecast 2023-2028 ($ million)
- Exhibits98: Data Table on France - Market size and forecast 2023-2028 ($ million)
- Exhibits99: Chart on France - Year-over-year growth 2023-2028 (%)
- Exhibits100: Data Table on France - Year-over-year growth 2023-2028 (%)
- Exhibits101: Chart on Japan - Market size and forecast 2023-2028 ($ million)
- Exhibits102: Data Table on Japan - Market size and forecast 2023-2028 ($ million)
- Exhibits103: Chart on Japan - Year-over-year growth 2023-2028 (%)
- Exhibits104: Data Table on Japan - Year-over-year growth 2023-2028 (%)
- Exhibits105: Market opportunity By Geographical Landscape($ million)
- Exhibits106: Data Tables on Market opportunity By Geographical Landscape($ million)
- Exhibits107: Impact of drivers and challenges in 2023 and 2028
- Exhibits108: Overview on criticality of inputs and factors of differentiation
- Exhibits109: Overview on factors of disruption
- Exhibits110: Impact of key risks on business
- Exhibits111: Companies covered
- Exhibits112: Matrix on companies position and classification
- Exhibits113: Acadian Ambulance Service Inc. - Overview
- Exhibits114: Acadian Ambulance Service Inc. - Product / Service
- Exhibits115: Acadian Ambulance Service Inc. - Key news
- Exhibits116: Acadian Ambulance Service Inc. - Key offerings
- Exhibits117: Air Charter Service Group Ltd. - Overview
- Exhibits118: Air Charter Service Group Ltd. - Business segments
- Exhibits119: Air Charter Service Group Ltd. - Key offerings
- Exhibits120: Air Charter Service Group Ltd. - Segment focus
- Exhibits121: Air Methods Corp. - Overview
- Exhibits122: Air Methods Corp. - Product / Service
- Exhibits123: Air Methods Corp. - Key offerings
- Exhibits124: Air Rescuers World Wide Pvt Ltd. - Overview
- Exhibits125: Air Rescuers World Wide Pvt Ltd. - Product / Service
- Exhibits126: Air Rescuers World Wide Pvt Ltd. - Key offerings
- Exhibits127: American Air Ambulance - Overview
- Exhibits128: American Air Ambulance - Product / Service
- Exhibits129: American Air Ambulance - Key offerings
- Exhibits130: American Ambulance Service Inc. - Overview
- Exhibits131: American Ambulance Service Inc. - Product / Service
- Exhibits132: American Ambulance Service Inc. - Key offerings
- Exhibits133: Babcock International Group Plc - Overview
- Exhibits134: Babcock International Group Plc - Business segments
- Exhibits135: Babcock International Group Plc - Key news
- Exhibits136: Babcock International Group Plc - Key offerings
- Exhibits137: Babcock International Group Plc - Segment focus
- Exhibits138: BVG India Ltd. - Overview
- Exhibits139: BVG India Ltd. - Product / Service
- Exhibits140: BVG India Ltd. - Key offerings
- Exhibits141: Envision Healthcare - Overview
- Exhibits142: Envision Healthcare - Product / Service
- Exhibits143: Envision Healthcare - Key news
- Exhibits144: Envision Healthcare - Key offerings
- Exhibits145: Falck Danmark AS - Overview
- Exhibits146: Falck Danmark AS - Business segments
- Exhibits147: Falck Danmark AS - Key news
- Exhibits148: Falck Danmark AS - Key offerings
- Exhibits149: Falck Danmark AS - Segment focus
- Exhibits150: Harmonie Ambulance - Overview
- Exhibits151: Harmonie Ambulance - Product / Service
- Exhibits152: Harmonie Ambulance - Key offerings
- Exhibits153: MEDIVIC PHARMACEUTICAL PVT. LTD. - Overview
- Exhibits154: MEDIVIC PHARMACEUTICAL PVT. LTD. - Product / Service
- Exhibits155: MEDIVIC PHARMACEUTICAL PVT. LTD. - Key offerings
- Exhibits156: Netcare ltd. - Overview
- Exhibits157: Netcare ltd. - Product / Service
- Exhibits158: Netcare ltd. - Key offerings
- Exhibits159: PHI Group Inc. - Overview
- Exhibits160: PHI Group Inc. - Business segments
- Exhibits161: PHI Group Inc. - Key offerings
- Exhibits162: PHI Group Inc. - Segment focus
- Exhibits163: Priority Ambulance - Overview
- Exhibits164: Priority Ambulance - Product / Service
- Exhibits165: Priority Ambulance - Key news
- Exhibits166: Priority Ambulance - Key offerings
- Exhibits167: Inclusions checklist
- Exhibits168: Exclusions checklist
- Exhibits169: Currency conversion rates for US$
- Exhibits170: Research methodology
- Exhibits171: Information sources
- Exhibits172: Data validation
- Exhibits173: Validation techniques employed for market sizing
- Exhibits174: Data synthesis
- Exhibits175: 360 degree market analysis
- Exhibits176: List of abbreviations
The ambulance services market is forecasted to grow by $ 13747.3 mn during 2023-2028, accelerating at a CAGR of 6.79% during the forecast period. The report on the ambulance services market provides a holistic analysis, market size and forecast, trends, growth drivers, and challenges, as well as vendor analysis covering around 25 vendors.
The report offers an up-to-date analysis regarding the current market scenario, the latest trends and drivers, and the overall market environment. The market is driven by increasing number of road accidents, growing geriatric population, and favorable reimbursement policies in ambulance services.
Technavio's ambulance services market is segmented as below:
| Market Scope | |
|---|---|
| Base Year | 2024 |
| End Year | 2028 |
| Series Year | 2024-2028 |
| Growth Momentum | Accelerate |
| YOY 2024 | 5.91% |
| CAGR | 6.79% |
| Incremental Value | $13747.3mn |
By Service Type
- Advance life support (ALS) ambulance services
- Basic life support (BLS) ambulance services
By Type
- Emergency
- Non-emergency
By Geography
- North America
- Europe
- APAC
- South America
- Middle East and Africa
This study identifies the rising popularity of air ambulance services in developing countries as one of the prime reasons driving the ambulance services market growth during the next few years. Also, increasing prevalence of infectious diseases and rising adoption of advanced onboard medical treatment will lead to sizable demand in the market.
The report on the ambulance services market covers the following areas:
- Ambulance services market sizing
- Ambulance services market forecast
- Ambulance services market industry analysis
The robust vendor analysis is designed to help clients improve their market position, and in line with this, this report provides a detailed analysis of several leading ambulance services market vendors that include Acadian Ambulance Service Inc., Air Charter Service Group Ltd., Air Methods Corp., Air Rescuers World Wide Pvt Ltd., American Air Ambulance, American Ambulance Service Inc., Babcock International Group Plc, Bristow Group Inc., BVG India Ltd., Envision Healthcare, Falck Danmark AS, Harmonie Ambulance, Luxembourg Air Rescue Asbl, Medical Air Service, MEDIVIC PHARMACEUTICAL PVT. LTD., Netcare ltd., PHI Group Inc., Priority Ambulance, REVA Inc., and Ziqitza Healthcare Ltd.. Also, the ambulance services market analysis report includes information on upcoming trends and challenges that will influence market growth. This is to help companies strategize and leverage all forthcoming growth opportunities.
The study was conducted using an objective combination of primary and secondary information including inputs from key participants in the industry. The report contains a comprehensive market and vendor landscape in addition to an analysis of the key vendors.
The publisher presents a detailed picture of the market by the way of study, synthesis, and summation of data from multiple sources by an analysis of key parameters such as profit, pricing, competition, and promotions. It presents various market facets by identifying the key industry influencers. The data presented is comprehensive, reliable, and a result of extensive research - both primary and secondary. The market research reports provide a complete competitive landscape and an in-depth vendor selection methodology and analysis using qualitative and quantitative research to forecast the accurate market growth.
Table of Contents
1 Executive Summary
- 1.1 Market overview
- Executive Summary - Chart on Market Overview
- Executive Summary - Data Table on Market Overview
- Executive Summary - Chart on Global Market Characteristics
- Executive Summary - Chart on Market by Geography
- Executive Summary - Chart on Market Segmentation by Service Type
- Executive Summary - Chart on Market Segmentation by Type
- Executive Summary - Chart on Incremental Growth
- Executive Summary - Data Table on Incremental Growth
- Executive Summary - Chart on Company Market Positioning
2 Market Landscape
- 2.1 Market ecosystem
- Parent Market
- Data Table on - Parent Market
- 2.2 Market characteristics
- Market characteristics analysis
- 2.3 Value chain analysis
- Value Chain Analysis
3 Market Sizing
- 3.1 Market definition
- Offerings of companies included in the market definition
- 3.2 Market segment analysis
- Market segments
- 3.3 Market size 2023
- 3.4 Market outlook: Forecast for 2023-2028
- Chart on Global - Market size and forecast 2023-2028 ($ million)
- Data Table on Global - Market size and forecast 2023-2028 ($ million)
- Chart on Global Market: Year-over-year growth 2023-2028 (%)
- Data Table on Global Market: Year-over-year growth 2023-2028 (%)
4 Historic Market Size
- 4.1 Global Ambulance Services Market 2018 - 2022
- Historic Market Size - Data Table on Global Ambulance Services Market 2018 - 2022 ($ million)
- 4.2 Service Type segment analysis 2018 - 2022
- Historic Market Size - Service Type Segment 2018 - 2022 ($ million)
- 4.3 Type segment analysis 2018 - 2022
- Historic Market Size - Type Segment 2018 - 2022 ($ million)
- 4.4 Geography segment analysis 2018 - 2022
- Historic Market Size - Geography Segment 2018 - 2022 ($ million)
- 4.5 Country segment analysis 2018 - 2022
- Historic Market Size - Country Segment 2018 - 2022 ($ million)
5 Five Forces Analysis
- 5.1 Five forces summary
- Five forces analysis - Comparison between 2023 and 2028
- 5.2 Bargaining power of buyers
- Bargaining power of buyers - Impact of key factors 2023 and 2028
- 5.3 Bargaining power of suppliers
- Bargaining power of suppliers - Impact of key factors in 2023 and 2028
- 5.4 Threat of new entrants
- Threat of new entrants - Impact of key factors in 2023 and 2028
- 5.5 Threat of substitutes
- Threat of substitutes - Impact of key factors in 2023 and 2028
- 5.6 Threat of rivalry
- Threat of rivalry - Impact of key factors in 2023 and 2028
- 5.7 Market condition
- Chart on Market condition - Five forces 2023 and 2028
6 Market Segmentation by Service Type
- 6.1 Market segments
- Chart on Service Type - Market share 2023-2028 (%)
- Data Table on Service Type - Market share 2023-2028 (%)
- 6.2 Comparison by Service Type
- Chart on Comparison by Service Type
- Data Table on Comparison by Service Type
- 6.3 Advance life support (ALS) ambulance services - Market size and forecast 2023-2028
- Chart on Advance life support (ALS) ambulance services - Market size and forecast 2023-2028 ($ million)
- Data Table on Advance life support (ALS) ambulance services - Market size and forecast 2023-2028 ($ million)
- Chart on Advance life support (ALS) ambulance services - Year-over-year growth 2023-2028 (%)
- Data Table on Advance life support (ALS) ambulance services - Year-over-year growth 2023-2028 (%)
- 6.4 Basic life support (BLS) ambulance services - Market size and forecast 2023-2028
- Chart on Basic life support (BLS) ambulance services - Market size and forecast 2023-2028 ($ million)
- Data Table on Basic life support (BLS) ambulance services - Market size and forecast 2023-2028 ($ million)
- Chart on Basic life support (BLS) ambulance services - Year-over-year growth 2023-2028 (%)
- Data Table on Basic life support (BLS) ambulance services - Year-over-year growth 2023-2028 (%)
- 6.5 Market opportunity by Service Type
- Market opportunity by Service Type ($ million)
- Data Table on Market opportunity by Service Type ($ million)
7 Market Segmentation by Type
- 7.1 Market segments
- Chart on Type - Market share 2023-2028 (%)
- Data Table on Type - Market share 2023-2028 (%)
- 7.2 Comparison by Type
- Chart on Comparison by Type
- Data Table on Comparison by Type
- 7.3 Emergency - Market size and forecast 2023-2028
- Chart on Emergency - Market size and forecast 2023-2028 ($ million)
- Data Table on Emergency - Market size and forecast 2023-2028 ($ million)
- Chart on Emergency - Year-over-year growth 2023-2028 (%)
- Data Table on Emergency - Year-over-year growth 2023-2028 (%)
- 7.4 Non-emergency - Market size and forecast 2023-2028
- Chart on Non-emergency - Market size and forecast 2023-2028 ($ million)
- Data Table on Non-emergency - Market size and forecast 2023-2028 ($ million)
- Chart on Non-emergency - Year-over-year growth 2023-2028 (%)
- Data Table on Non-emergency - Year-over-year growth 2023-2028 (%)
- 7.5 Market opportunity by Type
- Market opportunity by Type ($ million)
- Data Table on Market opportunity by Type ($ million)
8 Customer Landscape
- 8.1 Customer landscape overview
- Analysis of price sensitivity, lifecycle, customer purchase basket, adoption rates, and purchase criteria
9 Geographic Landscape
- 9.1 Geographic segmentation
- Chart on Market share By Geographical Landscape2023-2028 (%)
- Data Table on Market share By Geographical Landscape2023-2028 (%)
- 9.2 Geographic comparison
- Chart on Geographic comparison
- Data Table on Geographic comparison
- 9.3 North America - Market size and forecast 2023-2028
- Chart on North America - Market size and forecast 2023-2028 ($ million)
- Data Table on North America - Market size and forecast 2023-2028 ($ million)
- Chart on North America - Year-over-year growth 2023-2028 (%)
- Data Table on North America - Year-over-year growth 2023-2028 (%)
- 9.4 Europe - Market size and forecast 2023-2028
- Chart on Europe - Market size and forecast 2023-2028 ($ million)
- Data Table on Europe - Market size and forecast 2023-2028 ($ million)
- Chart on Europe - Year-over-year growth 2023-2028 (%)
- Data Table on Europe - Year-over-year growth 2023-2028 (%)
- 9.5 APAC - Market size and forecast 2023-2028
- Chart on APAC - Market size and forecast 2023-2028 ($ million)
- Data Table on APAC - Market size and forecast 2023-2028 ($ million)
- Chart on APAC - Year-over-year growth 2023-2028 (%)
- Data Table on APAC - Year-over-year growth 2023-2028 (%)
- 9.6 South America - Market size and forecast 2023-2028
- Chart on South America - Market size and forecast 2023-2028 ($ million)
- Data Table on South America - Market size and forecast 2023-2028 ($ million)
- Chart on South America - Year-over-year growth 2023-2028 (%)
- Data Table on South America - Year-over-year growth 2023-2028 (%)
- 9.7 Middle East and Africa - Market size and forecast 2023-2028
- Chart on Middle East and Africa - Market size and forecast 2023-2028 ($ million)
- Data Table on Middle East and Africa - Market size and forecast 2023-2028 ($ million)
- Chart on Middle East and Africa - Year-over-year growth 2023-2028 (%)
- Data Table on Middle East and Africa - Year-over-year growth 2023-2028 (%)
- 9.8 US - Market size and forecast 2023-2028
- Chart on US - Market size and forecast 2023-2028 ($ million)
- Data Table on US - Market size and forecast 2023-2028 ($ million)
- Chart on US - Year-over-year growth 2023-2028 (%)
- Data Table on US - Year-over-year growth 2023-2028 (%)
- 9.9 China - Market size and forecast 2023-2028
- Chart on China - Market size and forecast 2023-2028 ($ million)
- Data Table on China - Market size and forecast 2023-2028 ($ million)
- Chart on China - Year-over-year growth 2023-2028 (%)
- Data Table on China - Year-over-year growth 2023-2028 (%)
- 9.10 Germany - Market size and forecast 2023-2028
- Chart on Germany - Market size and forecast 2023-2028 ($ million)
- Data Table on Germany - Market size and forecast 2023-2028 ($ million)
- Chart on Germany - Year-over-year growth 2023-2028 (%)
- Data Table on Germany - Year-over-year growth 2023-2028 (%)
- 9.11 France - Market size and forecast 2023-2028
- Chart on France - Market size and forecast 2023-2028 ($ million)
- Data Table on France - Market size and forecast 2023-2028 ($ million)
- Chart on France - Year-over-year growth 2023-2028 (%)
- Data Table on France - Year-over-year growth 2023-2028 (%)
- 9.12 Japan - Market size and forecast 2023-2028
- Chart on Japan - Market size and forecast 2023-2028 ($ million)
- Data Table on Japan - Market size and forecast 2023-2028 ($ million)
- Chart on Japan - Year-over-year growth 2023-2028 (%)
- Data Table on Japan - Year-over-year growth 2023-2028 (%)
- 9.13 Market opportunity by geography
- Market opportunity By Geographical Landscape($ million)
- Data Tables on Market opportunity By Geographical Landscape($ million)
10 Drivers, Challenges, and Opportunity/Restraints
- 10.1 Market drivers
- 10.2 Market challenges
- 10.3 Impact of drivers and challenges
- Impact of drivers and challenges in 2023 and 2028
- 10.4 Market opportunities/restraints
11 Competitive Landscape
- 11.1 Overview
- 11.2 Competitive Landscape
- Overview on criticality of inputs and factors of differentiation
- 11.3 Landscape disruption
- Overview on factors of disruption
- 11.4 Industry risks
- Impact of key risks on business
12 Competitive Analysis
- 12.1 Companies profiled
- Companies covered
- 12.2 Market positioning of companies
- Matrix on companies position and classification
- 12.3 Acadian Ambulance Service Inc.
- Acadian Ambulance Service Inc. - Overview
- Acadian Ambulance Service Inc. - Product / Service
- Acadian Ambulance Service Inc. - Key news
- Acadian Ambulance Service Inc. - Key offerings
- 12.4 Air Charter Service Group Ltd.
- Air Charter Service Group Ltd. - Overview
- Air Charter Service Group Ltd. - Business segments
- Air Charter Service Group Ltd. - Key offerings
- Air Charter Service Group Ltd. - Segment focus
- 12.5 Air Methods Corp.
- Air Methods Corp. - Overview
- Air Methods Corp. - Product / Service
- Air Methods Corp. - Key offerings
- 12.6 Air Rescuers World Wide Pvt Ltd.
- Air Rescuers World Wide Pvt Ltd. - Overview
- Air Rescuers World Wide Pvt Ltd. - Product / Service
- Air Rescuers World Wide Pvt Ltd. - Key offerings
- 12.7 American Air Ambulance
- American Air Ambulance - Overview
- American Air Ambulance - Product / Service
- American Air Ambulance - Key offerings
- 12.8 American Ambulance Service Inc.
- American Ambulance Service Inc. - Overview
- American Ambulance Service Inc. - Product / Service
- American Ambulance Service Inc. - Key offerings
- 12.9 Babcock International Group Plc
- Babcock International Group Plc - Overview
- Babcock International Group Plc - Business segments
- Babcock International Group Plc - Key news
- Babcock International Group Plc - Key offerings
- Babcock International Group Plc - Segment focus
- 12.10 BVG India Ltd.
- BVG India Ltd. - Overview
- BVG India Ltd. - Product / Service
- BVG India Ltd. - Key offerings
- 12.11 Envision Healthcare
- Envision Healthcare - Overview
- Envision Healthcare - Product / Service
- Envision Healthcare - Key news
- Envision Healthcare - Key offerings
- 12.12 Falck Danmark AS
- Falck Danmark AS - Overview
- Falck Danmark AS - Business segments
- Falck Danmark AS - Key news
- Falck Danmark AS - Key offerings
- Falck Danmark AS - Segment focus
- 12.13 Harmonie Ambulance
- Harmonie Ambulance - Overview
- Harmonie Ambulance - Product / Service
- Harmonie Ambulance - Key offerings
- 12.14 MEDIVIC PHARMACEUTICAL PVT. LTD.
- MEDIVIC PHARMACEUTICAL PVT. LTD. - Overview
- MEDIVIC PHARMACEUTICAL PVT. LTD. - Product / Service
- MEDIVIC PHARMACEUTICAL PVT. LTD. - Key offerings
- 12.15 Netcare ltd.
- Netcare ltd. - Overview
- Netcare ltd. - Product / Service
- Netcare ltd. - Key offerings
- 12.16 PHI Group Inc.
- PHI Group Inc. - Overview
- PHI Group Inc. - Business segments
- PHI Group Inc. - Key offerings
- PHI Group Inc. - Segment focus
- 12.17 Priority Ambulance
- Priority Ambulance - Overview
- Priority Ambulance - Product / Service
- Priority Ambulance - Key news
- Priority Ambulance - Key offerings
13 Appendix
- 13.1 Scope of the report
- 13.2 Inclusions and exclusions checklist
- Inclusions checklist
- Exclusions checklist
- 13.3 Currency conversion rates for US$
- Currency conversion rates for US$
- 13.4 Research methodology
- Research methodology
- 13.5 Data procurement
- Information sources
- 13.6 Data validation
- Data validation
- 13.7 Validation techniques employed for market sizing
- Validation techniques employed for market sizing
- 13.8 Data synthesis
- Data synthesis
- 13.9 market analysis
- market analysis
- 13.10 List of abbreviations
- List of abbreviations

