|
|
市場調査レポート
商品コード
1502584
VII・流動点降下剤(PPD)のポリメタクリレートの世界市場:2024~2028年Global polymethacrylate in VII and pour point depressant (PPD) market 2024-2028 |
||||||

|
|||||||
カスタマイズ可能
|
|||||||

| VII・流動点降下剤(PPD)のポリメタクリレートの世界市場:2024~2028年 |
|
出版日: 2024年05月20日
発行: TechNavio
ページ情報: 英文 171 Pages
納期: 即納可能
|

全表示
- 概要
- 図表
- 目次
世界のVII・流動点降下剤(PPD)のポリメタクリレートの市場規模は、予測期間中にCAGR 3.2%で成長し、2023~2028年にかけて3億7,850万米ドルに達すると予測されています。
当レポートでは、VII・流動点降下剤(PPD)のポリメタクリレート市場の全体的な分析、市場規模・予測、動向、成長促進要因、課題、約25のベンダーを網羅したベンダー分析などを掲載しています。
現在の市場シナリオ、最新動向と促進要因、市場環境全体に関する最新分析を提供しています。高性能潤滑油の需要増加、自動車産業の成長、産業化と都市化の進展が市場を牽引しています。
| 市場範囲 | |
|---|---|
| 基準年 | 2024年 |
| 終了年 | 2028年 |
| 予測期間 | 2024~2028年 |
| 成長モメンタム | 加速 |
| 前年比2024年 | 3.06% |
| CAGR | 3.2% |
| 増分額 | 3億7,850万米ドル |
本調査では、今後数年間のVII・流動点降下剤(PPD)のポリメタクリレート市場成長を牽引する主な要因の1つとして、低燃費車に対する需要の増加を挙げています。また、産業用途での使用の増加や持続可能性への関心の高まりも、市場の大きな需要につながります。
目次
第1章 エグゼクティブサマリー
- 市場概要
第2章 市場情勢
- 市場エコシステム
- 市場の特徴
- バリューチェーン分析
第3章 市場規模の評価
- 市場の定義
- 市場セグメント分析
- 市場規模、2023年
- 市場の見通し:予測(2023~2028年)
第4章 市場規模実績
- 世界のVII・流動点降下剤(PPD)のポリメタクリレート市場、2018~2022年
- グレードタイプ別セグメント分析、2018~2022年
- エンドユーザー別セグメント分析、2018~2022年
- 地域別セグメント分析、2018~2022年
- 国別セグメント分析、2018~2022年
第5章 ファイブフォース分析
- ファイブフォースの要約
- 買い手の交渉力
- 供給企業の交渉力
- 新規参入業者の脅威
- 代替品の脅威
- 競争の脅威
- 市況
第6章 市場セグメンテーション:グレードタイプ別
- 市場セグメンテーション
- 比較:グレードタイプ別
- マルチグレード:市場規模・予測、2023~2028年
- モノグレード:市場規模・予測、2023~2028年
- 市場機会:グレードタイプ別
第7章 市場セグメンテーション:エンドユーザー別
- 市場セグメンテーション
- 比較:エンドユーザー別
- PCMO:市場規模・予測、2023~2028年
- HDMO:市場規模・予測、2023~2028年
- 産業用油圧オイル:市場規模・予測、2023~2028年
- 自動車用ギアオイル:市場規模・予測、2023~2028年
- 市場機会:エンドユーザー別
第8章 顧客情勢
- 顧客情勢の概要
第9章 地域別情勢
- 地域別セグメンテーション
- 地域別比較
- アジア太平洋:市場規模・予測、2023~2028年
- 欧州:市場規模・予測、2023~2028年
- 北米:市場規模・予測、2023~2028年
- 南米:市場規模・予測、2023~2028年
- 中東・アフリカ:市場規模・予測、2023~2028年
- 中国:市場規模・予測、2023~2028年
- 米国:市場規模・予測、2023~2028年
- 日本:市場規模・予測、2023~2028年
- ドイツ:市場規模・予測、2023~2028年
- フランス:市場規模・予測、2023~2028年
- 市場機会:地域情勢別
第10章 促進要因・課題・機会・抑制要因
- 市場促進要因
- 市場の課題
- 促進要因と課題の影響
- 市場機会・抑制要因
第11章 競合情勢
- 概要
- 競合情勢
- 混乱の状況
- 産業リスク
第12章 競合分析
- 企業プロファイル
- 企業の市場ポジショニング
- Additive-Chemie Luers GmbH and Co. KG
- American Hitech Petroleum and Chemicals Inc.
- DANA Lubricants Factory LLC
- Evonik Industries AG
- Functional Products Inc.
- Infineum International Ltd.
- Jinzhou Kangtai Lubricant Additives Co. Ltd.
- Jinzhou Runda Chemical Co. Ltd.
- Kusa Chemicals Pvt Ltd.
- Mitsubishi Chemical Group Corp.
- NewMarket Corp.
- Nouryon Chemicals Holding BV
- Ter Group
- The Lubrizol Corp.
- Zhengzhou Chorus Lubricant Additive Co. Ltd.
第13章 付録
Exhibits:
- Exhibits1: Executive Summary - Chart on Market Overview
- Exhibits2: Executive Summary - Data Table on Market Overview
- Exhibits3: Executive Summary - Chart on Global Market Characteristics
- Exhibits4: Executive Summary - Chart on Market By Geographical Landscape
- Exhibits5: Executive Summary - Chart on Market Segmentation by Grade Type
- Exhibits6: Executive Summary - Chart on Market Segmentation by End-user
- Exhibits7: Executive Summary - Chart on Incremental Growth
- Exhibits8: Executive Summary - Data Table on Incremental Growth
- Exhibits9: Executive Summary - Chart on Company Market Positioning
- Exhibits10: Parent Market
- Exhibits11: Data Table on - Parent Market
- Exhibits12: Market characteristics analysis
- Exhibits13: Value Chain Analysis
- Exhibits14: Offerings of companies included in the market definition
- Exhibits15: Market segments
- Exhibits16: Chart on Global - Market size and forecast 2023-2028 ($ million)
- Exhibits17: Data Table on Global - Market size and forecast 2023-2028 ($ million)
- Exhibits18: Chart on Global Market: Year-over-year growth 2023-2028 (%)
- Exhibits19: Data Table on Global Market: Year-over-year growth 2023-2028 (%)
- Exhibits20: Historic Market Size - Data Table on Global Polymethacrylate In VII And Pour Point Depressant (PPD) Market 2018 - 2022 ($ million)
- Exhibits21: Historic Market Size - Grade Type Segment 2018 - 2022 ($ million)
- Exhibits22: Historic Market Size - End-user Segment 2018 - 2022 ($ million)
- Exhibits23: Historic Market Size - Geography Segment 2018 - 2022 ($ million)
- Exhibits24: Historic Market Size - Country Segment 2018 - 2022 ($ million)
- Exhibits25: Five forces analysis - Comparison between 2023 and 2028
- Exhibits26: Bargaining power of buyers - Impact of key factors 2023 and 2028
- Exhibits27: Bargaining power of suppliers - Impact of key factors in 2023 and 2028
- Exhibits28: Threat of new entrants - Impact of key factors in 2023 and 2028
- Exhibits29: Threat of substitutes - Impact of key factors in 2023 and 2028
- Exhibits30: Threat of rivalry - Impact of key factors in 2023 and 2028
- Exhibits31: Chart on Market condition - Five forces 2023 and 2028
- Exhibits32: Chart on Grade Type - Market share 2023-2028 (%)
- Exhibits33: Data Table on Grade Type - Market share 2023-2028 (%)
- Exhibits34: Chart on Comparison by Grade Type
- Exhibits35: Data Table on Comparison by Grade Type
- Exhibits36: Chart on Multi-grade - Market size and forecast 2023-2028 ($ million)
- Exhibits37: Data Table on Multi-grade - Market size and forecast 2023-2028 ($ million)
- Exhibits38: Chart on Multi-grade - Year-over-year growth 2023-2028 (%)
- Exhibits39: Data Table on Multi-grade - Year-over-year growth 2023-2028 (%)
- Exhibits40: Chart on Mono-grade - Market size and forecast 2023-2028 ($ million)
- Exhibits41: Data Table on Mono-grade - Market size and forecast 2023-2028 ($ million)
- Exhibits42: Chart on Mono-grade - Year-over-year growth 2023-2028 (%)
- Exhibits43: Data Table on Mono-grade - Year-over-year growth 2023-2028 (%)
- Exhibits44: Market opportunity by Grade Type ($ million)
- Exhibits45: Data Table on Market opportunity by Grade Type ($ million)
- Exhibits46: Chart on End-user - Market share 2023-2028 (%)
- Exhibits47: Data Table on End-user - Market share 2023-2028 (%)
- Exhibits48: Chart on Comparison by End-user
- Exhibits49: Data Table on Comparison by End-user
- Exhibits50: Chart on PCMO - Market size and forecast 2023-2028 ($ million)
- Exhibits51: Data Table on PCMO - Market size and forecast 2023-2028 ($ million)
- Exhibits52: Chart on PCMO - Year-over-year growth 2023-2028 (%)
- Exhibits53: Data Table on PCMO - Year-over-year growth 2023-2028 (%)
- Exhibits54: Chart on HDMO - Market size and forecast 2023-2028 ($ million)
- Exhibits55: Data Table on HDMO - Market size and forecast 2023-2028 ($ million)
- Exhibits56: Chart on HDMO - Year-over-year growth 2023-2028 (%)
- Exhibits57: Data Table on HDMO - Year-over-year growth 2023-2028 (%)
- Exhibits58: Chart on Industrial hydraulic oils - Market size and forecast 2023-2028 ($ million)
- Exhibits59: Data Table on Industrial hydraulic oils - Market size and forecast 2023-2028 ($ million)
- Exhibits60: Chart on Industrial hydraulic oils - Year-over-year growth 2023-2028 (%)
- Exhibits61: Data Table on Industrial hydraulic oils - Year-over-year growth 2023-2028 (%)
- Exhibits62: Chart on Automotive gear oils - Market size and forecast 2023-2028 ($ million)
- Exhibits63: Data Table on Automotive gear oils - Market size and forecast 2023-2028 ($ million)
- Exhibits64: Chart on Automotive gear oils - Year-over-year growth 2023-2028 (%)
- Exhibits65: Data Table on Automotive gear oils - Year-over-year growth 2023-2028 (%)
- Exhibits66: Market opportunity by End-user ($ million)
- Exhibits67: Data Table on Market opportunity by End-user ($ million)
- Exhibits68: Analysis of price sensitivity, lifecycle, customer purchase basket, adoption rates, and purchase criteria
- Exhibits69: Chart on Market share By Geographical Landscape 2023-2028 (%)
- Exhibits70: Data Table on Market share By Geographical Landscape 2023-2028 (%)
- Exhibits71: Chart on Geographic comparison
- Exhibits72: Data Table on Geographic comparison
- Exhibits73: Chart on APAC - Market size and forecast 2023-2028 ($ million)
- Exhibits74: Data Table on APAC - Market size and forecast 2023-2028 ($ million)
- Exhibits75: Chart on APAC - Year-over-year growth 2023-2028 (%)
- Exhibits76: Data Table on APAC - Year-over-year growth 2023-2028 (%)
- Exhibits77: Chart on Europe - Market size and forecast 2023-2028 ($ million)
- Exhibits78: Data Table on Europe - Market size and forecast 2023-2028 ($ million)
- Exhibits79: Chart on Europe - Year-over-year growth 2023-2028 (%)
- Exhibits80: Data Table on Europe - Year-over-year growth 2023-2028 (%)
- Exhibits81: Chart on North America - Market size and forecast 2023-2028 ($ million)
- Exhibits82: Data Table on North America - Market size and forecast 2023-2028 ($ million)
- Exhibits83: Chart on North America - Year-over-year growth 2023-2028 (%)
- Exhibits84: Data Table on North America - Year-over-year growth 2023-2028 (%)
- Exhibits85: Chart on South America - Market size and forecast 2023-2028 ($ million)
- Exhibits86: Data Table on South America - Market size and forecast 2023-2028 ($ million)
- Exhibits87: Chart on South America - Year-over-year growth 2023-2028 (%)
- Exhibits88: Data Table on South America - Year-over-year growth 2023-2028 (%)
- Exhibits89: Chart on Middle East and Africa - Market size and forecast 2023-2028 ($ million)
- Exhibits90: Data Table on Middle East and Africa - Market size and forecast 2023-2028 ($ million)
- Exhibits91: Chart on Middle East and Africa - Year-over-year growth 2023-2028 (%)
- Exhibits92: Data Table on Middle East and Africa - Year-over-year growth 2023-2028 (%)
- Exhibits93: Chart on China - Market size and forecast 2023-2028 ($ million)
- Exhibits94: Data Table on China - Market size and forecast 2023-2028 ($ million)
- Exhibits95: Chart on China - Year-over-year growth 2023-2028 (%)
- Exhibits96: Data Table on China - Year-over-year growth 2023-2028 (%)
- Exhibits97: Chart on US - Market size and forecast 2023-2028 ($ million)
- Exhibits98: Data Table on US - Market size and forecast 2023-2028 ($ million)
- Exhibits99: Chart on US - Year-over-year growth 2023-2028 (%)
- Exhibits100: Data Table on US - Year-over-year growth 2023-2028 (%)
- Exhibits101: Chart on Japan - Market size and forecast 2023-2028 ($ million)
- Exhibits102: Data Table on Japan - Market size and forecast 2023-2028 ($ million)
- Exhibits103: Chart on Japan - Year-over-year growth 2023-2028 (%)
- Exhibits104: Data Table on Japan - Year-over-year growth 2023-2028 (%)
- Exhibits105: Chart on Germany - Market size and forecast 2023-2028 ($ million)
- Exhibits106: Data Table on Germany - Market size and forecast 2023-2028 ($ million)
- Exhibits107: Chart on Germany - Year-over-year growth 2023-2028 (%)
- Exhibits108: Data Table on Germany - Year-over-year growth 2023-2028 (%)
- Exhibits109: Chart on France - Market size and forecast 2023-2028 ($ million)
- Exhibits110: Data Table on France - Market size and forecast 2023-2028 ($ million)
- Exhibits111: Chart on France - Year-over-year growth 2023-2028 (%)
- Exhibits112: Data Table on France - Year-over-year growth 2023-2028 (%)
- Exhibits113: Market opportunity By Geographical Landscape ($ million)
- Exhibits114: Data Tables on Market opportunity By Geographical Landscape ($ million)
- Exhibits115: Impact of drivers and challenges in 2023 and 2028
- Exhibits116: Overview on criticality of inputs and factors of differentiation
- Exhibits117: Overview on factors of disruption
- Exhibits118: Impact of key risks on business
- Exhibits119: Companies covered
- Exhibits120: Matrix on companies position and classification
- Exhibits121: Additive-Chemie Luers GmbH and Co. KG - Overview
- Exhibits122: Additive-Chemie Luers GmbH and Co. KG - Product / Service
- Exhibits123: Additive-Chemie Luers GmbH and Co. KG - Key offerings
- Exhibits124: American Hitech Petroleum and Chemicals Inc. - Overview
- Exhibits125: American Hitech Petroleum and Chemicals Inc. - Product / Service
- Exhibits126: American Hitech Petroleum and Chemicals Inc. - Key offerings
- Exhibits127: DANA Lubricants Factory LLC - Overview
- Exhibits128: DANA Lubricants Factory LLC - Product / Service
- Exhibits129: DANA Lubricants Factory LLC - Key offerings
- Exhibits130: Evonik Industries AG - Overview
- Exhibits131: Evonik Industries AG - Business segments
- Exhibits132: Evonik Industries AG - Key news
- Exhibits133: Evonik Industries AG - Key offerings
- Exhibits134: Evonik Industries AG - Segment focus
- Exhibits135: Functional Products Inc. - Overview
- Exhibits136: Functional Products Inc. - Product / Service
- Exhibits137: Functional Products Inc. - Key offerings
- Exhibits138: Infineum International Ltd. - Overview
- Exhibits139: Infineum International Ltd. - Product / Service
- Exhibits140: Infineum International Ltd. - Key offerings
- Exhibits141: Jinzhou Kangtai Lubricant Additives Co. Ltd. - Overview
- Exhibits142: Jinzhou Kangtai Lubricant Additives Co. Ltd. - Product / Service
- Exhibits143: Jinzhou Kangtai Lubricant Additives Co. Ltd. - Key offerings
- Exhibits144: Jinzhou Runda Chemical Co. Ltd. - Overview
- Exhibits145: Jinzhou Runda Chemical Co. Ltd. - Product / Service
- Exhibits146: Jinzhou Runda Chemical Co. Ltd. - Key offerings
- Exhibits147: Kusa Chemicals Pvt Ltd. - Overview
- Exhibits148: Kusa Chemicals Pvt Ltd. - Product / Service
- Exhibits149: Kusa Chemicals Pvt Ltd. - Key offerings
- Exhibits150: Mitsubishi Chemical Group Corp. - Overview
- Exhibits151: Mitsubishi Chemical Group Corp. - Business segments
- Exhibits152: Mitsubishi Chemical Group Corp. - Key news
- Exhibits153: Mitsubishi Chemical Group Corp. - Key offerings
- Exhibits154: Mitsubishi Chemical Group Corp. - Segment focus
- Exhibits155: NewMarket Corp. - Overview
- Exhibits156: NewMarket Corp. - Business segments
- Exhibits157: NewMarket Corp. - Key offerings
- Exhibits158: NewMarket Corp. - Segment focus
- Exhibits159: Nouryon Chemicals Holding BV - Overview
- Exhibits160: Nouryon Chemicals Holding BV - Business segments
- Exhibits161: Nouryon Chemicals Holding BV - Key offerings
- Exhibits162: Nouryon Chemicals Holding BV - Segment focus
- Exhibits163: Ter Group - Overview
- Exhibits164: Ter Group - Product / Service
- Exhibits165: Ter Group - Key offerings
- Exhibits166: The Lubrizol Corp. - Overview
- Exhibits167: The Lubrizol Corp. - Product / Service
- Exhibits168: The Lubrizol Corp. - Key offerings
- Exhibits169: Zhengzhou Chorus Lubricant Additive Co. Ltd. - Overview
- Exhibits170: Zhengzhou Chorus Lubricant Additive Co. Ltd. - Product / Service
- Exhibits171: Zhengzhou Chorus Lubricant Additive Co. Ltd. - Key offerings
- Exhibits172: Inclusions checklist
- Exhibits173: Exclusions checklist
- Exhibits174: Currency conversion rates for US$
- Exhibits175: Research methodology
- Exhibits176: Information sources
- Exhibits177: Data validation
- Exhibits178: Validation techniques employed for market sizing
- Exhibits179: Data synthesis
- Exhibits180: 360 degree market analysis
- Exhibits181: List of abbreviations
Technavio has been monitoring the polymethacrylate in vii and pour point depressant (PPD) market and is forecast to grow by USD 378.5 mn during 2023-2028, accelerating at a CAGR of 3.2% during the forecast period. Our report on the polymethacrylate in vii and pour point depressant (PPD) market provides a holistic analysis, market size and forecast, trends, growth drivers, and challenges, as well as vendor analysis covering around 25 vendors.
The report offers an up-to-date analysis regarding the current market scenario, the latest trends and drivers, and the overall market environment. The market is driven by increasing demand for high-performance lubricants, growing automotive industry, and growing industrialization and urbanization.
Technavio's polymethacrylate in vii and pour point depressant (PPD) market is segmented as below:
| Market Scope | |
|---|---|
| Base Year | 2024 |
| End Year | 2028 |
| Series Year | 2024-2028 |
| Growth Momentum | Accelerate |
| YOY 2024 | 3.06% |
| CAGR | 3.2% |
| Incremental Value | $378.5mn |
By Grade Type
- Multi-grade
- Mono-grade
By End-user
- PCMO
- HDMO
- Industrial hydraulic oils
- Automotive gear oils
By Geographical Landscape
- APAC
- Europe
- North America
- South America
- Middle East and Africa
This study identifies the increasing demand for fuel-efficient vehicles as one of the prime reasons driving the polymethacrylate in vii and pour point depressant (PPD) market growth during the next few years. Also, increasing use in industrial applications and growing focus on sustainability will lead to sizable demand in the market.
Technavio presents a detailed picture of the market by the way of study, synthesis, and summation of data from multiple sources by an analysis of key parameters. Our report on the polymethacrylate in vii and pour point depressant (PPD) market covers the following areas:
- Polymethacrylate in vii and pour point depressant (PPD) market sizing
- Polymethacrylate in vii and pour point depressant (PPD) market forecast
- Polymethacrylate in vii and pour point depressant (PPD) market industry analysis
Technavio's robust vendor analysis is designed to help clients improve their market position, and in line with this, this report provides a detailed analysis of several leading polymethacrylate in vii and pour point depressant (PPD) market vendors that include Additive-Chemie Luers GmbH and Co. KG, American Hitech Petroleum and Chemicals Inc., DANA Lubricants Factory LLC, Evonik Industries AG, Functional Products Inc., Infineum International Ltd., Jinzhou Kangtai Lubricant Additives Co. Ltd., Jinzhou Runda Chemical Co. Ltd., Kusa Chemicals Pvt Ltd., Mitsubishi Chemical Group Corp., NewMarket Corp., Nouryon Chemicals Holding BV, RX Marine International, Ter Group, The Lubrizol Corp., and Zhengzhou Chorus Lubricant Additive Co. Ltd. . Also, the polymethacrylate in vii and pour point depressant (PPD) market analysis report includes information on upcoming trends and challenges that will influence market growth. This is to help companies strategize and leverage all forthcoming growth opportunities.
The study was conducted using an objective combination of primary and secondary information including inputs from key participants in the industry. The report contains a comprehensive market and vendor landscape in addition to an analysis of the key vendors.
Technavio presents a detailed picture of the market by the way of study, synthesis, and summation of data from multiple sources by an analysis of key parameters such as profit, pricing, competition, and promotions. It presents various market facets by identifying the key industry influencers. The data presented is comprehensive, reliable, and a result of extensive research - both primary and secondary. Technavio's market research reports provide a complete competitive landscape and an in-depth vendor selection methodology and analysis using qualitative and quantitative research to forecast accurate market growth.
Table of Contents
1 Executive Summary
- 1.1 Market overview
- Executive Summary - Chart on Market Overview
- Executive Summary - Data Table on Market Overview
- Executive Summary - Chart on Global Market Characteristics
- Executive Summary - Chart on Market By Geographical Landscape
- Executive Summary - Chart on Market Segmentation by Grade Type
- Executive Summary - Chart on Market Segmentation by End-user
- Executive Summary - Chart on Incremental Growth
- Executive Summary - Data Table on Incremental Growth
- Executive Summary - Chart on Company Market Positioning
2 Market Landscape
- 2.1 Market ecosystem
- Parent Market
- Data Table on - Parent Market
- 2.2 Market characteristics
- Market characteristics analysis
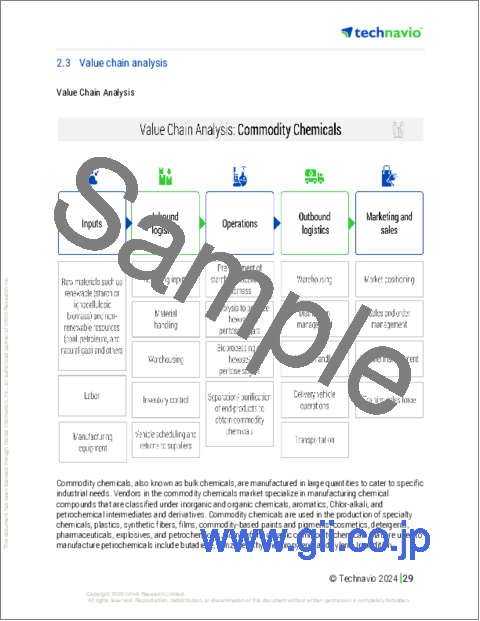
- 2.3 Value chain analysis
- Value Chain Analysis
3 Market Sizing
- 3.1 Market definition
- Offerings of companies included in the market definition
- 3.2 Market segment analysis
- Market segments
- 3.3 Market size 2023
- 3.4 Market outlook: Forecast for 2023-2028
- Chart on Global - Market size and forecast 2023-2028 ($ million)
- Data Table on Global - Market size and forecast 2023-2028 ($ million)
- Chart on Global Market: Year-over-year growth 2023-2028 (%)
- Data Table on Global Market: Year-over-year growth 2023-2028 (%)
4 Historic Market Size
- 4.1 Global Polymethacrylate In VII And Pour Point Depressant (PPD) Market 2018 - 2022
- Historic Market Size - Data Table on Global Polymethacrylate In VII And Pour Point Depressant (PPD) Market 2018 - 2022 ($ million)
- 4.2 Grade Type segment analysis 2018 - 2022
- Historic Market Size - Grade Type Segment 2018 - 2022 ($ million)
- 4.3 End-user segment analysis 2018 - 2022
- Historic Market Size - End-user Segment 2018 - 2022 ($ million)
- 4.4 Geography segment analysis 2018 - 2022
- Historic Market Size - Geography Segment 2018 - 2022 ($ million)
- 4.5 Country segment analysis 2018 - 2022
- Historic Market Size - Country Segment 2018 - 2022 ($ million)
5 Five Forces Analysis
- 5.1 Five forces summary
- Five forces analysis - Comparison between 2023 and 2028
- 5.2 Bargaining power of buyers
- Bargaining power of buyers - Impact of key factors 2023 and 2028
- 5.3 Bargaining power of suppliers
- Bargaining power of suppliers - Impact of key factors in 2023 and 2028
- 5.4 Threat of new entrants
- Threat of new entrants - Impact of key factors in 2023 and 2028
- 5.5 Threat of substitutes
- Threat of substitutes - Impact of key factors in 2023 and 2028
- 5.6 Threat of rivalry
- Threat of rivalry - Impact of key factors in 2023 and 2028
- 5.7 Market condition
- Chart on Market condition - Five forces 2023 and 2028
6 Market Segmentation by Grade Type
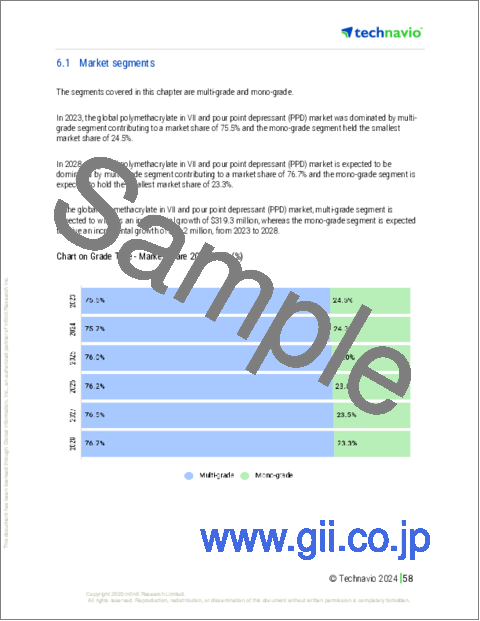
- 6.1 Market segments
- Chart on Grade Type - Market share 2023-2028 (%)
- Data Table on Grade Type - Market share 2023-2028 (%)
- 6.2 Comparison by Grade Type
- Chart on Comparison by Grade Type
- Data Table on Comparison by Grade Type
- 6.3 Multi-grade - Market size and forecast 2023-2028
- Chart on Multi-grade - Market size and forecast 2023-2028 ($ million)
- Data Table on Multi-grade - Market size and forecast 2023-2028 ($ million)
- Chart on Multi-grade - Year-over-year growth 2023-2028 (%)
- Data Table on Multi-grade - Year-over-year growth 2023-2028 (%)
- 6.4 Mono-grade - Market size and forecast 2023-2028
- Chart on Mono-grade - Market size and forecast 2023-2028 ($ million)
- Data Table on Mono-grade - Market size and forecast 2023-2028 ($ million)
- Chart on Mono-grade - Year-over-year growth 2023-2028 (%)
- Data Table on Mono-grade - Year-over-year growth 2023-2028 (%)
- 6.5 Market opportunity by Grade Type
- Market opportunity by Grade Type ($ million)
- Data Table on Market opportunity by Grade Type ($ million)
7 Market Segmentation by End-user
- 7.1 Market segments
- Chart on End-user - Market share 2023-2028 (%)
- Data Table on End-user - Market share 2023-2028 (%)
- 7.2 Comparison by End-user
- Chart on Comparison by End-user
- Data Table on Comparison by End-user
- 7.3 PCMO - Market size and forecast 2023-2028
- Chart on PCMO - Market size and forecast 2023-2028 ($ million)
- Data Table on PCMO - Market size and forecast 2023-2028 ($ million)
- Chart on PCMO - Year-over-year growth 2023-2028 (%)
- Data Table on PCMO - Year-over-year growth 2023-2028 (%)
- 7.4 HDMO - Market size and forecast 2023-2028
- Chart on HDMO - Market size and forecast 2023-2028 ($ million)
- Data Table on HDMO - Market size and forecast 2023-2028 ($ million)
- Chart on HDMO - Year-over-year growth 2023-2028 (%)
- Data Table on HDMO - Year-over-year growth 2023-2028 (%)
- 7.5 Industrial hydraulic oils - Market size and forecast 2023-2028
- Chart on Industrial hydraulic oils - Market size and forecast 2023-2028 ($ million)
- Data Table on Industrial hydraulic oils - Market size and forecast 2023-2028 ($ million)
- Chart on Industrial hydraulic oils - Year-over-year growth 2023-2028 (%)
- Data Table on Industrial hydraulic oils - Year-over-year growth 2023-2028 (%)
- 7.6 Automotive gear oils - Market size and forecast 2023-2028
- Chart on Automotive gear oils - Market size and forecast 2023-2028 ($ million)
- Data Table on Automotive gear oils - Market size and forecast 2023-2028 ($ million)
- Chart on Automotive gear oils - Year-over-year growth 2023-2028 (%)
- Data Table on Automotive gear oils - Year-over-year growth 2023-2028 (%)
- 7.7 Market opportunity by End-user
- Market opportunity by End-user ($ million)
- Data Table on Market opportunity by End-user ($ million)
8 Customer Landscape
- 8.1 Customer landscape overview
- Analysis of price sensitivity, lifecycle, customer purchase basket, adoption rates, and purchase criteria
9 Geographic Landscape
- 9.1 Geographic segmentation
- Chart on Market share By Geographical Landscape 2023-2028 (%)
- Data Table on Market share By Geographical Landscape 2023-2028 (%)
- 9.2 Geographic comparison
- Chart on Geographic comparison
- Data Table on Geographic comparison
- 9.3 APAC - Market size and forecast 2023-2028
- Chart on APAC - Market size and forecast 2023-2028 ($ million)
- Data Table on APAC - Market size and forecast 2023-2028 ($ million)
- Chart on APAC - Year-over-year growth 2023-2028 (%)
- Data Table on APAC - Year-over-year growth 2023-2028 (%)
- 9.4 Europe - Market size and forecast 2023-2028
- Chart on Europe - Market size and forecast 2023-2028 ($ million)
- Data Table on Europe - Market size and forecast 2023-2028 ($ million)
- Chart on Europe - Year-over-year growth 2023-2028 (%)
- Data Table on Europe - Year-over-year growth 2023-2028 (%)
- 9.5 North America - Market size and forecast 2023-2028
- Chart on North America - Market size and forecast 2023-2028 ($ million)
- Data Table on North America - Market size and forecast 2023-2028 ($ million)
- Chart on North America - Year-over-year growth 2023-2028 (%)
- Data Table on North America - Year-over-year growth 2023-2028 (%)
- 9.6 South America - Market size and forecast 2023-2028
- Chart on South America - Market size and forecast 2023-2028 ($ million)
- Data Table on South America - Market size and forecast 2023-2028 ($ million)
- Chart on South America - Year-over-year growth 2023-2028 (%)
- Data Table on South America - Year-over-year growth 2023-2028 (%)
- 9.7 Middle East and Africa - Market size and forecast 2023-2028
- Chart on Middle East and Africa - Market size and forecast 2023-2028 ($ million)
- Data Table on Middle East and Africa - Market size and forecast 2023-2028 ($ million)
- Chart on Middle East and Africa - Year-over-year growth 2023-2028 (%)
- Data Table on Middle East and Africa - Year-over-year growth 2023-2028 (%)
- 9.8 China - Market size and forecast 2023-2028
- Chart on China - Market size and forecast 2023-2028 ($ million)
- Data Table on China - Market size and forecast 2023-2028 ($ million)
- Chart on China - Year-over-year growth 2023-2028 (%)
- Data Table on China - Year-over-year growth 2023-2028 (%)
- 9.9 US - Market size and forecast 2023-2028
- Chart on US - Market size and forecast 2023-2028 ($ million)
- Data Table on US - Market size and forecast 2023-2028 ($ million)
- Chart on US - Year-over-year growth 2023-2028 (%)
- Data Table on US - Year-over-year growth 2023-2028 (%)
- 9.10 Japan - Market size and forecast 2023-2028
- Chart on Japan - Market size and forecast 2023-2028 ($ million)
- Data Table on Japan - Market size and forecast 2023-2028 ($ million)
- Chart on Japan - Year-over-year growth 2023-2028 (%)
- Data Table on Japan - Year-over-year growth 2023-2028 (%)
- 9.11 Germany - Market size and forecast 2023-2028
- Chart on Germany - Market size and forecast 2023-2028 ($ million)
- Data Table on Germany - Market size and forecast 2023-2028 ($ million)
- Chart on Germany - Year-over-year growth 2023-2028 (%)
- Data Table on Germany - Year-over-year growth 2023-2028 (%)
- 9.12 France - Market size and forecast 2023-2028
- Chart on France - Market size and forecast 2023-2028 ($ million)
- Data Table on France - Market size and forecast 2023-2028 ($ million)
- Chart on France - Year-over-year growth 2023-2028 (%)
- Data Table on France - Year-over-year growth 2023-2028 (%)
- 9.13 Market opportunity By Geographical Landscape
- Market opportunity By Geographical Landscape ($ million)
- Data Tables on Market opportunity By Geographical Landscape ($ million)
10 Drivers, Challenges, and Opportunity/Restraints
- 10.1 Market drivers
- 10.2 Market challenges
- 10.3 Impact of drivers and challenges
- Impact of drivers and challenges in 2023 and 2028
- 10.4 Market opportunities/restraints
11 Competitive Landscape
- 11.1 Overview
- 11.2 Competitive Landscape
- Overview on criticality of inputs and factors of differentiation
- 11.3 Landscape disruption
- Overview on factors of disruption
- 11.4 Industry risks
- Impact of key risks on business
12 Competitive Analysis
- 12.1 Companies profiled
- Companies covered
- 12.2 Market positioning of companies
- Matrix on companies position and classification
- 12.3 Additive-Chemie Luers GmbH and Co. KG
- Additive-Chemie Luers GmbH and Co. KG - Overview
- Additive-Chemie Luers GmbH and Co. KG - Product / Service
- Additive-Chemie Luers GmbH and Co. KG - Key offerings
- 12.4 American Hitech Petroleum and Chemicals Inc.
- American Hitech Petroleum and Chemicals Inc. - Overview
- American Hitech Petroleum and Chemicals Inc. - Product / Service
- American Hitech Petroleum and Chemicals Inc. - Key offerings
- 12.5 DANA Lubricants Factory LLC
- DANA Lubricants Factory LLC - Overview
- DANA Lubricants Factory LLC - Product / Service
- DANA Lubricants Factory LLC - Key offerings
- 12.6 Evonik Industries AG
- Evonik Industries AG - Overview
- Evonik Industries AG - Business segments
- Evonik Industries AG - Key news
- Evonik Industries AG - Key offerings
- Evonik Industries AG - Segment focus
- 12.7 Functional Products Inc.
- Functional Products Inc. - Overview
- Functional Products Inc. - Product / Service
- Functional Products Inc. - Key offerings
- 12.8 Infineum International Ltd.
- Infineum International Ltd. - Overview
- Infineum International Ltd. - Product / Service
- Infineum International Ltd. - Key offerings
- 12.9 Jinzhou Kangtai Lubricant Additives Co. Ltd.
- Jinzhou Kangtai Lubricant Additives Co. Ltd. - Overview
- Jinzhou Kangtai Lubricant Additives Co. Ltd. - Product / Service
- Jinzhou Kangtai Lubricant Additives Co. Ltd. - Key offerings
- 12.10 Jinzhou Runda Chemical Co. Ltd.
- Jinzhou Runda Chemical Co. Ltd. - Overview
- Jinzhou Runda Chemical Co. Ltd. - Product / Service
- Jinzhou Runda Chemical Co. Ltd. - Key offerings
- 12.11 Kusa Chemicals Pvt Ltd.
- Kusa Chemicals Pvt Ltd. - Overview
- Kusa Chemicals Pvt Ltd. - Product / Service
- Kusa Chemicals Pvt Ltd. - Key offerings
- 12.12 Mitsubishi Chemical Group Corp.
- Mitsubishi Chemical Group Corp. - Overview
- Mitsubishi Chemical Group Corp. - Business segments
- Mitsubishi Chemical Group Corp. - Key news
- Mitsubishi Chemical Group Corp. - Key offerings
- Mitsubishi Chemical Group Corp. - Segment focus
- 12.13 NewMarket Corp.
- NewMarket Corp. - Overview
- NewMarket Corp. - Business segments
- NewMarket Corp. - Key offerings
- NewMarket Corp. - Segment focus
- 12.14 Nouryon Chemicals Holding BV
- Nouryon Chemicals Holding BV - Overview
- Nouryon Chemicals Holding BV - Business segments
- Nouryon Chemicals Holding BV - Key offerings
- Nouryon Chemicals Holding BV - Segment focus
- 12.15 Ter Group
- Ter Group - Overview
- Ter Group - Product / Service
- Ter Group - Key offerings
- 12.16 The Lubrizol Corp.
- The Lubrizol Corp. - Overview
- The Lubrizol Corp. - Product / Service
- The Lubrizol Corp. - Key offerings
- 12.17 Zhengzhou Chorus Lubricant Additive Co. Ltd.
- Zhengzhou Chorus Lubricant Additive Co. Ltd. - Overview
- Zhengzhou Chorus Lubricant Additive Co. Ltd. - Product / Service
- Zhengzhou Chorus Lubricant Additive Co. Ltd. - Key offerings
13 Appendix
- 13.1 Scope of the report
- 13.2 Inclusions and exclusions checklist
- Inclusions checklist
- Exclusions checklist
- 13.3 Currency conversion rates for US$
- Currency conversion rates for US$
- 13.4 Research methodology
- Research methodology
- 13.5 Data procurement
- Information sources
- 13.6 Data validation
- Data validation
- 13.7 Validation techniques employed for market sizing
- Validation techniques employed for market sizing
- 13.8 Data synthesis
- Data synthesis
- 13.9360 degree market analysis
- 360 degree market analysis
- 13.10 List of abbreviations
- List of abbreviations

